

Abstract
Aims:
We aimed to identify long-term HbA1c trajectories and examine associated characteristics in an observational, childhood-onset (<17 years) type 1 diabetes cohort.
Methods:
Data are from the Epidemiology of Diabetes Complications study, comprising 405 participants with ≥2 of 7 possible HbA1c measurements over follow-up (1988-2013) and available DNA (baseline mean diabetes duration 21 years, 53% men). HbA1c trajectories were estimated using latent class growth models. Baseline and change in participant characteristics were compared across trajectories.
Results:
Five HbA1c trajectories were identified: Low (51%), Intermediate Stable (22%), Improved (19%), High Stable (6%), and Worsened (2%; not included in analyses). Age, diabetes duration, diabetes onset age, and sex did not differ across trajectories. Characteristics did not differ significantly between Intermediate Stable and Low trajectories at baseline, though albumin excretion rate (AER,p=0.0002) and estimated glomerular filtration rate (eGFR,p=0.001) worsened slightly more in Intermediate Stable over time. Improved and High Stable trajectories had higher baseline LDL-c (p=0.002 and 0.003, respectively). Improved trajectory increased median self-monitoring of blood glucose from <1 to 3.5 times/day (p<0.0001) and had larger LDL-c improvement (p=0.004), but greater worsening of AER (p<0.0001) and eGFR (p<0.0001) than Low. The A allele of rs12970134 (near MC4R) was associated with Improved (p=0.0003) or High Stable (p=0.001) HbA1c trajectory, both patterns with high baseline HbA1c.
Conclusions:
Long-term HbA1c trajectories were primarily associated with modifiable factors in this type 1 diabetes cohort. The Intermediate Stable pattern had a risk factor profile that suggests some protection against adverse metabolic effects of chronic hyperglycaemia, warranting further study.
Keywords: cohort study, glycaemic control, HbA1c, latent class growth models, trajectories, type 1 diabetes
Prior Abstract Publication
An abstract including related preliminary results was presented at the 80th Scientific Sessions of the American Diabetes Association, virtual meeting, June 25-29, 2020. Miller RG, Orchard TJ, Costacou T. Long-Term HbA1c Trajectories and Mortality and Major Atherosclerotic Cardiovascular Events in Type 1 Diabetes [abstract]. Diabetes. 2020; 69 (suppl 1).
INTRODUCTION
While poor glycaemic control is a well-established risk factor for mortality and complications in type 1 diabetes, long-term HbA1c patterns have not been well-studied. Group-based latent class trajectory analysis facilitates identification of clusters of individuals with similar longitudinal patterns of a factor over time (1). Several studies have used this method to examine HbA1c patterns in cohorts of children and adolescents with type 1 diabetes (2-11), with a particular focus on the child to adult transition period (2,5,7-10). To our knowledge, there are no reports using this approach to characterize the natural history of HbA1c patterns during adulthood in people with childhood-onset type 1 diabetes. Determining characteristics associated with heterogeneous patterns of glycaemic exposure may increase understanding of factors leading to different glycaemic trajectories and help identify potential intervention targets. Thus, we sought to identify long-term HbA1c trajectories over 23 years of follow-up and examine associated clinical, socioeconomic, and candidate genetic characteristics in a prospective, observational cohort with type 1 diabetes.
PARTICIPANTS AND METHODS
Study Population
The Pittsburgh Epidemiology of Diabetes Complications (EDC) study is a prospective cohort study of childhood-onset (<17 years old) type 1 diabetes. All participants (n=658) were diagnosed with type 1 diabetes, or seen within one year of diagnosis, at Children’s Hospital of Pittsburgh between 1950-1980. The cohort has been described in detail (12). Participants have been followed since 1986-1988, with biennial examinations and questionnaires for the first ten years and thereafter with biennial questionnaires and further examinations in 2004-2006 and 2011-2013. Research protocols were approved by the University of Pittsburgh institutional review board (approval #19040065). All participants provided written informed consent.
Figure S1 details determination of the analytic sample for this sub-study. Of 496 participants who consented to DNA extraction, 453 had DNA available in 2015 when genotyping was conducted. After excluding participants not passing genotyping quality control (n=12), participants of non-European ancestry (n=9), one randomly-selected individual from each of 10 first-degree relative pairs, and participants with <2 HbA1c measurements (n=17), the final analytic sample comprised 405 participants.
HbA1c Assessments
HbA1 was measured at five visits (1988-90, 1990-92, 1992-94, 1994-96, 1996-98); HbA1c was measured at two visits (2004-06, 2011-13). Each participant could have a maximum of seven measures over 23 years. From 1988-1998, HbA1 was measured using automated high-performance liquid chromatography (Diamat; Biorad, Hercules, CA) and converted to DCCT-aligned HbA1c values using a validated regression equation derived from duplicate assays (DCCT HbA1c=0.14 + 0.83[EDC HbA1]) (13). At the 2004-06 and 2011-13 visits, HbA1c was measured using the DCA 2000 analyser (Bayer Healthcare LLC. Elkhart, IN) and converted to DCCT-aligned HbA1c with the equation: DCCT HbA1c=(EDC HbA1c-1.13)/0.81 (13).
Clinical and Socioeconomic Characteristics
Risk factor measures were available at the same time points as HbA1c. Blood pressure (BP), cholesterol, triglycerides, and urinary albumin were measured using standard methods, which have previously been described (14). Albumin excretion rate (AER) was calculated for three timed urine samples (24-hour, overnight, and 4-hour collections); the median was used in analysis. Glomerular filtration rate (eGFR) was estimated by the CKD-EPI creatinine equation (15). Estimated glucose disposal rate (eGDR), a validated, inverse measure of insulin resistance (16), was calculated using the equation: eGDR (mg/kg/min)=24.395-(12.971*Waist-Hip Ratio)-(3.388*Hypertension)-(0.601*HbA1c), where Hypertension is BP ≥140/90 mmHg or BP-lowering medication (0=no, 1=yes). Smoking status, insulin regimen, and frequency of self-blood glucose monitoring (SMBG) were obtained via self-administered questionnaire. Insulin dose is total insulin units/day divided by body weight (kg).
Socioeconomic status (SES), including highest education and professional employment status, was assessed at the visit closest to age 28 years, as described previously (17). Briefly, baseline education and employment status cannot accurately assess SES in this cohort, as it includes young adults who had not yet completed their education/ attained professional employment at baseline. The “age 28” methodology permits reasonable establishment of educational and occupational attainment, while minimizing the effect of advanced diabetes complications on employment potential. Highest level of education (<bachelor’s degree, ≥bachelor’s degree) was ascertained via self-report. Professional (Hollingshead 1A–3C) or nonprofessional (Hollingshead 4A–7X) employment was defined using the Hollingshead Index of Social Position (18).
Genotyping and Selection of Candidate Single Nucleotide Polymorphisms (SNPs)
Genotyping was performed using the Infinium HumanCore Exome-24 BeadChip (Illumina, San Diego, CA). Minimac3/Minimac3-omp version 1.0.14 was used for imputation, with the 1000 Genomes Project (1KG) Phase 3 version 5 reference panel (updated Oct 20, 2015). Candidate SNPs were significantly associated with HbA1c in previously published genome-wide association studies (GWAS) (19,20). Twenty-three SNPs were reported; seven SNPs with minor allele frequencies <0.05 were excluded from analyses. We also examined an additional candidate previously associated with continuous HbA1c in this cohort, rs12970134 (21). Thus, 17 candidate SNPs were analysed on HbA1c trajectories.
Statistical Analyses
The group-based developmental trajectory approach is based on finite mixture models (1,22). Optimal trajectories were determined using a two-stage method in a censored normal model (22). In the first stage, we identified the number of trajectories describing the latent patterns of HbA1c in our data set and in the second stage, determined the optimal functional form of these trajectories. This two-stage method is a robust approach because the primary aim of group-based trajectory analysis is to identify the number of trajectories, while specific functional form is of secondary importance. In the first stage, we assumed all trajectories were linear (i.e., the simplest functional form allowing for increase or decrease over time). Models with increasing number of trajectories were compared using the Bayesian Information Criterion (Table S1) and 95% confidence bands were visually assessed to ensure minimal overlap. In the second stage, the optimal functional form (constant, linear, quadratic, or cubic) of each trajectory identified in stage 1 was assessed using the significance level of each polynomial term in the equation. In this step, all trajectories were first modelled as cubic functions (i.e., 3rd order polynomial, β0 + βt + βt2 + βt3) and any term with p>0.05 was eliminated. Primary analyses were restricted to participants with ≥2 HbA1c measurements. A sensitivity analysis was performed in participants with ≥3 measurements. The trajectory analysis was performed using the PROC TRAJ macro (SAS 9.4, SAS Institute Inc., Cary, NC) (1).
Baseline characteristics were compared across trajectories using general linear models (PROC GLM, SAS 9.4) for continuous variables and logistic regression for dichotomous variables, with the characteristic of interest as the dependent variable and trajectory as an independent class variable. The distribution of continuous variables was assessed and values were transformed before performing statistical comparisons, when appropriate. For each variable, if p<0.05 for the overall trajectory effect, pairwise comparisons were performed between the Low trajectory (reference group) and each of the other trajectories using a Bonferroni-corrected significance level of p<0.0125. Multivariable logistic regression models were fit using backward selection (p<0.0125 to be retained) to determine independent associations between baseline characteristics and trajectory membership for each trajectory compared to the Low trajectory.
Generalized linear mixed models (PROC GLIMMIX, SAS 9.4) assessed risk factor change over time (years), using all available data for each participant. Slopes over time were compared between the Low trajectory and each of the other trajectories, in separate models, using an interaction term (trajectory indicator variable x time). For dichotomous factors a binary distribution and logit link function were specified. Time-varying dichotomous indicator variables (0=no, 1=yes) were used to adjust systolic and diastolic BP for BP-lowering medication use, cholesterol variables for lipid-lowering medication, and eGFR for renin-angiotensin-system blocker use at each time point.
Candidate SNP associations were assessed in additive logistic regression models to estimate the odds of membership in each trajectory compared to the Low trajectory, adjusting for sex and principal components of ancestry, using a Bonferroni-corrected significance level of p<0.0125.
RESULTS
The median number of HbA1c measures was six of a possible seven (interquartile range [IQR] 4-7), over median 16 years’ follow-up (IQR 6-23). Trajectory analysis identified five HbA1c patterns (Figure 1). “Low” maintained HbA1c <67 mmol/mol (8.3%) (median 6 HbA1c measures). “Intermediate Stable” maintained HbA1c of approximately 75 mmol/mol (9.0%) (median 6 HbA1c measures). “Improved” began with poor control (89 mmol/mol [10.3%]) but improved (median 5 HbA1c measures). “High Stable” maintained HbA1c of approximately 97 mmol/mol (11.0%) (median 5 HbA1c measures). Finally, “Worsened” represented a small number of participants (n=7) in intermediate control (71 mmol/mol [8.7%]) for the first 4-6 years, whose control severely deteriorated by the end of follow-up (median 6 HbA1c measures). Despite its small size, the Worsened pattern is of clinical interest and retaining it significantly improved model fit. Additionally, most characteristics of the participants in this pattern had small standard deviations, indicating low within-group variance, further suggesting that this group represents a distinct pattern. Thus, Worsened trajectory was retained for descriptive purposes, but not included in statistical comparisons. In a sensitivity analysis, trajectory modelling was repeated in participants with ≥3 HbA1c measurements (n=372, Figure S2). The results were nearly identical to the analysis of ≥2 HbA1c measurements. Thus, only results for ≥2 measurements are reported to maximize sample size.
Figure 1.
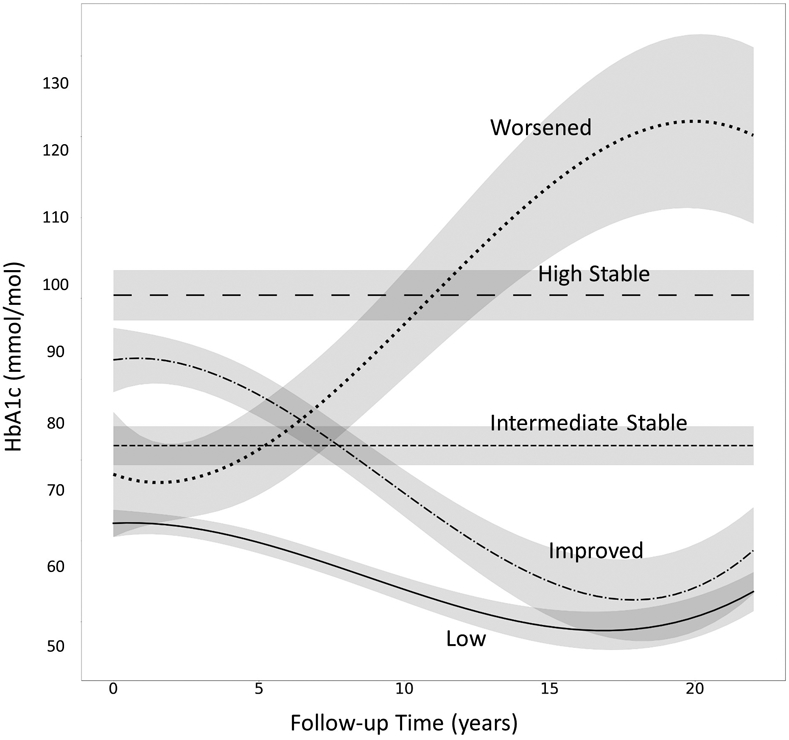
23-Year fitted HbA1c trajectories with 95% confidence bands. HbA1c measurements were collected at 0 (baseline), 2, 4, 6, 8, 16, and 23 years. Low (solid line), 51% of the cohort. Intermediate Stable (short dashed line), 19%. Improved (dash dotted line), 22%. High Stable (long dashed line), 6%. Worsened (dotted line), 2%.
At baseline, there were no differences in age, age at diabetes onset, diabetes duration, sex, BMI, insulin dose, BP, or AER, by trajectory (Table 1). Baseline characteristics of participants with the Intermediate Stable trajectory were similar to the Low trajectory. The Improved trajectory had lower eGDR (i.e., worse insulin sensitivity), and higher total cholesterol, LDL- and nonHDL-cholesterol, and triglycerides compared to the Low trajectory. The High Stable trajectory had lower eGDR, higher total cholesterol, LDL- and nonHDL- cholesterol, higher eGFR, and a greater proportion currently smoking. A lower proportion of participants with a High Stable trajectory were professionally employed, though pairwise comparison with Low trajectory did not reach statistical significance.
Table 1.
Baseline characteristics by HbA1c trajectory
| HbA1c Trajectory | ||||||
|---|---|---|---|---|---|---|
| Low | Intermediate Stable |
Improved | High Stable | Worsened | p-value for overall differencea |
|
| n | 205 | 77 | 91 | 25 | 7 | - |
| Age, years | 29.9 (7.4) | 29.8 (7.2) | 29.6 (8.7) | 27.1 (8.7) | 23.2 (6.0) | 0.398 |
| Age at T1D Onset, years | 8.2 (3.9) | 8.5 (4.3) | 8.5 (4.1) | 9.1 (3.9) | 7.0 (4.4) | 0.728 |
| T1D Duration, years | 21.7 (7.5) | 21.4 (7.0) | 21.1 (7.8) | 17.9 (8.5) | 16.2 (6.3) | 0.141 |
| Women, % (n) | 47.8% (98) | 54.6% (42) | 44.0% (40) | 40.0% (10) | 28.6% (2) | 0.469 |
| BMI, kg/m2 | 24.3 (3.3) | 24.2 (2.9) | 24.0 (3.3) | 23.5 (3.4) | 26.0 (2.7) | 0.695 |
| HbA1c, mmol/mol | 66 (11.8) | 75 (12.3)* | 89 (12.8)* | 97 (15.0)* | 71 (7.7) | <0.001 |
| % | 8.2 (1.1) | 9.0 (1.1)* | 10.3 (1.2)* | 11.0 (1.4)* | 8.7 (0.7) | - |
| eGDR, mg/kg/min | 8.0 (2.0) | 7.8 (1.6) | 6.4 (2.0)* | 5.8 (2.0)* | 7.9 (1.2) | <0.001 |
| Insulin Dose, insulin units per kg body weight | 0.77 (0.25) | 0.79 (0.24) | 0.78 (0.24) | 0.78 (0.26) | 0.97 (0.26) | 0.934 |
| ≥3 Insulin Injections/Day or Insulin Pump Use | 15.4% (31) | 11.8% (9) | 11.1% (10) | 4.0% (1) | 14.3% (1) | 0.404 |
| Checks blood sugar ≥1 time/week | 75.6% (155) | 70.1% (54) | 72.5% (66) | 64.0% (16) | 57.1% (4) | 0.562 |
| Systolic BP, mmHg | 115.8 (18.2) | 113.2 (15.9) | 114.4 (18.5) | 116.6 (18.5) | 111.0 (6.7) | 0.686 |
| Diastolic BP, mmHg | 73.0 (10.8) | 71.6 (11.6) | 73.2 (10.6) | 74.3 (13.7) | 72.9 (8.1) | 0.689 |
| Hypertension, % (n) | 22.4% (46) | 11.7% (9) | 24.2% (22) | 24.0% (6) | 0% (0) | 0.119 |
| Total Cholesterol, mmol/l | 4.7 (1.13) | 4.8 (0.90) | 5.1 (1.07)* | 5.5 (1.26)* | 4.4 (0.67) | <0.001 |
| HDLc, mmol/l | 1.4 (0.33) | 1.4 (0.35) | 1.4 (0.31) | 1.5 (0.35) | 1.2 (0.19) | 0.119 |
| LDLc, mmol/l | 2.8 (0.91) | 3.0 (0.85) | 3.2 (0.88)* | 3.4 (1.02)* | 2.7 (0.80) | 0.002 |
| Non-HDLc, mmol/l | 3.4 (1.09) | 3.4 (0.92) | 3.8 (1.06)* | 4.0 (1.25)* | 3.2 (0.73) | 0.002 |
| Triglycerides, mmol/l Median (IQR) | 0.9 (0.6- 1.3) | 0.9 (0.6- 1.4) | 1.0 (0.7- 1.6)* | 1.3 (0.7-1.7) | 1.0 (0.9- 1.4) | 0.034 |
| AER, μg/min Median (IQR) | 11.2 (5.9-94.9) | 11.9 (6.6-74.6) | 14.7 (7.4-120.0) | 16.4 (8.1-50.9) | 6.1 (3.1-123.8) | 0.618 |
| eGFR, mL/min/1.73m2 | 104.1 (33.1) | 112.6 (29.3) | 113.4 (36.8) | 130.9 (43.9)* | 136.3 (11.0) | <0.001 |
| Ever Smoker, % (n) | 34.7% (70) | 31.6% (24) | 34.4% (31) | 44.0% (11) | 14.3% (1) | 0.736 |
| Current Smoker, % (n) | 15.4% (31) | 21.1% (16) | 27.0% (24) | 36.0% (9)* | 14.3% (1) | 0.031 |
| ≥Bachelor’s Degree, % (n) | 39.5% (81) | 26.0% (20) | 36.3% (33) | 32.0% (8) | 0% (0) | 0.207 |
| Professional Employment, % (n) | 42.9% (85) | 26.0% (20) | 31.8% (27) | 20.5% (5) | 28.6% (2) | 0.025 |
Comparison excludes Worsened pattern due to small sample size
Significantly different (p<0.0125) than Low pattern (reference)
The Intermediate Stable trajectory did not differ from Low in any factors at baseline, so multivariable analysis was not performed in this group. Non-HDLc (OR=1.01, 95% CI 1.004, 1.016) was independently associated with Improved trajectory compared to Low. Non-HDLc (OR=1.02, 95% CI 1.01, 1.03) and eGFR (OR=1.03, 95% CI 1.01, 1.04) were independently associated with the High trajectory.
Increases in the proportion using ≥3 insulin injections/day or pump were similar across trajectories (Figure 2a). In contrast, change in SMBG frequency differed, with Intermediate Stable (p=0.002) and High Stable HbA1c (p<0.001) trajectories increasing less than the Low trajectory (Figure 2b).
Figure 2.

Proportion using ≥3 insulin injections per day or pump (panel a) and median self-monitoring of blood glucose (SMBG) frequency per day (panel b) over time by HbA1c trajectory. SMBG data were not available at the first study visit (time 0). The Worsened trajectory was excluded due to small sample size. There were no significant differences in change in ≥3 insulin injections/pump use over time in any trajectory compared to Low (panel a). Intermediate Stable (p=0.002) and High Stable (p<0.001) had significantly smaller increases in SMBG over time compared to Low (panel b).
Estimated change in clinical risk factors are in Table 2. The Intermediate Stable trajectory had changes similar to the Low trajectory, except for a greater increase in AER and larger decrease in eGFR. The Improved trajectory had greater worsening of BMI, AER, and eGFR compared to the Low trajectory, but also had significantly greater improvements in eGDR, total cholesterol, LDL-c, and HDL-c. The High Stable trajectory had a greater increase in AER and greater decrease in eGFR compared to the Low trajectory. Summary statistics of clinical factors at time of last HbA1c measurement are in Table S2.
Table 2.
Estimated absolute change per year by HbA1c trajectory
| HbA1c Trajectory | |||||||
|---|---|---|---|---|---|---|---|
| Low | Intermediate Stable | Improved | High Stable | ||||
| n | 205 | 77 | 91 | 25 | |||
| β (SE) | β (SE) | p-value* | β (SE) | p-value* | β (SE) | p- value* |
|
| BMI, kg/m2 | +0.165 (0.007) |
+0.156 (0.015) |
0.545 |
+0.259 (0.0158) |
<0.001 | +0.188 (0.0253) |
0.346 |
| eGDR, mg/kg/min | −0.033 (0.006) |
−0.055 (0.010) |
0.048 |
+0.018 (0.012) |
<0.001 | −0.055 (0.024) |
0.217 |
| Insulin dose, insulin units per kg body weight | −0.009 (0.001) |
−0.008 (0.001) |
0.408 | −0.008 (0.002) |
0.471 | −0.010 (0.003) |
0.495 |
| Systolic BP, mmHga | +0.050 (0.128) |
+0.070 (0.095) |
0.855 | +0.307 (0.099) |
0.381 | +0.454 (0.210) |
0.400 |
| Diastolic BP, mmHga | −0.356 (0.034) |
−0.431 (0.062) |
0.611 | −0.335 (0.065) |
0.462 |
−0.041 (0.121) |
0.001 |
| Total Cholesterol, mmol/l b | +0.004 (0.004) |
+0.015 (0.006) |
0.164 |
−0.032 (0.009) |
0.003 | +0.007 (0.016) |
0.851 |
| HDLc, mmol/l b | +0.011 (0.001) |
+0.009 (0.002) |
0.059 | +0.006 (0.002) |
0.006 | +0.007 (0.004) |
0.046 |
| LDLc, mmol/l b | −0.004 (0.004) |
+0.005 (0.005) |
0.472 |
−0.035 (0.008) |
0.004 | +0.003 (0.016) |
0.736 |
| Non-HDLc, mmol/l b | −0.007 (0.004) |
+0.006 (0.006) |
0.042 | −0.038 (0.008) |
0.021 | +0.006 (0.016) |
0.438 |
| Triglycerides, mmol/l | −0.004 (0.003) |
−0.002 (0.004) |
0.770 | −0.008 (0.005) |
0.456 | −0.013 (0.013) |
0.418 |
| AER, μg/min | −0.956 (1.007) |
+1.008 (1.011) |
<0.001 |
+1.017 (1.015) |
<0.001 |
+1.159 (1.025) |
<0.001 |
| eGFR, mL/min/1.73m2 c | −0.971 (0.076) |
−1.456 (0.117) |
0.008 |
−2.155 (0.163) |
<0.001 |
−3.125 (0.307) |
<0.001 |
Values are β (i.e., units per 1-year increment) (standard error).
Worsened pattern excluded due small sample size.
p-value for comparison to Low, values where p<0.0125 are in bold
Adjusted for blood pressure medication use at each time point
Adjusted for lipid lowering medication use at each time point
Adjusted for renin-angiotensin-system agent use at each time point
Of the 17 candidate SNPs examined, only rs12970134 (154 kb 3’ of MC4R) was significantly associated with HbA1c trajectory (Table S3). Each additional A allele of rs12970134 was associated with a 2-fold increased odds of having an Improved trajectory (p<0.001) and a 2.8-fold increased odds of a High Stable trajectory (p=0.001), compared to the Low trajectory.
DISCUSSION
We identified five HbA1c trajectories in this type 1 diabetes cohort, demonstrating important heterogeneity in long-term patterns of glycaemic control. Interestingly, there was little difference in diabetes self-management behaviours across the Low, Intermediate, and Improved HbA1c trajectories. The Intermediate Stable HbA1c trajectory was characterized by a relatively favourable risk factor profile over time despite chronic, moderate elevation of HbA1c, suggesting some resistance to adverse effects of hyperglycemia. Finally, to our knowledge, this is the first report examining the association between candidate genetic variants and HbA1c trajectories in type 1 diabetes. The A allele of rs12970134 (near MC4R) was associated with an Improved or High Stable HbA1c trajectory, both patterns with baseline HbA1c ≥89 mmol/mol (10%).
We identified generally similar patterns in the current cohort, with mean age 27 years at baseline, to prior studies in children and young adults. Low, intermediate, and high stable HbA1c patterns (2-11), as well as worsening patterns (2-5,8-11), were common across prior studies. The general lack of improving patterns in those studies is likely because they were conducted during the child to adult transition period when deterioration of glycaemic control is common in type 1 diabetes (8). Additionally, the follow-up period of the current study, 1988-90 to 2011-13, includes the period when intensive insulin therapy was being widely adopted following the results of the DCCT (23), likely contributing to the substantial HbA1c improvement observed in one pattern.
The Intermediate Stable HbA1c trajectory was characterized by a generally good risk factor profile. This trajectory had significantly greater worsening of both AER and eGFR, compared to Low, but even at the most recent visit, most participants with an Intermediate Stable trajectory had AER below the microalbuminuria threshold of 20 μg/min. These results suggest that people with moderately elevated, but stable, HbA1c may be somewhat resistant to adverse metabolic effects of chronic hyperglycaemia. In the Joslin 50-Year Medalist Study of extreme duration type 1 diabetes, HbA1c was not associated with microvascular complications (24), supporting the hypothesis that there may be a subgroup of people with type 1 diabetes who are resistant to vascular damage generally associated with suboptimal HbA1c. Thus far, we have not identified protective factors in the Intermediate Stable HbA1c trajectory; further examination of this pattern will be the subject of future research.
As expected, given their similarly poor glycaemic control at baseline, those with Improved and High Stable HbA1c trajectories both had poor baseline insulin sensitivity and lipid profiles. Over time, the Improved group had improvement in these factors, while High Stable continued to have both worse insulin sensitivity and lipids. The close association between glycemic control and lipids is consistent with prior data (25). Additionally, AER and eGFR worsened in both trajectories, though to a greater degree in High Stable. Thus, a history of poor glycaemic control may be associated with continuing microvascular damage despite improving control, but this damage is, unsurprisingly, worse when glycaemic control remains consistently poor. These findings are consistent with prior data showing that improving HbA1c is associated with an intermediate eGFR trajectory between those with low and high stable HbA1c (26).
Changes in self-management behaviours, especially SMBG, likely explain why these two trajectories with similarly poor baseline HbA1c diverged over time. Improved had a larger increase in SMBG frequency, with median SMBG=3.5 times/day by the end of follow-up. In contrast, High Stable’s median SMBG=1.5 times/day at the most recent visit. Prior reports have found a stronger association between poor HbA1c trajectories and SMBG frequency than insulin regimen (3,5,8). Given these consistent associations, it is concerning that median SMBG frequency in all HbA1c trajectories except Low fell below the American Diabetes Association’s recommended 4 times/day, even at the most recent visit, in this cohort. A recent study from Sweden also found that a majority of type 1 diabetes patients were not meeting SMBG guidelines, despite glucose meters and test strips being available free of cost in Sweden (27). These findings support a continued need for emphasis on SMBG in clinical practice and a better understanding of the barriers to adopting this practice.
Genetic variants previously associated with glycaemia in GWAS are not associated with HbA1c trajectory in this cohort. The A allele of rs12970134 was associated with the two patterns (Improved or High Stable) with high HbA1c at baseline. As these two patterns diverged dramatically over time, this SNP is not likely associated with trajectory per se, but rather with an underlying susceptibility to poor glycaemic control. Furthermore, this SNP was not associated with an Intermediate Stable trajectory. Thus, rs12970134 may reflect susceptibility to more extreme HbA1c elevation. This finding is consistent with recent data from the EarlyBird cohort, where the rs12970134 A-allele was associated with 12-year fasting glucose trajectory >75th percentile in healthy children, but not associated when a 50th percentile cut-point was examined (28).
Strengths and Limitations
The EDC is a well-characterized, prospective study with long-term follow-up previously shown to be epidemiologically representative of childhood-onset type 1 diabetes (29). The study has longitudinal data on many variables allowing a comprehensive examination of characteristics associated with HbA1c trajectory. One limitation is, given the follow-up length, the early HbA1c measures occurred long ago and much of the time represented occurred prior to the current therapeutic model. However, in the US, average HbA1c has not markedly improved since EDC baseline, with HbA1c >64 mmol/mol (8%) in contemporary youth/young adults with type 1 diabetes (30). Additionally, we assessed diabetes management factors and medication use over time, thus accounting for changes in therapy. Participants were not followed at regular intervals after the first 8 years, but as most participants had data through the end of follow-up it is unlikely additional interim measures would meaningfully change the trajectories identified. Another limitation is that the EDC cohort is 98% Caucasian, due to the demographics of Allegheny County, Pennsylvania (<15% African American) and lower incidence of type 1 diabetes among African Americans during the period when the cohort was diagnosed. The small number of non-white participants were excluded from the genetic sub-cohort examined here, thus it is unknown whether these results apply to non-white populations. Another limitation is the possibility that complication development during follow-up affected risk factor change, however we have at least partially addressed this issue by adjusting for medication use. Finally, while we corrected the significance level for the number of groups, type 1 error is possible given the large number of statistical comparisons performed on this relatively small cohort.
Conclusions
Heterogeneity in long-term trajectories of HbA1c is primarily associated with modifiable factors in this type 1 diabetes cohort. Importantly, patients with intermediate stable HbA1c can be somewhat protected from the adverse metabolic effects of chronic hyperglycaemia. Thus, in such patients who are not achieving HbA1c goals, our results emphasize the importance of controlling other cardiometabolic factors so consequences of the failure to meet glycaemic targets are minimised. Future research should examine this group in particular, as well as how long-term HbA1c trajectories relate to complication risk.
Supplementary Material
What’s new?
Heterogeneous patterns of glycaemic control have been described in children/adolescents with type 1 diabetes, but have not been well studied during adulthood.
Over 23 years, five HbA1c patterns were observed during adulthood, characterized by modifiable clinical and diabetes self-management characteristics, especially self-monitoring of blood glucose, but not age, diabetes duration, age at diabetes onset, or sex.
Participants with a moderately elevated (~75 mmol/mol [9.0%]), but stable, HbA1c pattern had a relatively good risk factor profile over time, suggesting resistance to some of the adverse effects of chronic hyperglycaemia in this group.
Acknowledgments
Sources of Funding
The EDC sub-study presented here is supported by American Diabetes Association Grant number 1-19-JDF-109. The parent EDC study is supported by the National Institute of Diabetes and Digestive and Kidney Diseases at the National Institutes of Health (Grant No. R01-DK034818) and the Rossi Memorial Fund. The study funders were not involved in study design, data collection, data analysis, manuscript preparation, or publication decisions.
Footnotes
Conflicts of Interest Disclosure
None declared
DATA AVAILABILITY
Data may be made available from the corresponding author upon reasonable request.
REFERENCES
- 1.Jones BL, Nagin DS. Advances in group-based trajectory modeling and an SAS procedure for estimating them. Sociol Methods Res. 2007;35(4):542–71. [Google Scholar]
- 2.Luyckx K, Seiffge-Krenke I. Continuity and change in glycemic control trajectories from adolescence to emerging adulthood: Relationships with family climate and self-concept in type 1 diabetes. Diabetes Care. 2009;32(5):797–801. [DOI] [PMC free article] [PubMed] [Google Scholar]
- 3.Helgeson VS, Snyder PR, Seltman H, Escobar O, Becker D, Siminerio L. Brief report: Trajectories of glycemic control over early to middle adolescence. J Pediatr Psychol. 2010;35(10):1161–7. [DOI] [PMC free article] [PubMed] [Google Scholar]
- 4.King PS, Berg CA, Butner J, Drew LM, Foster C, Donaldson D, et al. Longitudinal trajectories of metabolic control across adolescence: Associations with parental involvement, adolescents’ psychosocial maturity, and health care utilization. J Adolesc Heal. 2012. May 1;50(5):491–6. [DOI] [PMC free article] [PubMed] [Google Scholar]
- 5.Rohan JM, Rausch JR, Pendley JS, Delamater AM, Dolan L, Reeves G, et al. Identification and prediction of group-based glycemic control trajectories during the transition to adolescence. Health Psychol. 2014;33(10):1143–52. [DOI] [PMC free article] [PubMed] [Google Scholar]
- 6.Marshall SL, Edidin DV, Arena VC, Becker DJ, Bunker CH, Gishoma C, et al. Glucose control in Rwandan youth with type 1 diabetes following establishment of systematic, HbA1c based, care and education. Diabetes Res Clin Pract. 2015;107(1):113–22. [DOI] [PMC free article] [PubMed] [Google Scholar]
- 7.Monaghan M, King MMC, Alvarez V, Cogen FR, Wang J. Changes in type 1 diabetes health indicators from high school to college. J Am Coll Heal. 2016. February 17;64(2):157–61. [DOI] [PMC free article] [PubMed] [Google Scholar]
- 8.Schwandt A, Hermann JM, Rosenbauer J, Boettcher C, Dunstheimer D, Grulich-Henn J, et al. Longitudinal trajectories of metaboliccontrol from childhood to young adulthood in type 1 diabetes from a large German/ austrian registry: A group-based modeling approach. Diabetes Care. 2017. March 1;40(3):309–16. [DOI] [PubMed] [Google Scholar]
- 9.Helgeson VS, Vaughn AK, Seltman H, Orchard T, Libman I, Becker D. Featured Article: Trajectories of Glycemic Control over Adolescence and Emerging Adulthood: An 11-Year Longitudinal Study of Youth with Type 1 Diabetes. J Pediatr Psychol. 2018;43(1):8–18. [DOI] [PMC free article] [PubMed] [Google Scholar]
- 10.Clements MA, Schwandt A, Donaghue KC, Miller K, Lück U, Couper JJ, et al. Five heterogeneous HbA1c trajectories from childhood to adulthood in youth with type 1 diabetes from three different continents: A group-based modeling approach. Pediatr Diabetes. 2019. November 1;20(7):920–31. [DOI] [PubMed] [Google Scholar]
- 11.Moore JM, Snell-Bergeon JK. Trajectories of hemoglobin A1c and body mass index z-score over four decades among 2 to 18 year olds with type 1 diabetes. Pediatr Diabetes. 2019. August 1;20(5):594–603. [DOI] [PMC free article] [PubMed] [Google Scholar]
- 12.Orchard TJ, Dorman JS, Maser RE, Becker DJ, Drash AL, Ellis D, et al. Prevalence of complications in IDDM by sex and duration. Pittsburgh Epidemiology of Diabetes Complications Study II. Diabetes. 1990. September;39(9):1116–24. [DOI] [PubMed] [Google Scholar]
- 13.Prince CT, Becker DJ, Costacou T, Miller RG, Orchard TJ. Changes in glycaemic control and risk of coronary artery disease in type 1 diabetes mellitus: findings from the Pittsburgh Epidemiology of Diabetes Complications Study (EDC). Diabetologia. 2007. November;50(11):2280–8. [DOI] [PubMed] [Google Scholar]
- 14.Miller RG, Costacou T, Orchard TJ. Risk Factor Modeling for Cardiovascular Disease in Type 1 Diabetes in the Pittsburgh Epidemiology of Diabetes Complications (EDC) Study: A Comparison With the Diabetes Control and Complications Trial/Epidemiology of Diabetes Interventions and Complication. Diabetes. 2019. February 1;68(2):409–19. [DOI] [PMC free article] [PubMed] [Google Scholar]
- 15.Levey AS, Stevens LA, Schmid CH, Zhang YL, Castro AF, Feldman HI, et al. A new equation to estimate glomerular filtration rate. Ann Intern Med. 2009;150(9):604–12. [DOI] [PMC free article] [PubMed] [Google Scholar]
- 16.Williams K V, Erbey JR, Becker D, Arslanian S, Orchard TJ. Can clinical factors estimate insulin resistance in type 1 diabetes? Diabetes. 2000. April;49(4):626–32. [DOI] [PubMed] [Google Scholar]
- 17.Secrest AM, Costacou T, Gutelius B, Miller RG, Songer TJ, Orchard TJ. Association of Socioeconomic Status with Mortality in Type 1 Diabetes: The Pittsburgh Epidemiology of Diabetes Complications Study. Ann Epidemiol. 2011;21(5). [DOI] [PMC free article] [PubMed] [Google Scholar]
- 18.Cirino P, Chin C, Sevcik R, Wolf M, Lovett M, Morris R. Measuring socioeconomic status: Reliability and preliminary validity for different approaches. Assessment. 2002;9(2):145–55. [DOI] [PubMed] [Google Scholar]
- 19.Soranzo N, Sanna S, Wheeler E, Gieger C, Radke D, Dupuis J, et al. Common variants at 10 genomic loci influence hemoglobin A1C levels via glycemic and nonglycemic pathways. Diabetes. 2010;59(12):3229–39. [DOI] [PMC free article] [PubMed] [Google Scholar]
- 20.Syreeni A, Sandholm N, Cao J, Toppila I, Maahs DM, Rewers MJ, et al. Genetic determinants of glycated hemoglobin in type 1 diabetes. Diabetes. 2019;68(4):858–67. [DOI] [PMC free article] [PubMed] [Google Scholar]
- 21.Miller RG, McGurnaghan SJ, Onengut-Gumuscu S, Chen W-M, Colhoun HM, Rich SS, et al. Insulin resistance-associated genetic variants in type 1 diabetes. J Diabetes Complications. 2021. January 9;107842. [DOI] [PMC free article] [PubMed] [Google Scholar]
- 22.Nagin DS. Group-Based Modeling of Development. Boston: Harvard University Press; 2005. [Google Scholar]
- 23.The effect of intensive treatment of diabetes on the development and progression of long-term complications in insulin-dependent diabetes mellitus. The Diabetes Control and Complications Trial Research Group. N Engl J Med. 1993. September 30;329(14):977–86. [DOI] [PubMed] [Google Scholar]
- 24.Keenan HA, Costacou T, Sun JK, Doria A, Cavellerano J, Coney J, et al. Clinical factors associated with resistance to microvascular complications in diabetic patients of extreme disease duration: The 50-year medalist study. Diabetes Care. 2007. August 1;30(8):1995–7. [DOI] [PubMed] [Google Scholar]
- 25.DCCT/EDIC Research Group. Coprogression of cardiovascular risk factors in type 1 diabetes during 30 years of follow-up in the DCCT/EDIC study. Diabetes Care. 2016;39:1621–30. [DOI] [PMC free article] [PubMed] [Google Scholar]
- 26.Skupien J, Warram JH, Smiles A, Galecki A, Stanton RC, Krolewski AS. Improved glycemic control and risk of ESRD in patients with type 1 diabetes and proteinuria. J Am Soc Nephrol. 2014;25(12):2916–25. [DOI] [PMC free article] [PubMed] [Google Scholar]
- 27.Moström P, Ahlén E, Imberg H, Hansson PO, Lind M. Adherence of self-monitoring of blood glucose in persons with type 1 diabetes in Sweden. BMJ Open Diabetes Res Care. 2017;5(1):342. [DOI] [PMC free article] [PubMed] [Google Scholar]
- 28.Carayol J, Hosking J, Pinkney J, Marquis J, Charpagne A, Metairon S, et al. Genetic susceptibility determines β-cell function and fasting glycemia trajectories throughout childhood: A 12-year cohort study (Earlybird 76). Diabetes Care. 2020;43(3):653–60. [DOI] [PubMed] [Google Scholar]
- 29.Miller RG, Secrest AM, Sharma RK, Songer TJ, Orchard TJ. Improvements in the life expectancy of type 1 diabetes: the Pittsburgh Epidemiology of Diabetes Complications study cohort. Diabetes. 2012. November;61(11):2987–92. [DOI] [PMC free article] [PubMed] [Google Scholar]
- 30.Foster NC, Beck RW, Miller KM, Clements MA, Rickels MR, Dimeglio LA, et al. State of Type 1 Diabetes Management and Outcomes from the T1D Exchange in 2016-2018. Diabetes Technol Ther. 2019. February 1;21(2):66–72. [DOI] [PMC free article] [PubMed] [Google Scholar]
Associated Data
This section collects any data citations, data availability statements, or supplementary materials included in this article.
Supplementary Materials
Data Availability Statement
Data may be made available from the corresponding author upon reasonable request.