

Abstract
Purpose:
To develop a novel resonator for high-quality fast scan EPR and EPR/NMR co-imaging of the head and brain of mice at 1.25 GHz.
Methods:
Resonator dimensions were scaled to fit the mouse head with maximum filling factor. A single loop 6-gap resonator of 20 mm diameter and 20 mm length was constructed. High resonator stability was achieved utilizing a fixed position double coupling loop. Symmetrical mutually inverted connections rendered it insensitive to field modulation and fast scan. Coupling adjustment was provided by a parallel-connected variable capacitor located at the feeding line at λ/4 distance. To minimize radiation loss, the shield around the resonator was supplemented with a planar conductive disc that focuses return magnetic flux.
Results:
Coupling of the resonator loaded with the mouse head was efficient and easy. This resonator enabled high-quality in vivo 3D EPR imaging of the mouse head, following intravenous infusion of nitroxide probes. With this resonator and rapid scan EPR system, 4 ms scans were acquired in forward and reverse directions, so that images with two-scan 3,136 projections were acquired in 25 s. Head images were achieved with resolutions of 0.4 mm enabling visualization of probe localization and uptake across the blood-brain barrier.
Conclusions:
This resonator design provides good sensitivity, high stability and B1 field homogeneity for in vivo fast scan EPR of the mouse head and brain, enabling faster measurements and higher resolution imaging of probe uptake, localization, and metabolism than previously possible.
Keywords: electron paramagnetic resonance imaging, brain imaging, free radicals, oxygen, redox metabolism, instrument development, microwave resonator
INTRODUCTION
Continuous wave (CW) EPR spectroscopy remains the most commonly used and versatile modality for biological EPR measurements, as it is capable of detecting a wide range of EPR probes, spin trap adducts and paramagnetic centers sampling critical properties of the in vivo biochemical microenvironment including redox status (1–3); glutathione levels (4); oxygen tension (5,6); and pH (7,8). Conventional CW‐EPR imaging uses typical commercial iron core electromagnets with Hall probe field controllers and is thus inherently “slow” typically requiring seconds for each image projection, and minutes to even hours for high‐resolution spatial and spectral-spatial imaging (9–11). However, many of the processes that EPR measures including tissue redox state, oxygenation, and pH are dynamic with changes in minutes or even less, highlighting a need for accelerated image‐acquisition speed for biomedical applications. This has led to the development of fast scan EPR imaging systems capable of image projection acquisitions in milliseconds (12–15).
Fast scan CW EPR imaging requires the use of resonator designs that impart high sensitivity for signal detection over short times and high stability in the presence of both the strong rapidly varying magnetic field sweep and the modulation field caused by eddy currents produced in metal parts (12). The resonator must be robust with stable coupling and tuning. In fast scan image acquisition, the resonator must provide stable performance, as once the collection of thousands of millisecond scans commences, there is no time to retune or recouple the resonator, as is typically possible with slow scan acquisitions. With fast scan acquisition, resonator instability leads to major corruption and loss of the entire 3D image or series of images. Thus, fast scan EPR imaging places stringent requirements for optimizing resonator sensitivity and stability.
Hypothetically, mouse head EPR imaging could be performed using a whole-body resonator that provides sufficient space for the whole body; however, the reduction in filling factor would lead to substantial loss of signal from the volume of interest. Therefore, tailoring of the resonator geometry to that of the particular animal region and volume of interest is highly desirable. Indeed this is the norm for clinical or preclinical proton MRI, but frequencies are much lower in the RF range, and in contrast to CW EPR there is no need to maximize resonator Q.
We developed a single loop multi-gap (SLMG) resonator design for EPR or EPR/NMR co-imaging applications for head and brain imaging of mice. These efforts focused on maximization of filling factor, B1 field homogeneity, and Q-factor with minimization of E field over the sample volume. There was a special effort to maximize the mechanical stability of the resonator and achieve high coupling efficiency to facilitate in vivo application. These goals were achieved with a segmented 6-gap loop gap structure with a design that eliminated moving parts in the coupling circuit. The design is open from both ends of the resonator allowing good sample access with ease of applying anesthetic gas, and physiological monitoring. In initial applications, this design exhibited good stability and performance for in vivo fast-scan EPR spectroscopy and imaging of the mouse head at 1.25 GHz enabling faster measurements with higher resolution imaging than previously possible.
METHODS
Construction of the resonator
Diameter (D) limitation for conventional loop-gap resonators, including the multigap versions, is determined by the length of the individual segment of the loop calculated as π×D/N, where N is a number of capacitive gaps. The diameter should be less than one-quarter wavelength (λ/4) (16,17). The resonance frequency can be increased by the √N for a given diameter by introducing a number of capacitive gaps (18).
The dimensions of the resonator were chosen to obtain EPR images of the head of a living mouse, which requires at least ~20 mm diameter. Previously, we developed a 16 gap loop-gap resonator for whole-body animal experiments. The diameter of this resonator was ~40 mm (19) sufficient to enable sliding over a given sample to enable EPR/NMR co-imaging in the same magnet system. With this increase of the inner diameter of the resonator the filling factor was decreased limiting sensitivity (20,21). However, this also provided some advantages when the resonator was loaded with lossy samples including improved coupling; increased B1 homogeneity over the sample; and attenuation of motion-induced noise. In contrast to the considerable whole-body animal motion secondary to respiratory and cardiac cycles, the mouse head is a much more stable “resonator load”. Therefore, for the current mouse head resonator design, we opted to maximize the filling factor tailored to its geometry and size. For a frequency of ~1.25 GHz with a diameter of 20 mm and a length of 20 mm, 4 or more capacitive gaps are necessary. A 6 gap loop-gap resonator design was selected since the additional capacitive gaps should contribute to increase the RF field homogeneity (22). Further increase of the number of gaps for this small loop diameter complicates the manufacturing, and may cause deterioration of the quality factor of the resonator (23).
Motion-induced noise is caused by alterations in resonator load and is increased with high filling factor. Since the electric field is mainly responsible for loss within animal tissue, it should be minimized within the sample area. Therefore, we utilized the approach of gaps oriented radially from the center as shown in Figure 1. This design has been shown to provide good spatial separation of E and B1 fields (19,24), with the B1 field concentrated at the center of the resonator, and the E field concentrated away from the sample in the gaps (22). Larger volume resonators for 1.25 GHz achieved by increasing the number of gaps and compared to prior resonator designs, higher loading with higher loaded Q can be achieved (16,17).
Figure 1.
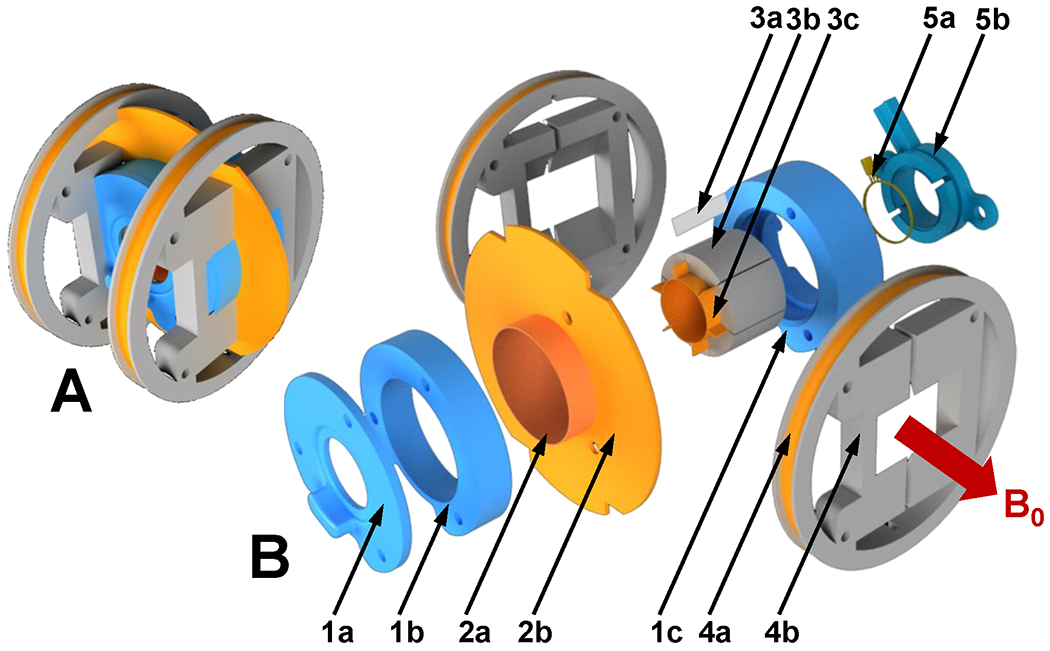
Mechanical layout of the resonator. A. Assembled resonator. B. Expanded view. 1a. Front lid; 1b. Housing; 1c. Rear lid; 2a. Cylindrical shield (plastic reinforcing shell is not shown); 2b. Ring shield (reinforcing plastic support is not shown) 3a. Gap filling separator (one out of six pulled out shown); 3b. Resonator segment; 3c. Conductive loop segment; 4a. Modulation coil; 4b. Modulation coil frame; 5a. Double coupling loop (shown with part of the coaxial RF cable) 5b. Coupling loop housing.
Initial estimation of the resonator resonant frequency for the desired dimensions was performed as previously reported (19) using the lumped circuit approximation (25). Final frequency adjustment was performed on constructed prototypes. Prototypes allowed consideration of factors omitted in the equations including the effect of shielding, inconsistencies in gap dimensions, and variations in dielectric material characteristics. Frequency adjustments were performed by careful trimming of the conductive surfaces of the gaps. Emphasis was placed on optimizing the filling factor for the mouse head while maintaining B1 homogeneity, mechanical stability to suppress microphonic noise, and efficient adjustable coupling to enable loading with lossy in vivo biomedical samples.
Mechanical design
Mechanical stability of the resonator loaded with a live animal has a significant impact on achievable signal-to-noise ratio. Avoidance of moving parts in the design, such as components for mechanically adjustable coupling (26), can significantly improve stability and additionally can simplify construction and fabrication. In addition to animal-induced noise, with scanning frequencies approaching kilohertz values, there are challenges in overcoming noise from vibrations as previously described for the development of rapid scan EPR (12). These vibrations are due to eddy currents produced in metal parts positioned in the rapidly varying magnetic field and due to potential interference of the field with the coupling loop. We avoided these effects by limiting the use of metal parts in general and by limiting the thickness of necessary metal parts.
As seen in Figure 1, the resonator body is constructed from 6 segments (3b) assembled in a cylindrical structure with a 20 mm i.d., 28 mm o.d., and 20 mm long. Segments are 3D printed with a 20% infill from acrylonitrile butadiene styrene (ABS) plastic filament. To form conductive surfaces of the resonator, pieces of copper foil of 75 µm thickness (3c) were cemented on the concave inner faces and ~ 3 mm portion of the sides of each segment. A solution of polystyrene in organic solvent was used as glue. During assembly, six gaps are formed by insertion of 125 µm thick polytetrafluoroethylene (PTFE) film (3a) between segments. Components were fixed by winding one layer of nylon thread around the assembled segments and impregnating it with polystyrene solution that resulted in a single structurally solid unit. This nylon thread reinforcement layer is visible in Figure 2, 1. The cylindrical part of the shield (Figure 1, 2a) is made from copper foil and formed around the outer surface of the 0.5 mm wall hollow cylinder, and placed on the outer surface of the resonator. The cylinder is not shown in Figure 1, but it is visible in Figure 2, 2. The planar part of the shield (Figure 1, 2b) is made of copper foil adhered to a 1 mm thick plastic disc. The disk has four notches for positioning of the field modulation coils (4b) around the resonator. Cylindrical and planar pieces of shield were soldered together with a continuous seam. The shielded resonator was positioned inside the three-piece resonator housing (1a, 1b, 1c) and secured with plastic threaded rods (not shown in Figure 1) forming a solid structure. The resonator is magnetically coupled. To increase rigidity, a double coupling loop (5a) similar to that described in (19) was positioned and fixed inside a plastic housing (5b), which simultaneously served as a spacer between the loop and resonator. The coupling capacitor is soldered to the RF cable 90o elbow and placed between the loop and the feeding cable (not shown in Figure 1). A plastic rod is attached to the capacitor to extend access to the capacitor, allowing resonator coupling adjustment from outside the solenoidal EPR imaging magnet when it is positioned in the gradient isocenter of the magnetic system (Figure 3, 5) (13). Helmholtz modulation coils (Figure 1, 4a) were made of two layers of seven turns of 0.8 mm magnet wire wound around a 69 mm diameter plastic form (4b). Windings were reinforced with polystyrene solution. Modulation coils were positioned around the resonator and secured with a set of four threaded rods (not shown in Figure 1).
Figure 2.
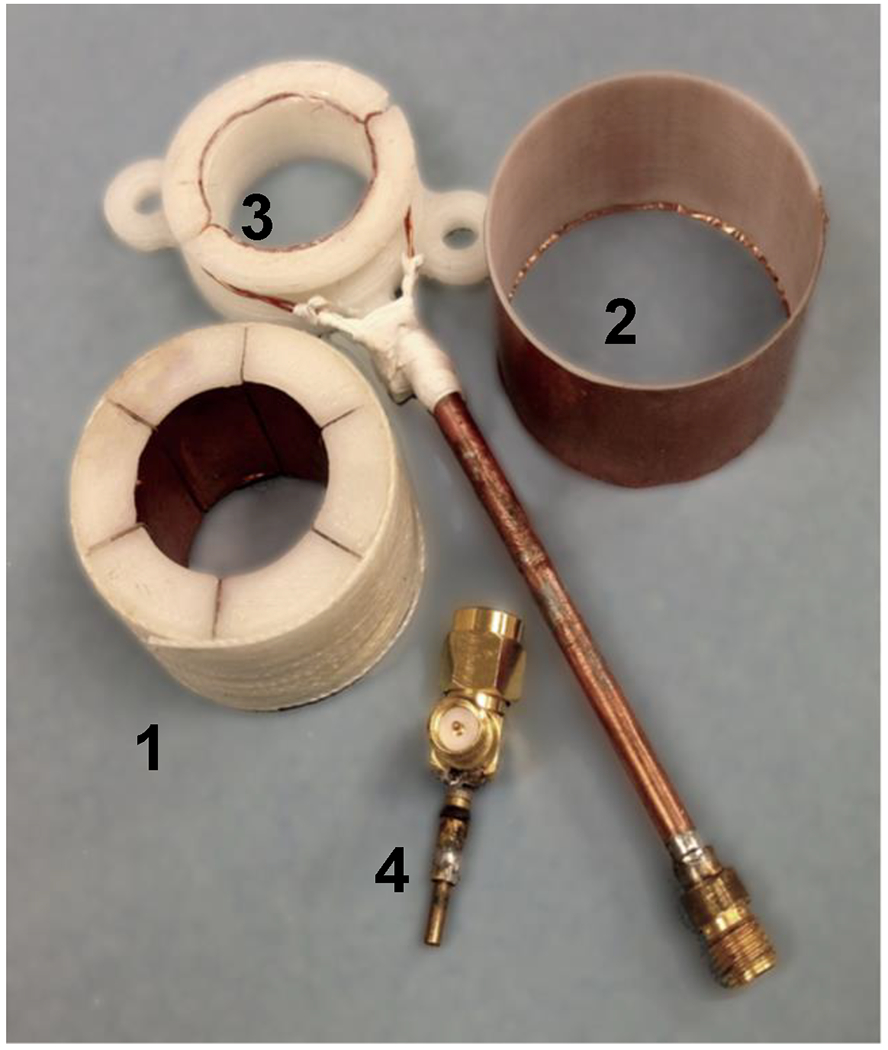
Photo of the 1.25 GHz 6-gap single loop resonator before assembly. 1. Resonator; 2. Cylindrical shield; 3. Coupling loop with housing and coaxial cable; 4. Coupling capacitor soldered to RF coaxial elbow.
Figure 3.

A. Photo of the 1.25 GHz 6-gap single loop resonator assembly positioned in the holder for solenoid magnet. B. Opposite view. 1. Resonator; 2. Holder; 3. Coupling capacitor. 4. Coaxial RF cable; 5. Coupling rod; 6. Animal holder support. C. Resonator loaded with the mouse before positioning in the solenoid magnet. Mouse is substituted by stuffed animal.
Figure 5.

EPR imaging of the mouse head phantom. Slices are shown from 3D EPR image (cropped from FOV 35 x 35 x 35 mm) of plastic 5 cc conical tube filled with 1 mM TEMPONE in 0.9 % saline. Top - coronal, middle – sagittal, bottom - axial slices from the 3D data set. EPR images are reconstructed from 16,384 projections with 10 x 3.8 msec scans per projection. The parameters used for the EPRI acquisition were as follows: frequency 1.25 GHz, microwave power ~200 mW, modulation amplitude 0.1 mT, field gradient 60 mT/m, field sweep 2.4 mT.
Figure 4.

Lumped element presentation of the schematic diagram of the resonator. C -capacitance of the individual gap. L - inductance of the individual loop. LCL - inductance of the coupling loop. CC -- adjustable coupling capacitor. Arrows indicate the direction of the current in the coupling loop. Dash lines represent magnetic flux.
3D Printing of Structural Parts
In order to reduce electromagnetic loss in nonconductive parts of the resonator, typically a low microwave loss Rexolite plastic, with a loss tangent at 3 GHz of 0.00048, is used (27). However, subtractive manufacturing requires expensive equipment, skilled personnel and is time-consuming, which limits rapid construction of multiple prototypes. While, additive manufacturing does not have these disadvantages, the choice of materials is more limited and information about their microwave properties at the frequency of interest is scarce. Preliminary tests with ABS, PLA, and HIPS (High Impact Resistant Polystyrene) filaments were performed to determine the optimal material for resonator body parts in the vicinity of the generated RF field. For this, eight-millimeter diameter cylinders were manufactured from these plastics with 10% infill. Cylinders were placed in a commercial L-band surface loop resonator Magnettech GmbH (Berlin, Germany), and their effect on resonator Q-factor was compared to that of a cylinder manufactured from solid Rexolite. All 3D-printed cylinders had a smaller effect on the resonator Q-factor than the cylinder made from Rexolite. Of note, 3D printing allows manufacturing parts with different infill, which are hollow shells with inner reinforcement that can have user-defined density. We used a low 10% infill sufficient to obtain structurally solid parts. This reduction of the amount of material decreased microwave loss in 3D-printed parts compared to parts manufactured from solid plastic.
Resonator prototypes were manufactured from each of these plastics. Shielded resonator Q-factor was measured with a network analyzer when coupled with a simple one-turn loop. Resonators manufactured from filled ABS, translucent ABS, and HIPS showed similar unloaded Q-factors: 1230, 1198, and 1227, respectively. Resonator manufactured from PLA exhibited lower Q-factor of 800. Paradoxically, PLA has several times smaller loss tangent values (0.002 with 18% infill) among chosen materials (28) and ABS has the maximum (0.003–0.004) (29), but the PLA resonator Q-factor was the lowest. This can be explained by several factors including: the geometry of the resonator is not very sensitive to the material loss in the resonator body due to concentration of the electrical field in the capacitive gaps with small dissipation of the fringe field in surrounding plastic; 3D printing with low infill attenuates the loss in plastic; thus, factors such as dimensional inaccuracies, printing defects, potential moisture absorption (30) affected the Q of the resonator more than the value of the loss tangent of the resonator material. Therefore, we chose ABS polymer for final production of the resonator segments, as it enabled better dimensional accuracy and reproducibility. Other parts were manufactured from PLA plastic, as it allowed faster manufacturing.
Electrical design of the resonator and coupling
Mechanically adjustable inductive coupling has been used in loop-gap resonators since it provides coupling for variable loads and provides uniform “feeding” to all loop segments of the resonator. With this configuration, the coupling loop is positioned adjacent to the resonator opening at a controlled distance from the resonator loop. The inherent weakness of this approach is that any change in the relative position of these elements causes alterations in the resonator frequency and coupling to the feeding cable, triggering motion-induced noise. However, implementing variable electrical capacitive coupling, while free from the above drawback, is difficult since parallel individual feeding of all gaps is limited by space constraints. Therefore, a double coupling loop was implemented for this resonator design similar to that previously described (19). The parallel orientation of the feeding cable towards the loop plane was chosen to accommodate orthogonal orientation of the resonator in the solenoidal magnet (Figure 3).
To attenuate mechanically-induced noise, the copper wire double coupling loop was embedded into a plastic housing and firmly attached to the resonator body with plastic screws. Coupling was initially adjusted by varying the distance between the resonator and loop, and additional coupling adjustment was provided by a parallel-connected capacitor placed in the feeding line at a quarter wavelength distance. The circumference of the coupling loop was kept less than λ/4. To provide efficient homogeneous coupling for L-band frequencies, it should be no longer than ~ 60 mm (or 19 mm in diameter). To overcome these limitations, a parallel double-loop design was implemented with symmetrical mutually inverted connections to the feeding cable (19). This made it insensitive to offsets induced by modulation and fast scan fields. To provide access to the resonator from both sides, the loop, together with λ/4 long feeding lines, was transformed into a planar symmetrical structure. The coupling capacitor was connected in parallel to the RF cable and mounted on the microwave elbow connector allowing parallel orientation of the tuning rod with respect to the bore of the solenoidal magnet. An additional benefit of this design is easy access to the variable capacitor pre-mounted to the connector.
Equivalent schematics of the resonator illustrate that the coupling loops are coupled with the entire magnetic flux of the resonator (Figure 4). The resonator loop sections are serially connected through the gaps (presented as capacitors). The parallel coupling loops are phased such that each half circle-loop adds magnetic flux and forms a closed loop, while in the feeding lines, currents are compensated. With regard to the magnetic flux, the resonator segments are connected in parallel and are coupled with the coupling loop halves and partially with each other.
Four feeding lines of equal length were connected to the feeding cable and routed around the opening of the resonator (Figure 1, 5a). This results in an open geometry, with no restricted access to the resonator opening from the coupling loop, allowing access for gas anesthetic supply and exhaust tubes.
To ensure that the resonator does not have significant radiation loss, the cylindrical shield placed around the resonator assembly (Figure 1, 2a) was supplemented with a planar conductive disc that focuses the return magnetic flux (Figure 1, 2b).
In vivo EPRI experiments
Male C57/BL6 mice of ~30 grams body weight were studied. For in vivo probe distribution mapping of the mouse head, the BBB (Brain Blood Barrier) permeable nitroxide probe MCP (final concentration of 150 mM) was dissolved in 20% propylene glycol, 10% volume phosphate buffered saline (PBS), 70% volume deionized water, while the BBB impermeable probe 3CP 3- carbamoyl-PROXYL (150 mM) was dissolved in deionized water. In all cases, the solution pH was adjusted to 7.4 by the addition of NaOH. Mice were anesthetized by inhalation of 1.5 – 2.0% isoflurane and the tail vein was cannulated for the probe infusion. A plastic holder connected to the isoflurane unit was placed over the head of the mouse and the animal placed into the resonator. During the EPR measurements, isoflurane anesthesia was maintained at 1.0 – 1.5%. The nitroxide probe (~ 1 mmol/kg body weight) was intravenously injected as a bolus of 180 µl over 30 s through a tail vein catheter. This volume and concentration of probe are commonly used and well tolerated for this type of experiment (31) and we did not observe any adverse effect on mouse survival and post-recovery behavior. The use of animals and the animal protocol were approved by The Institutional Animal Care and Use Committee at The Ohio State University.
EPR acquisition was started two minutes after the injection. The parameters used for the EPRI acquisition were: frequency 1.26 GHz, modulation amplitude 0.08 mT, field gradient 66 mT/m, field sweep 2 mT. A total of 3,136 projections with two 3.8 ms long scans per projection, 24 s total acquisition time. Microwave power used was ~200 mW (0 dB attenuation). Preliminary experiments with the phantom with this high resonator filling factor (and thus lowered Q-factor) demonstrated that at ~200 mW full power of the bridge maximum signal amplitude was seen with no observed broadening (assessed as change in derivative spectra vs power). Maximizing the power allowed us to work at better S/N.
For proton MRI co-imaging acquisitions mice were positioned on a warm water circulated bed with an external nose-cone for anesthesia. A Bruker 94/30 9.4 Tesla MRI system operated at 400 MHz was used to acquire coronal slices of the mouse head using mouse brain coil. T2-weighted images using Rapid Acquisition with Relaxation Enhancement (RARE) pulse sequence with 8 echo train length was performed. Scout images were acquired before collecting a total of 40 images. Parameters used: Flip angle 180 deg, matrix size 256x256, resolution 8.5333 pixels/mm, echo time (TE) = 46.924 ms, repetition time (TR) = 4048 ms, slice thickness = 0.8 mm, acquisition time 4 min 48 sec.
EPR Images and MRIs were superimposed in 3D mode using open source “MRIcro” software version 1.40.
RESULTS
Coupling of the resonator loaded with phantoms and the heads of mice with body weights varying from 18 to 42 g was efficient and easy, permitting critical coupling at maximum power, and coupling adjustment was performed with only small resonator frequency variation. For the full range of coupling adjustment to different loads, resonant frequency shifts were < 8 MHz within the AFC tuning range of the microwave bridge. After the initial resonator coupling adjustment, little further adjustment was needed during live animal experiments for over 60 minutes with the EPR resonant frequency remaining within the AFC range of the bridge.
Sensitivity of the developed resonator was assessed by measurement of the signal to noise ratio of the signal from 1.3 ml sample of 1.0 mM TEMPONE in 0.09% saline solution. Signal was obtained from a single 4 ms scan. Signal was compared to the signal obtained with a reentrant resonator similar to that described in (32). The signal-to-noise ratio measured was similar in both resonators with values of 28 and 23, respectfully.
For the empty critically coupled resonator, the loaded Q, as measured using an Agilent N5241 A vector network analyzer, was 340, and with maximum loading, the Q dropped to ~50. With a load simulating the mouse head, the Q was 162.
Measured at 1 mW, the absolute intensity of the B1 field of the empty critically coupled resonator was 2.78×10⁻⁶ T, which corresponds to 8.8×10⁻⁵ T/W1/2. For measurements, we utilized a 3.96 mm diameter brass sphere attached to the quartz capillary tube using the perturbing spheres method (33).
The empty resonator demonstrated very good homogeneity, as was assessed by moving a conductive sphere in the resonator and registering the frequency shift through the volume. The frequency shift was 2.17 MHz in the geometrical center; at the openings 2.26 MHz, and 2.61 MHz in the center plane at 1 mm from the side (close to the perimeter). Frequency shift measurements performed with the resonator loaded with an 18 mm id tube filled with 5 ml 0.09 % saline showed somewhat different shifts in frequencies (~2.3 MHz shift in the center and ~1.1 MHz at the perimeter) due to sample-induced “focusing” of the magnetic component of the microwave field toward the center of the resonator. The image intensity profile of the homogeneous volume depends on the distribution of the B1 (34). B1 homogeneity expected for the mouse head was assessed from the EPR image profile of the uniform phantom with a shape resembling a mouse head. It was constructed using a conical 5 ml plastic tube packed with open-pore polyurethane foam and filled with a solution of 1 mM TEMPONE in 0.09% saline solution. The Intensity dropped about 50 % from the maximum in the center to the edges of the mouse head phantom (Figure 5), consistent with the previously reported eddy current induced lens effect (35,36).
Utilizing a field gradient of 66 mT/m with a total of 3,136 projections each consisting of two 3.8 ms field scans, high quality in vivo 3D head EPR images were obtained in 24 seconds (Figure 6). To anatomically register free radical image distribution in the head, images were superimposed with head 3D MRIs obtained as set of 19 axial 0.8-mm-thick 2D 256x256 images acquired with a 9.4 T Bruker 400 MHz horizontal bore small animal MRI system (Figure 7). The results obtained demonstrate the probe distribution in the head of the mouse. While 3CP, that does not cross the BBB, was clearly excluded from the brain (Figure 7A), MCP, which is known to cross the BBB, distributed throughout the volume of the head including the brain (Figure 7B). Thus, the current resonator provided sufficient sensitivity and stability to enable rapid high quality 3D mapping of the distribution of the radical probe in the head along with brain uptake.
Figure 6.
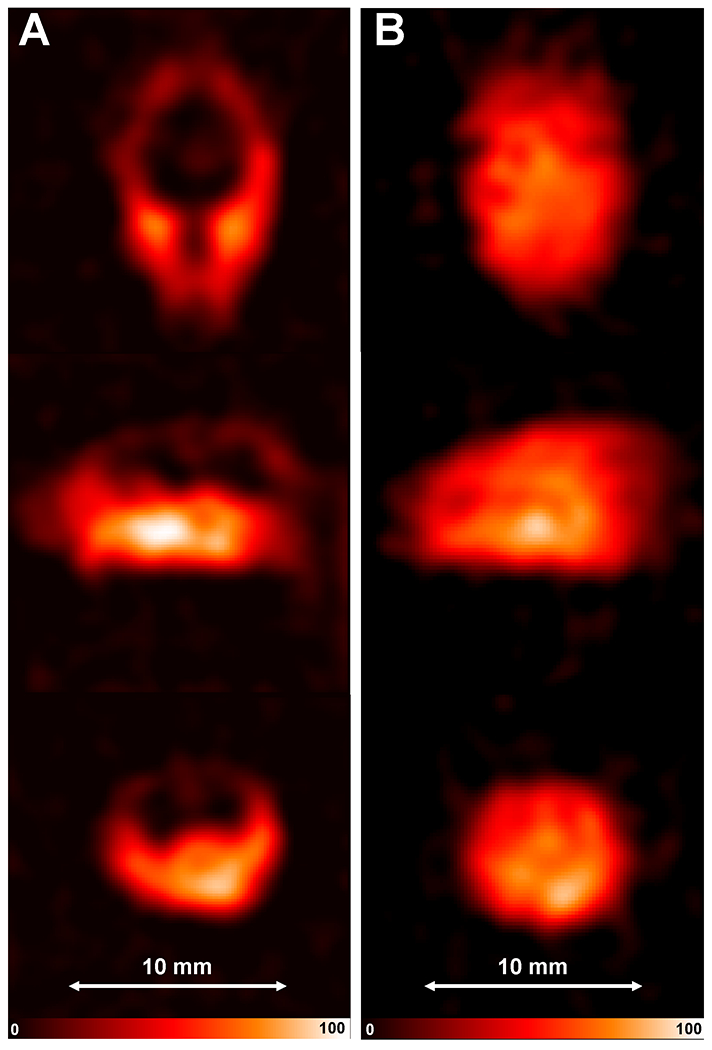
In vivo EPR imaging of the mouse head. Slices from the 3D EPR image (cropped from FOV 30 x 30 x 30 mm) of mouse head after IV infusion of nitroxide (A) 3CP or (B) MCP: Top - coronal, middle – sagittal, bottom - axial slices from the 3D data set. EPR images are reconstructed from 3,136 projections with 2 x 3.8 msec scans per projection. The parameters used for the EPRI acquisition were as follows: frequency 1.26 GHz, microwave power ~200 mW, modulation amplitude 0.1 mT, field gradient 66 mT/m, field sweep 2 mT.
Figure 7.
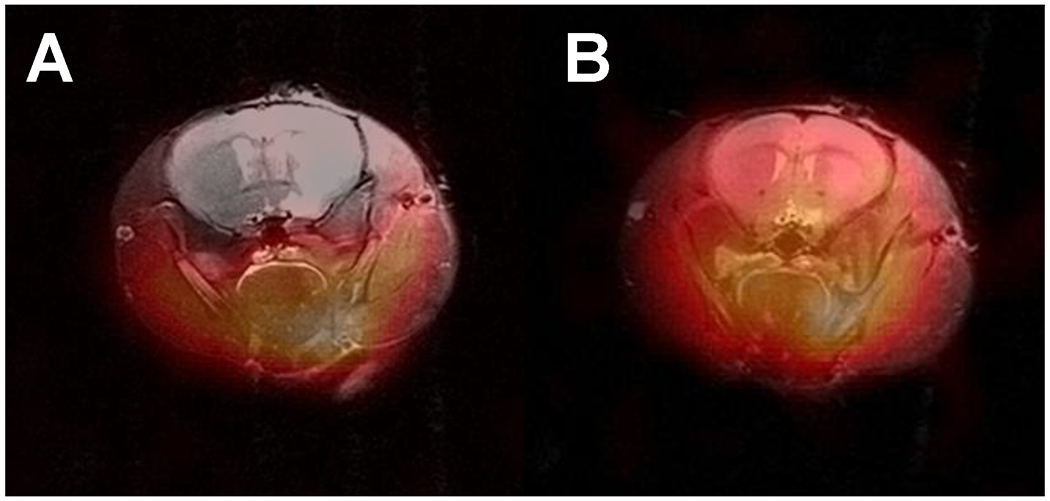
In vivo EPR imaging of the mouse head with proton MRI coimaging. Axial slices from Figure 5 (bottom) enlarged and superimposed with the corresponding proton MRI slices acquired at 9.4 T.
DISCUSSION
Systems have been developed to enable EPR imaging in living animals and combination with MRI can provide anatomical registration of free radical distribution (35,37); mapping functional parameters such as redox status (1), oxygen tension (38–40), pH (41–43), distribution of glutathione (4), and oxidative stress (3). For these applications, it is essential to maximize both system sensitivity and stability.
For in vivo EPR imaging in small animal models, typically RF frequencies of 250 or 300 MHz have been used, and this in turn limits sensitivity (44–48). With increasing frequency, microwave power absorption increases, and microwave tissue penetration depth falls, but at L-band frequencies of 1 to 2 GHz penetration depth falls from 33 to 11 mm with about 24 mm at 1.2 GHz (49), which is sufficient for whole body imaging of living mice, as we have demonstrated (19). However, frequency increase limits on the size of the resonator. Simple scaling up of resonators lowers their resonant frequency and in turn decreases their EPR sensitivity (47,48,50,51). Therefore, in vivo whole body EPR spectroscopy and imaging in small animals such as rats have typically been performed at ~250 MHz and mice at 750 MHz or less (52–57). For EPR imaging of the mouse head, prior studies have been performed at a maximum frequency of 750 MHz (1,3,4,58). L-band frequencies (~ 1.2 GHz) have been used for localized in vivo EPR spectroscopy and imaging (59,60). The design of a 1.2 GHz resonator to accommodate these larger biological samples is challenging in view of the lowered resonator Q-factor due to loading by these very lossy samples and the RF field magnitude and its homogeneity.
Air core solenoidal magnet systems have major advantages for fast scan EPR acquisition over iron core magnets since hysteresis with field distortion is minimized. However, for in vivo EPR in a 140 mm diameter air core solenoidal magnet, the required orthogonal orientation of the resonator imposes additional spatial constraints. These necessitate the special geometry of the resonator and its coupling mechanism to allow high performance when loaded with the animal (19,61–63). In the current work, these requirements were met by introducing a planar coupling loop. Since the sensitivity for CW EPR is proportional to the product of filling factor and Q, our efforts also focused on tailoring the resonator geometry to match that of the animal region and volume of interest to be studied.
A key advantage in limiting the size and geometry of the resonator to match that of the sample is the resultant increase of the conversion factor. The conversion factor for prior designs including the dual-frequency EPR/MRI co-imaging resonator in EPR mode was 0.011 mT/ W1/2 (64), for a ceramic reentrant resonator - 0.014 mT/W1/2 (32). For S-Band, a surface bridged loop–gap resonator used for topical in vivo applications had a conversion factor of 0.062 mT/W1/2 (65) and a 22 mm diameter 670 MHz multi-coil parallel-gap resonator used for mouse head imaging had a conversion factor of 0.012 mT/ W1/2 (35). The conversion factor of the current mouse head resonator was 0.088 mT/W1/2 which was higher than that of these previously developed resonators for in vivo applications. The higher value is likely due to a combination of the smaller size, good separation of electrical field from the sample, and efficient shielding which focuses the RF field inside the resonator and attenuates radiation loss.
For lossy samples single loop – multigap resonator designs provide frequency-dependent sensitivity increase for a given resonator size along with proportional gain in signal intensity and B1 homogeneity as a function of the number of gaps (22). We compared sensitivity of the developed resonator with a reentrant resonator similar to that described in (32). Signal-to-noise ratio measured with resonators loaded with the same sample was 28 and 23, respectfully. We attribute enhanced sensitivity of the developed resonator to better filling factor and reduced electrical loss in the sample due to better separation of electrical field from the sample. Also, metal parts in the reentrant resonator design could contribute to additional noise in the presence of strong fast changing magnetic fields since the noise level was approximately 10% higher with the reentrant resonator.
Sample (tissue) dielectric loss is a main contributor to the total RF loss and leads to significant signal attenuation in in vivo EPR. If sample loss is dominant, then the contribution of the losses in the resonator and coupling to the Q-factor of the sample loaded resonator has a limited impact (66). Therefore, reduction of the loss in the resonator itself has a limited impact on the improvement of the Q-factor of the sample loaded resonator.
In addition to conversion factor measurements in the center of the empty resonator, we estimated the deviation of the B1 intensity from the geometrical center towards the edges and openings. The empty resonator demonstrated very good homogeneity towards the openings (less than 8% deviation) and 20% increase towards the perimeter. However, B1 distribution was affected by loading with continuous large volumes as expected due to eddy currents induced in the sample. Inside the 5 ml cylindrical sample tested, magnetic field was ~50% lower at the edges than the center. As B1 homogeneity inside the sample-loaded resonator is driven by sample itself, B1 distribution inside mouse head was assessed from the EPR image profile of the mouse head-shape simulated conical phantom. The image intensity profile of the uniform volume depends on the distribution of the B1 (34). A lens effect was observed in the phantom due to the concentration of the B1 field. Intensity decreased about 50 % from the maximum in the center towards the edges of the phantom.
Nitroxides are powerful probes for visualizing the redox status of biological tissues, including the head and brain (67). Redox status measurements are based on the ability of nitroxide probes to be reduced by the biological environment. Measurements of fast rates of these reactions and rapid probe partitioning in the body require fast imaging techniques. Previously, fast images of comparable quality were acquired on a CW 750 MHz EPR system by averaging 20 ten-second 3D image acquisitions. Total acquisition time was 200 s (8). Rapid images of a mouse head, which allowed visualization of the distribution of the BBB permeable HMP (3‐hydroxymethyl‐2,2,5,5‐tetramethylpyrrolidine‐1‐oxyl) probe, were reconstructed from 81, 500 ms projections and permitted mapping of redox status in the mouse brain with ~ 40 s time resolution (67). Our presented images were reconstructed from a set of 3136, 4 ms projections, acquired in 24 sec using the BBB impermeable 3CP probe and this allows faster imaging of kinetics at higher resolution.
CONCLUSIONS
An L-band resonator of single loop, 6-gap design and inner diameter of 20 mm was developed for in vivo EPR imaging of the mouse head. This resonator has good mechanical stability and high coupling efficiency. Good B1 homogeneity of the resonator along all axes was achieved and confirmed by 3D spatial EPR imaging. This resonator was shown to be well suited for fast scan high resolution in vivo EPR imaging of the mouse head and brain, providing images with submillimeter resolution in under 30 seconds. The higher sensitivity and fast scan stability of this resonator enables faster imaging than previously possible with higher numbers of projections in a given time as needed to image the kinetics of radical metabolism in the head of living mice and alterations that may be associated with disease. The EPR image quality and fidelity were sufficient to enable use with high field MRI to map the localization of paramagnetic redox probes in the head of mice.
Acknowledgment
This work was supported by NIH Research Grants R01HL131941 and R01HL135648.
References
- 1.Fujii HG, Emoto MC, Sato-Akaba H. Brain Redox Imaging Using In Vivo Electron Paramagnetic Resonance Imaging and Nitroxide Imaging Probes. Magnetochemistry 2019;5(11). [Google Scholar]
- 2.Matsumoto KI, Mitchell JB, Krishna MC. Comparative studies with EPR and MRI on the in vivo tissue redox status estimation using redox-sensitive nitroxyl probes: influence of the choice of the region of interest. Free Radic Res 2018;52(2):248–255. [DOI] [PMC free article] [PubMed] [Google Scholar]
- 3.Matsumura A, Emoto MC, Suzuki S, Iwahara N, Hisahara S, Kawamata J, Suzuki H, Yamauchi A, Sato-Akaba H, Fujii HG, Shimohama S. Evaluation of oxidative stress in the brain of a transgenic mouse model of Alzheimer disease by in vivo electron paramagnetic resonance imaging. Free Radical Biology & Medicine 2015;85:165–173. [DOI] [PubMed] [Google Scholar]
- 4.Emoto MC, Sato-Akaba H, Matsuoka Y, Yamada KI, Fujii HG. Non-invasive mapping of glutathione levels in mouse brains by in vivo electron paramagnetic resonance (EPR) imaging: Applied to a kindling mouse model. Neuroscience Letters 2019;690:6–10. [DOI] [PubMed] [Google Scholar]
- 5.Hou H, Khan N, Gohain S, Eskey CJ, Moodie KL, Maurer KJ, Swartz HM, Kuppusamy P. Dynamic EPR Oximetry of Changes in Intracerebral Oxygen Tension During Induced Thromboembolism. Cell Biochem Biophys 2017;75(3–4):285–294. [DOI] [PMC free article] [PubMed] [Google Scholar]
- 6.Zweier JL, Chzhan M, Ewert U, Schneider G, Kuppusamy P. Development of a highly sensitive probe for measuring oxygen in biological tissues. J Magn Reson Series B 1994;105(1):52–57. [DOI] [PubMed] [Google Scholar]
- 7.Dhimitruka I, Bobko AA, Eubank TD, Komarov DA, Khramtsov VV. Phosphonated trityl probes for concurrent in vivo tissue oxygen and pH monitoring using electron paramagnetic resonance-based techniques. J Am Chem Soc 2013;135(15):5904–5910. [DOI] [PMC free article] [PubMed] [Google Scholar]
- 8.Gorodetsky AA, Kirilyuk IA, Khramtsov VV, Komarov DA. Functional electron paramagnetic resonance imaging of ischemic rat heart: Monitoring of tissue oxygenation and pH. Magn Reson Med 2016;76(1):350–358. [DOI] [PMC free article] [PubMed] [Google Scholar]
- 9.Kuppusamy P, Chzhan M, Zweier JL. Development and optimization of three-dimensional spatial EPR imaging for biological organs and tissues. J Magn Reson B 1995;106(2):122–130. [DOI] [PubMed] [Google Scholar]
- 10.Kuppusamy P, Wang P, Zweier JL. Three-Dimensional Spatial EPR Imaging of the Rat Heart. Magn Reson Med 1995;34:99–105. [DOI] [PubMed] [Google Scholar]
- 11.Kuppusamy P, Chzhan M, Samouilov A, Wang P, Zweier JL. Mapping the spin-density and lineshape distribution of free radicals using 4D spectral-spatial EPR imaging. J Magn Reson Series B 1995;107(2):116–125. [DOI] [PubMed] [Google Scholar]
- 12.Eaton SS, Shi Y, Woodcock L, Buchanan LA, McPeak J, Quine RW, Rinard GA, Epel B, Halpern HJ, Eaton GR. Rapid-scan EPR imaging. J Magn Reson 2017;280:140–148. [DOI] [PMC free article] [PubMed] [Google Scholar]
- 13.Samouilov A, Ahmad R, Boslett J, Liu X, Petryakov S, Zweier JL. Development of a fast-scan EPR imaging system for highly accelerated free radical imaging. Magn Reson Med 2019;82(2):842–853. [DOI] [PMC free article] [PubMed] [Google Scholar]
- 14.Sato-Akaba H, Emoto MC, Hirata H, Fujii HG. Design and testing of a 750MHz CW-EPR digital console for small animal imaging. J Magn Reson 2017;284:48–58. [DOI] [PubMed] [Google Scholar]
- 15.Tseytlin O, Guggilapu P, Bobko AA, AlAhmad H, Xu X, Epel B, O’Connell R, Hoblitzell EH, Eubank TD, Khramtsov VV, Driesschaert B, Kazkaz E, Tseytlin M. Modular imaging system: Rapid scan EPR at 800 MHz. J Magn Reson 2019;305:94–103. [DOI] [PMC free article] [PubMed] [Google Scholar]
- 16.Hyde JS, Froncisz W. Loop-Gap Resonators. In: Symons MCR, editor. Electron Spin Resonance. Volume 10, Specialist Periodical Reports, The Royal Society of Chemistry. London; 1986. p 175–184. [Google Scholar]
- 17.Hyde JS, Froncisz W. Loop gap resonators. In: Hoff AJ, editor. Advanced EPR: Applications in Biology and Biochemistry. Amsterdam: Elsevier; 1989. p 277–306. [Google Scholar]
- 18.Mehdizadeh A An Investigation on Electromagnetic Fields and Properties of the Loop-Gap Resonator, a Lumped Mode Microwave Resonant Structure, [Ph. D. Thesis]. Milwaukee, Wisconsine: Marquette University; 1983. [Google Scholar]
- 19.Petryakov S, Samouilov A, Kesselring E, Wasowicz T, Caia G, Zweier JL. Single Loop - Multi Gap Resonator for Whole Body EPR Imaging of Mice at 1.2 GHz. J Magn Reson 2007;188(1):68–73. [DOI] [PMC free article] [PubMed] [Google Scholar]
- 20.Zweier JL, Kuppusamy P. Study of free radicals in the intact beating heart using low frequency electron paramagnetic resonance spectroscopy. Physic Medicine 1991;7:29–37. [Google Scholar]
- 21.Zweier JL, Kuppusamy P. EPR spectroscopy of free radicals in the perfused heart. Current Topics in Biophysics 1994;18:14–25. [Google Scholar]
- 22.Piasecki W, Froncisz W. Field distributions in loop-gap resonators. Meas Sci Technol 1993;4(12):1363–1369 [Google Scholar]
- 23.Matthaei GL, Young LE, Jones MT. Effects of Dissipative Element’s in Prototypes for Low-pass, Band-pass, or High-pass Filters. Microwave filters, Impedance-Matching Networks, and Coupling Structures: McGRAW-HII BOOK COMPANY; 1980. [Google Scholar]
- 24.Petryakov S, Samouilov A, Kesselring E, Kuppusamy P, Zweier JL. L-band Resonator for Imaging of Whole Mouse. 11th In Vivo EPR Spectroscopy and Imaging Conference EPR 2005; 2005; Columbus, Ohio. p 108. [Google Scholar]
- 25.Shirman YD, Electronic systems construction foundations and theory Handbook (in Russian), Moscow: Makvis; 1998, pp 250–252. [Google Scholar]
- 26.Chzhan M, Kuppusamy P, Samouilov A, He G, Zweier JL. A tunable reentrant resonator with transverse orientation of electric field for in vivo EPR spectroscopy. J Magn Reson 1999;137(2):373–378. [DOI] [PubMed] [Google Scholar]
- 27.Misra DK. Appendix E. Characteristics of selected materials. Practical Electromagnetics: From Biomedical Sciences to Wireless Communication: John Wiley & Sons, Inc; 2006. p 520. [Google Scholar]
- 28.Zhang SY, Njoku CC, Whittow WG, Vardaxoglou JC. Novel 3d Printed Synthetic Dielectric Substrates. Microwave and Optical Technology Letters 2015;57(10):2344–+. [Google Scholar]
- 29.Deffenbaugh PI, Rumpf RC, Church KH. Broadband Microwave Frequency Characterization of 3-D Printed Materials. Ieee Transactions on Components Packaging and Manufacturing Technology 2013;3(12):2147–2155. [Google Scholar]
- 30.Ecker JV, Haider A, Burzic I, Huber A, Eder G, Hild S. Mechanical properties and water absorption behaviour of PLA and PLA/wood composites prepared by 3D printing and injection moulding. Rapid Prototyping Journal 2019;25(4):672–678. [Google Scholar]
- 31.Sato-Akaba H, Kuwahara Y, Fujii H, Hirata H. Half-life mapping of nitroxyl radicals with three-dimensional electron paramagnetic resonance imaging at an interval of 3.6 seconds. Analytical Chemistry 2009;81(17):7501–7506. [DOI] [PubMed] [Google Scholar]
- 32.Chzhan M, Shteynbuk M, Kuppusamy P, Zweier JL. An optimized L-band resonator for EPR imaging of biological samples. J Magn Reson 1993;A105:49–53. [Google Scholar]
- 33.Freed JH, Leniart DS, Hyde JS. Theory of Saturation and Double Resonance Effects in ESR Spectra 3. Rf Coherence and Line Shapes. Journal of Chemical Physics 1967;47(8):2762–&. [Google Scholar]
- 34.He G, Evalappan SP, Hirata H, Deng Y, Petryakov S, Kuppusamy P, Zweier JL. Mapping of the B1 field distribution of a surface coil resonator using EPR imaging. Magn Reson Med 2002;48(6):1057–1062. [DOI] [PubMed] [Google Scholar]
- 35.Kawada Y, Hirata H, Fujii H. Use of multi-coil parallel-gap resonators for co-registration EPR/NMR imaging. J Magn Reson 2007;184(1):29–38. [DOI] [PubMed] [Google Scholar]
- 36.Ogata T, Ishikawa Y, Ono M, Berliner LJ. Visualization of Eddy-Current Losses in L-Band ESR Imaging. J Magn Reson 1992;97(3):616–622. [Google Scholar]
- 37.Samouilov A, Caia GL, Kesselring E, Petryakov S, Wasowicz T, Zweier JL. Development of a hybrid EPR/NMR coimaging system. Magn Reson Med 2007;58(1):156–166. [DOI] [PMC free article] [PubMed] [Google Scholar]
- 38.He G, Kutala VK, Kuppusamy P, Zweier JL. In vivo measurement and mapping of skin redox stress induced by ultraviolet light exposure. Free Radical Biology & Medicine 2004;36(5):665–672. [DOI] [PubMed] [Google Scholar]
- 39.He G, Shankar RA, Chzhan M, Samouilov A, Kuppusamy P, Zweier JL. Noninvasive measurement of anatomic structure and intraluminal oxygenation in the gastrointestinal tract of living mice with spatial and spectral EPR imaging. Proc Natl Acad Sci U S A 1999;96(8):4586–4591. [DOI] [PMC free article] [PubMed] [Google Scholar]
- 40.Ilangovan G, Bratasz A, Li H, Schmalbrock P, Zweier JL, Kuppusamy P. In vivo measurement and imaging of tumor oxygenation using coembedded paramagnetic particulates. Magn Reson Med 2004;52(3):650–657. [DOI] [PubMed] [Google Scholar]
- 41.Bobko AA, Eubank TD, Voorhees JL, Efimova OV, Kirilyuk IA, Petryakov S, Trofimiov DG, Marsh CB, Zweier JL, Grigoriev IA, Samouilov A, Khramtsov VV. In Vivo Monitoring of pH, Redox Status, and Glutathione Using L-Band EPR for Assessment of Therapeutic Effectiveness in Solid Tumors. Magn Reson Med 2012;67(6):1827–1836. [DOI] [PMC free article] [PubMed] [Google Scholar]
- 42.Foster MA, Grigor'ev IA, Lurie DJ, Khramtsov VV, McCallum S, Panagiotelis I, Hutchison JM, Koptioug A, Nicholson I. In vivo detection of a pH-sensitive nitroxide in the rat stomach by low-field ESR-based techniques. Magn Reson Med 2003;49(3):558–567. [DOI] [PubMed] [Google Scholar]
- 43.Komarov DA, Ichikawa Y, Yamamoto K, Stewart NJ, Matsumoto S, Yasui H, Kirilyuk IA, Khramtsov VV, Inanami O, Hirata H. In Vivo Extracellular pH Mapping of Tumors Using Electron Paramagnetic Resonance. Anal Chem 2018;90(23):13938–13945. [DOI] [PMC free article] [PubMed] [Google Scholar]
- 44.Eaton GR, Eaton SS, Rihard GA. Frequency dependence of EPR sensitivity. In: Blumler P, Blumich B, Botto R, Fukushima E, editors. Spatially Resolved Magnetic Resonance. Weinheim: Wiley-VCH; 1998. [Google Scholar]
- 45.Lebedev YS. High-frequency continuous wave electron spin resonance. In: Kevan L, Bowman NK, editors. Modern Pulsed and Continuous-Wave Electron Spin Resonance. New-York: Wiley; 1990. p 372. [Google Scholar]
- 46.Nesmelov YE, Gopinath A, Thomas DD. Aqueous sample in an EPR cavity: sensitivity considerations. J Magn Reson 2004;167(1):138–146. [DOI] [PMC free article] [PubMed] [Google Scholar]
- 47.Rinard GA, Quine RW, Eaton SS, Eaton GR. Frequency dependence of EPR signal intensity, 250 MHz to 9.1 GHz. J Magn Reson 2002;156(1):113–121. [DOI] [PubMed] [Google Scholar]
- 48.Rinard GA, Quine RW, Eaton SS, Eaton GR. Frequency dependence of EPR signal intensity, 248 MHz to 1.4 GHz. J Magn Reson [DOI] [PubMed] [Google Scholar]
- 49.Fuchs J, Herrling T, Groth N. Detection of free radicals in skin: a review of the literature and new developments. Curr Probl Dermatol 2001;29:1–17. [DOI] [PubMed] [Google Scholar]
- 50.Liebgott T, Li H, Deng Y, Zweier JL. Proton electron double resonance imaging (PEDRI) of the isolated beating rat heart. Magn Reson Med 2003;50(2):391–399. [DOI] [PubMed] [Google Scholar]
- 51.Rinard GA, Quine RW, Harbridge JR, Song R, Eaton GR, Eaton SS. Frequency dependence of EPR signal-to-noise. J Magn Reson 1999;140(1):218–227. [DOI] [PubMed] [Google Scholar]
- 52.Ahn KH, Subramanian VS, Mailer C, Pan X, Halpern HJ. Scaling of EPR spectra-spatial images: Images of samples greater than 5 cm in linear dimension. 47th Rocky Mountain Conference on Analytical Chemistry. Denver, Colorado, USA2005. p 45. [Google Scholar]
- 53.Alecci M, Seimenis I, McCallum SJ, Lurie DJ, Foster MA. Nitroxide free radical clearance in the live rat monitored by radio-frequency CW-EPR and PEDRI. Physics in Medicine & Biology 1998;43(7):1899–1905. [DOI] [PubMed] [Google Scholar]
- 54.Amida T, Nakaoka R, Komarov DA, Yamamoto K, Inanami O, Matsumoto S, Hirata H. A 750-MHz Electronically Tunable Resonator Using Microstrip Line Couplers for Electron Paramagnetic Resonance Imaging of a Mouse Tumor-Bearing Leg. IEEE Trans Biomed Eng 2018;65(5):1124–1132. [DOI] [PubMed] [Google Scholar]
- 55.Brivati JA, Stevens AD. A radiofrequency ESR spectrometer for in vivo imaging. J Magn Reson 1991;92:480–489. [Google Scholar]
- 56.Diodato R, Alecci M, Brivati JA, Varoli V, Sotgiu A. Optimization of axial RF field distribution in low-frequency EPR loop-gap resonators. Physics in Medicine & Biology 1999;44(5):N69–75. [DOI] [PubMed] [Google Scholar]
- 57.Oikawa K, Ogata T, Togashi H, Yokoyama H, Ohya-Nishiguchi H, Kamada H. A 3D- and 4D-ESR imaging system for small animals. Appl Radiat Isot 1996;47(11–12):1605–1609. [DOI] [PubMed] [Google Scholar]
- 58.Manabe T, Matsumura A, Yokokawa K, Saito T, Fujikura M, Iwahara N, Matsushita T, Suzuki S, Hisahara S, Kawamata J, Suzuki H, Emoto MC, Fujii HG, Shimohama S. Evaluation of Mitochondrial Oxidative Stress in the Brain of a Transgenic Mouse Model of Alzheimer’s Disease by in vitro Electron Paramagnetic Resonance Spectroscopy. J Alzheimers Dis 2019;67(3):1079–1087. [DOI] [PubMed] [Google Scholar]
- 59.Petryakov S, Samouilov A, Chzhan-Roytenberg M, Kesselring E, Sun Z, Zweier JL. Segmented surface coil resonator for in vivo EPR applications at 1.1GHz. J Magn Reson 2009;198(1):8–14. [DOI] [PMC free article] [PubMed] [Google Scholar]
- 60.Sato-Akaba H, Tseytlin M. Development of an L-band rapid scan EPR digital console. J Magn Reson 2019;304:42–52. [DOI] [PMC free article] [PubMed] [Google Scholar]
- 61.Fajer P, Marsh D. Microwave field inhomogeneities and the effect of cavity Q in saturation transfer ESR spectra. Dependence on sample size. J Magn Reson 1982;49:212–224. [Google Scholar]
- 62.Rinard GA, Quine RW, Eaton SS, Eaton GR. Microwave coupling structures for spectroscopy. J Magn Reson 1993;A105:137–144. [Google Scholar]
- 63.Wojciech P, Wojciech F. Field distributions in loop-gap resonators. Meas Sci Technol 1993;4:1363–1369. [Google Scholar]
- 64.Petryakov S, Samouilov A, Kesselring E, Caia GL, Sun Z, Zweier JL. Dual frequency resonator for 1.2 GHz EPR/16.2 MHz NMR co-imaging. J Magn Reson 2010;205(1):1–8. [DOI] [PMC free article] [PubMed] [Google Scholar]
- 65.Petryakov S, Chzhan M, Samouilov A, He G, Kuppusamy P, Zweier JL. A bridged loop-gap S-band surface resonator for topical EPR spectroscopy. J Magn Reson 2001;151(1):124–128. [DOI] [PubMed] [Google Scholar]
- 66.Salikhov I, Hirata H, Walczak T, Swartz HM. An improved external loop resonator for in vivo L-band EPR spectroscopy. J Magn Reson 2003;164(1):54–59. [DOI] [PubMed] [Google Scholar]
- 67.Fujii H, Sato-Akaba H, Kawanishi K, Hirata H. Mapping of redox status in a brain-disease mouse model by three-dimensional EPR imaging. Magn Reson Med 2011;65(1):295–303. [DOI] [PubMed] [Google Scholar]