Abstract
The tolerance of Cytidine Deaminase (CDA) to expanded heterocycles is explored via three fluorescent cytidine analogues, where the pyrimidine core is fused to three distinct five-membered heterocycles at the 5/6 positions. The reaction between CDA and each analogue is followed by absorption and emission spectroscopy, revealing shorter reaction times for all analogues than the native substrate. Pseudo-first order and Michaelis-Menten kinetic analyses provide insight into the enzymatic deamination reactions and assist in drawing comparison to established structure activity relationships. Finally, inhibitor screening modalities are created for each analogue and validated with Zebularine and tetrahydrouridine, two known CDA inhibitors.
Graphical Abstract
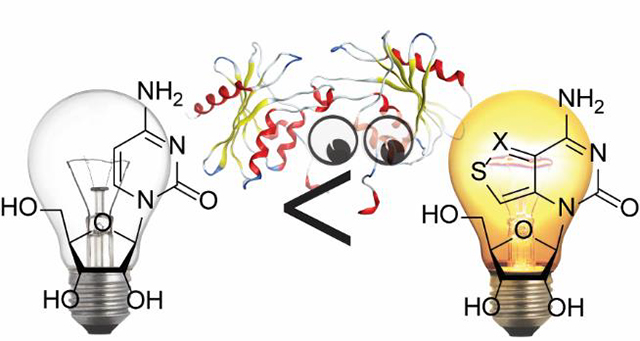
Cytidine Deaminase effectively deaminates three emissive fused cytidine analogues and the reactions can be monitored in real time by fluorescence.
Introduction
Cytidine deaminase (CDA) is a key enzyme of the pyrimidine salvage pathway that deaminates cytidine and 2’-deoxycytidine to uridine and 2’-deoxyuridine, respectively (Fig. 1a).1 It has been shown to also deaminate several chemotherapeutic agents, including the anti-cancer agents cytarabine, gemcitabine and 5’-azadeoxycytidine, thus diminishing their potency.2–5 Inhibitors of CDA are thus highly sought after for co-administration and mitigation of this detrimental process.1
Figure 1.

a) Top: Enzymatic deamination of cytidine to uridine by CDA; Bottom: Enzymatic deamination of tzC, thC, and mthC to tzU, thU, and mthU, respectively; b) CDA Inhibitors diazepinone riboside, phospharpyrimidine riboside, tetrahydrouridine, and zebularine.
Since deamination involves a nucleophilic attack at the C4 position by a Zn-activated water molecule,6–8 a common inhibition strategy is to employ transition state analogues, which mimic the tetrahedral intermediate formed.8–14 Three such inhibitors are diazepinone riboside, phosphapyrimidine riboside, and tetrahydrouridine (THU) (Fig. 1b).13,15–17 Separate from this approach, zebularine, a cytidine analogue, has been found to be a potent inhibitor as well (Fig. 1b).16–17 Of these, THU is the only one to have been co-administered with the previously mentioned chemotherapeutic agents.2–5
In the search for new inhibitors and substrates, several approaches have been used to monitor CDA activity. These include a colorimetric assay that monitors ammonia production,18 assays using high performance liquid chromatography to monitor cytidine and uridine concentrations,19–20 and spectrophotometric assays monitoring changes in absorption spectra.1,21–22 These assays suffer from lengthy time windows and potential interference by the inhibitors or the protein. As such they are fundamentally unfit for real-time and high throughput operations.
In light of the emerging role of CDA in human disease,23 the search for new inhibitors of CDA will likely continue, and new rapid methods of monitoring CDA activity and its substrate/inhibitor tolerance are needed. While numerous fluorescent C analogues have been described, to the best of our knowledge, there are none reported that undergo deamination by CDA.24 That CDA binds the bulkier 7-member ring of Diazepinone riboside suggests the binding pocket might be roomier than previously thought.8,17 Larger two ring heterocycles, such as purine-related analogues, might therefore be amenable to deamination and augment this repertoire. We therefore set out to explore expanded fluorescent C heterocycles and their CDA tolerance as substrates and potential tools for studying the enzyme and its inhibition.
In recent advances by Shin et al. and Rovira et al., two fluorescent fused cytidine and uridine analogues have been reported (Fig. 1a; tzC and thC).25–27 These fluorescent ribonucleosides absorb above 300 nm and emit in the visible spectrum.25–27 The emission range and maxima of each C and U analogue pair is distinct, providing a plethora of wavelengths with which to monitor their interconversions. In addition, the spectra are sufficiently red-shifted to minimize potential background signals from proteins and canonical pyrimidine-based inhibitors. We hypothesized that these analogues may thus provide a simple pathway for monitoring CDA activity using fluorescence spectroscopy.
Herein we report three new emissive substrates of CDA and exploit them to provide insight into the enzyme pocket and for fabricating three screening assays. This is facilitated first by supplementing our previously reported emissive C analogs25–27 and synthesizing a third fluorescent ribonucleoside analogue pair, mthC and mthU (Fig. 1a). We then monitor the reactions through absorption and emission spectroscopy and compare the reaction rates to establish a structure activity relationship. Finally, we demonstrate the utility of these newfound substrates by assembling a screening assay template with each substrate and validating them using zebularine and THU as model inhibitors.
Results
Synthesis and Photophysical Analysis of mthC and mthU
The synthesis of tzC and thC, as well as tzU and thU, have been reported.25–27 The pathway to mthC and mthU began with a Michael addition of methyl thioglycolate to methyl crotonate (Scheme 1). The resulting thioether was cyclized under Claisen condensation conditions to yield 1.28 Hydroxylamine was added to 1 to yield an oxime, which was subsequently treated with HCl in ether, yielding 2 as a precipitate.28 Compound 2 was treated with potassium cyanate under mildly acidic conditions to produce the urea 3.28 Compound 3 was then cyclized to the nucleobase 4 with sodium methoxide,28 which was treated with N,O-bis(trimethylsilyl)acetamide and then glycosylated with a benzoyl protected ribose precursor in the presence TMS triflate to give the fully protected mthU (5).28 The reaction produced only one diastereomer and crystal structure determination confirmed the proposed structure, revealing the desired beta anomeric configuration (Scheme 1). A portion of nucleoside 5 was deprotected with methanolic ammonia to provide mthU.28 The remaining was converted to mthC via 6, by treatment with phosphoryl chloride and triazole in pyridine, followed by ammonolysis in methanolic ammonia (Scheme 1).28
Scheme 1.
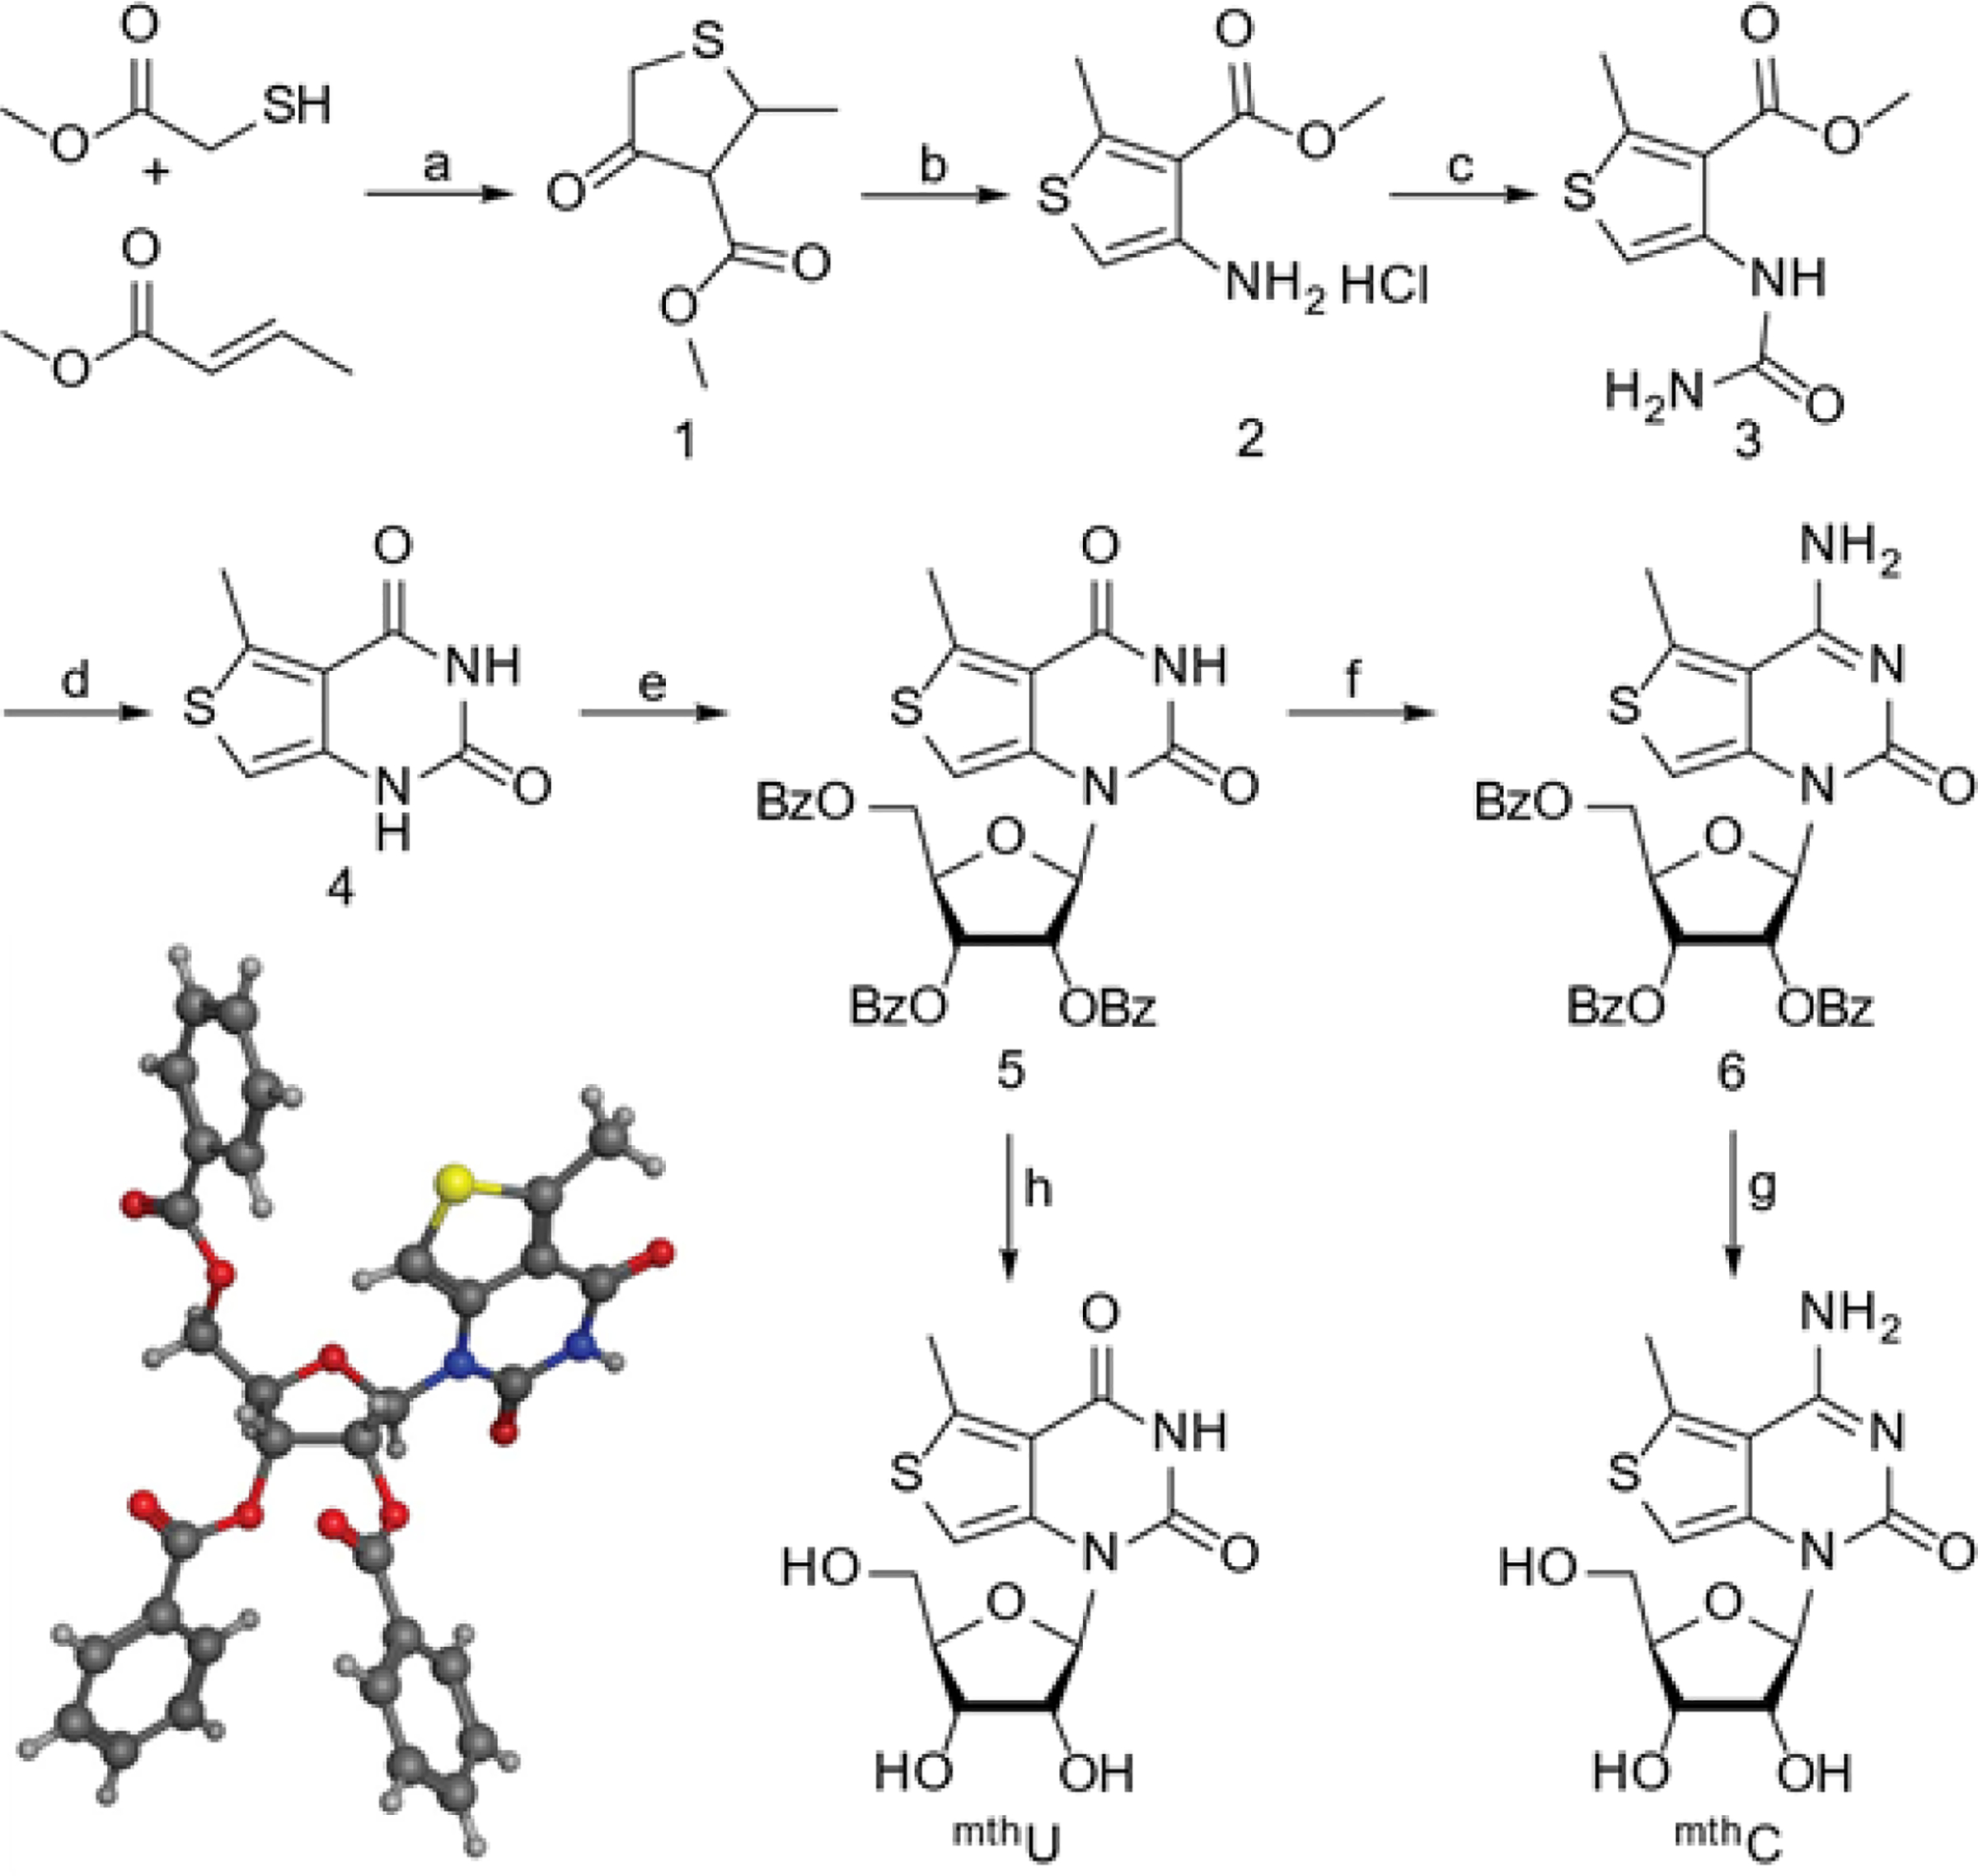
Synthetic pathways to mthU and mthC; aReagents and Conditions: (a) i) Piperidine, 50⁰C, 2 h; ii) NaH (60% in mineral oil), THF, 70⁰C, overnight, 19% over two steps. (b) i) 1, BaCO3, hydroxylamine hydrochloride, MeOH, 70⁰C, overnight; ii) 2M HCl in OEt2, OEt2, MeOH, RT, 24 h, 78% over two steps. (c) Potassium cyanate, acetic acid (30%), RT, overnight, 94%. (d) Sodium methoxide, MeOH, RT, 15 h, 91%. (e) N,O-bis(trimethylsilyl)acetamide, β-D-ribofuranose 1-acetate 2,4,5-tribenzoate, TMS Triflate, ACN, 85⁰C, 3 h, 85%. (f) i) Phosphoryl (V) Chloride, 1,2,4-triazole, pyridine, RT, 1 h; ii) Saturated ammonium hydroxide, RT, 3 h, 43% over two steps. (g) Ammonia saturated MeOH, 65⁰C, overnight, 53%. (h) Ammonia saturated MeOH, 65⁰C, overnight, 85%. Inset: Crystal structure of 5.
Absorption spectra of mthC and mthU were taken in water, displaying maxima at 323 and 306 nm, and extinction coefficients of 3350 and 2550 M–1cm–1, respectively. Excitation at these maxima yielded visible emission, with emission maxima at 455 and 427 nm and quantum yields (determined with reference to 2-aminopurine in water) of 0.24 and 0.30, respectively. The resulting Stokes shifts calculated from the absorption and emission maxima were 8930 and 9260 cm–1 for mthC and mthU, respectively.
Reactions of Cytidine Analogues With CDA
To determine whether CDA accepted tzC, thC and mthC as substrates, HPLC analysis of their enzymatic deamination reactions was performed and compared to the reaction of the native substrate. Chromatograms taken after 60 minutes confirmed complete conversion to uridine or the corresponding U analogue (Fig. S1–4). The reactions were then monitored via changes in absorbance (Fig. 2a–c). Initially, steady state traces were taken various time points during the reaction revealing isosbestic points for tzC and tzU, thC and thU, and mthC and mthU at 293, 292, and 305 nm respectively. For each analogue pair, the absorption intensity decreased and blue-shifted as the reaction progressed (Fig. 2a–c). The reactions were further monitored by changes in emission upon excitation at the respective isosbestic point (Fig. 2d–f). Steady state traces were taken at various time points over 30 minutes. As tzC converted to tzU, emission intensity decreased and blue-shifted (Fig. 2d). For the conversion of thC to thU, emission intensity slightly increased and slightly blue shifted revealing an isoemissive point at 430 nm (Fig. 2e). As mthC converted to mthU, emission intensity increased and blue-shifted (Fig. 2f). The absorption of tzC, thC, and mthC reactions with CDA was then monitored at 340, 330, and 330 nm respectively (Fig. 3a,c). Finally, the emission of tzC, thC, and mthC reactions with CDA were recorded at 408, 400, and 427 nm, respectively, upon excitation at the corresponding isosbestic point (Fig. 3b,d).
Figure 2.
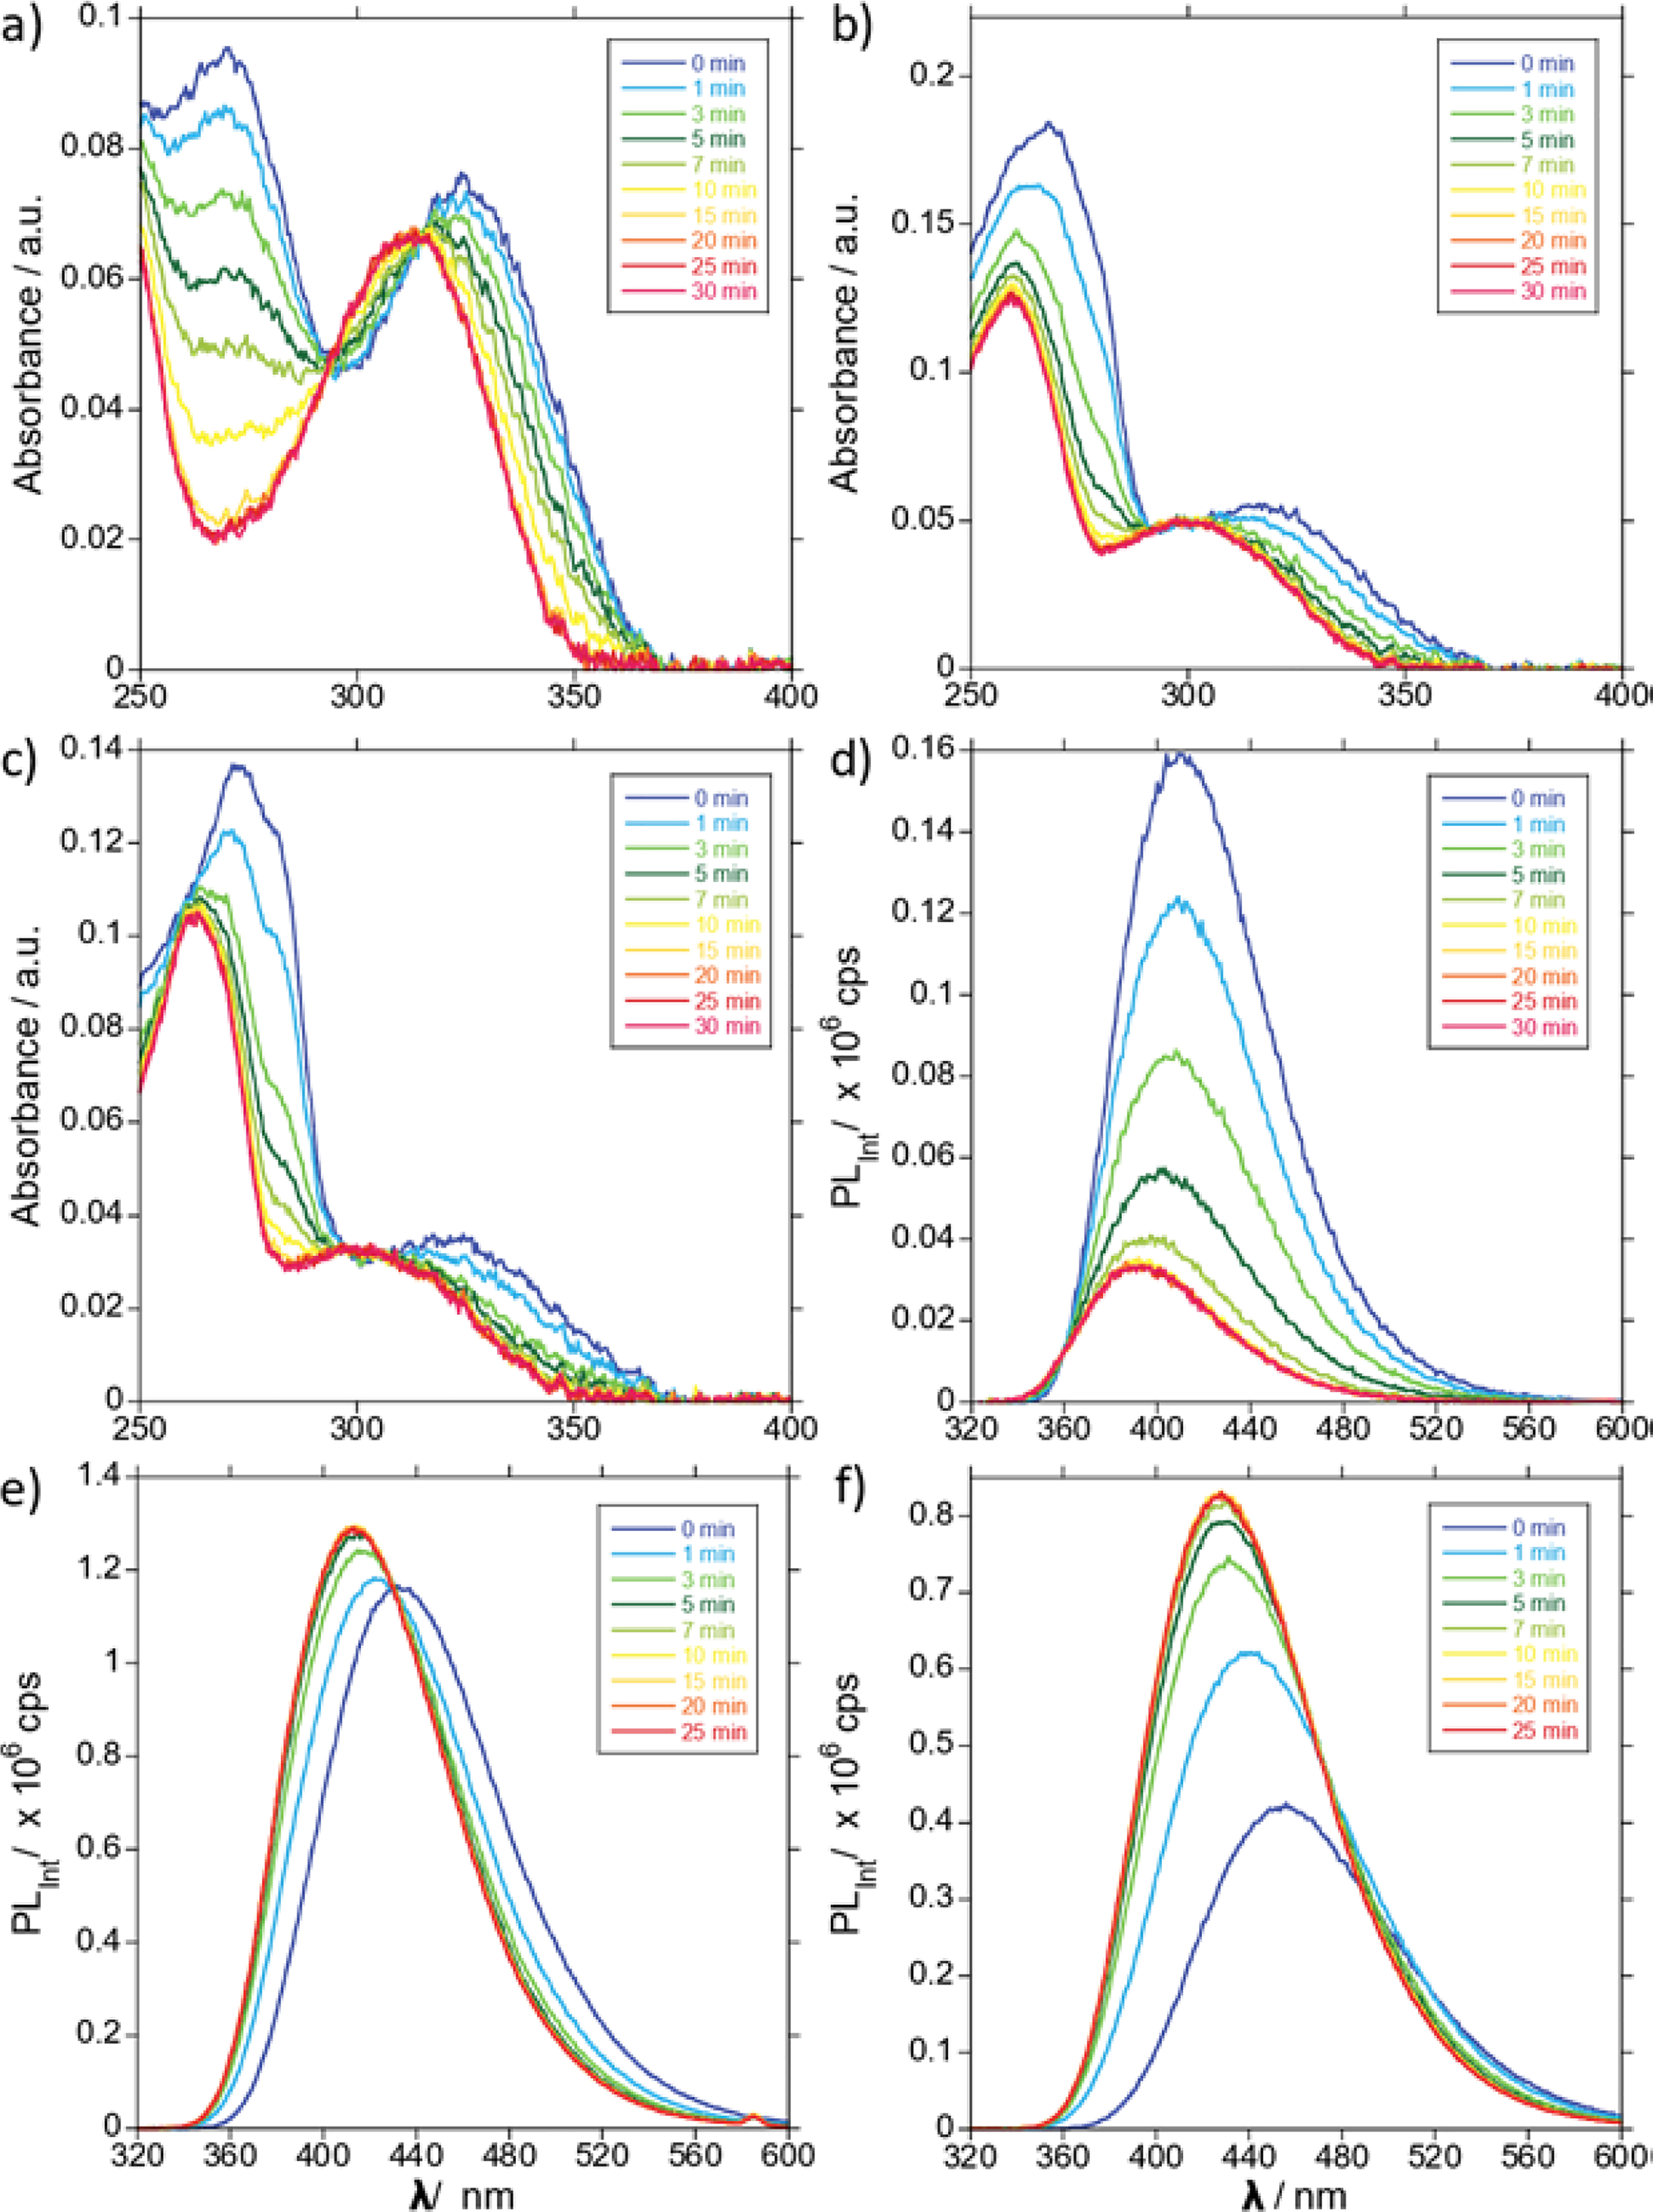
Steady state absorption traces of (a) tzC, (b) thC, and (c) mthC CDA-mediated conversion to tzU, thU, and mthU respectively, over a time range from 0 to 30 min; Steady state emission traces of (d) tzC, (e) thC, and (f) mthC CDA-mediated conversion to tzU, thU, and mthU respectively, over a time range from 0 to 30 min.
Figure 3.
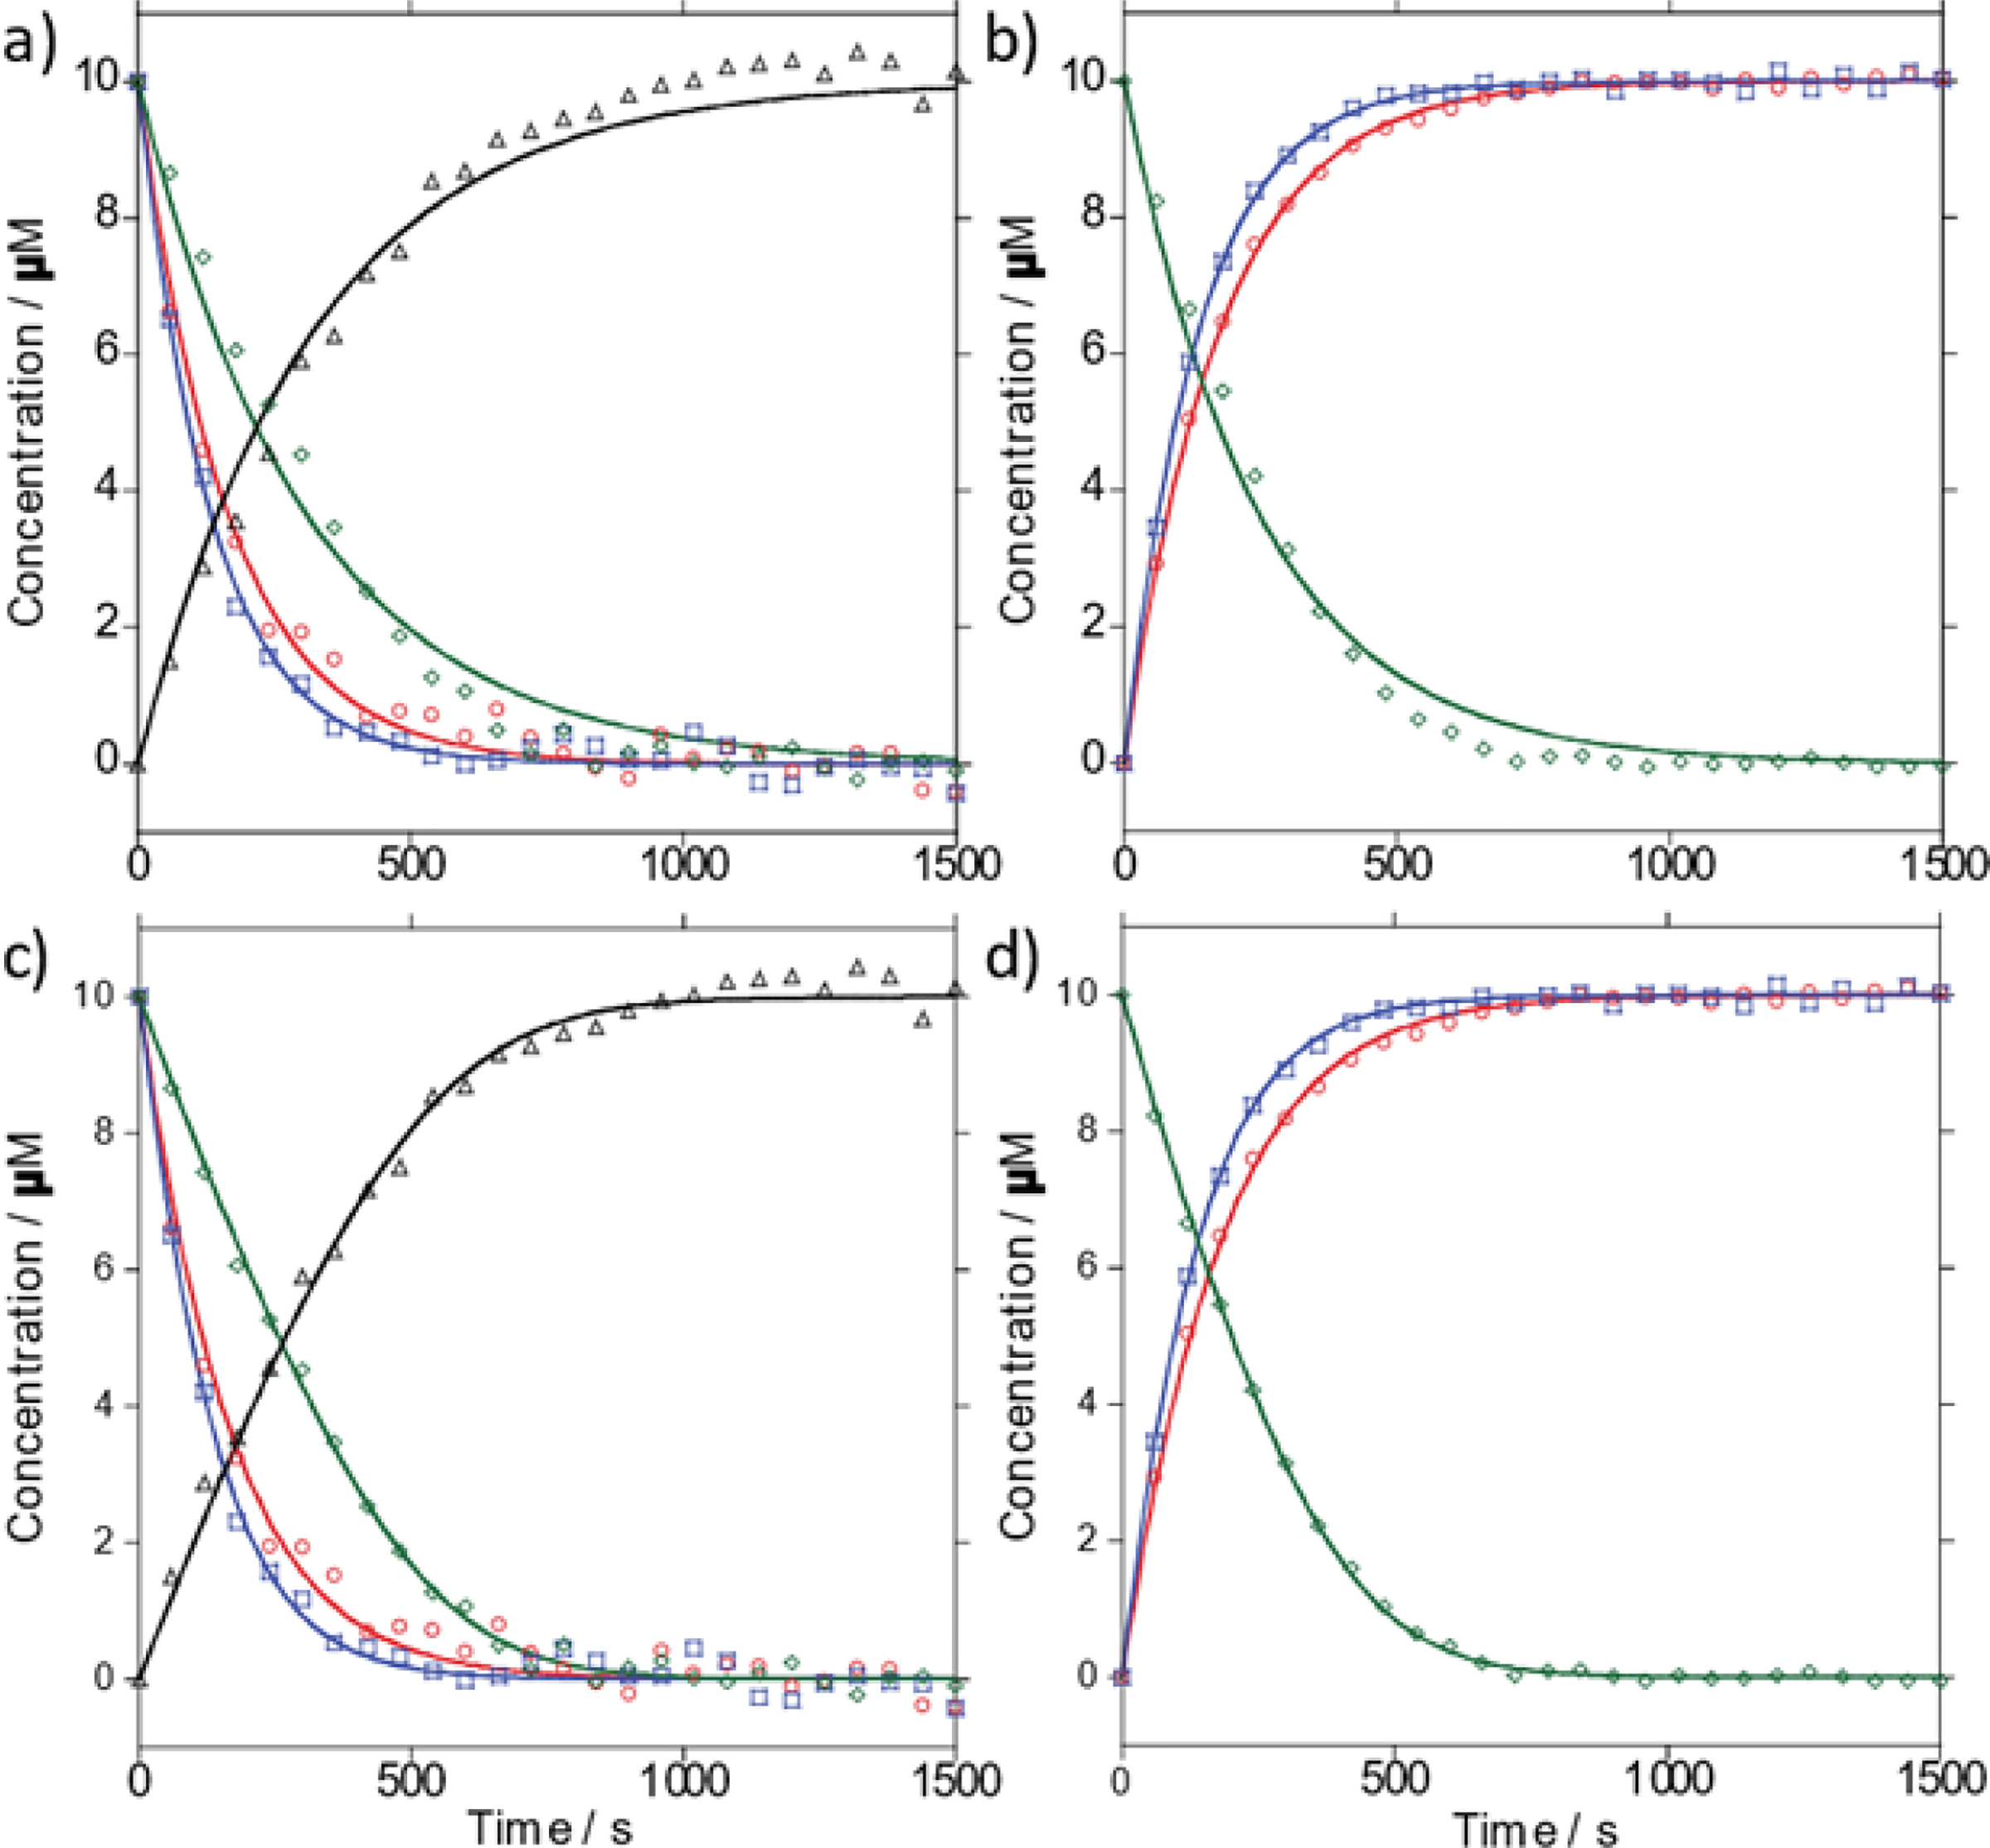
Enzymatic conversion of C (black), tzC (green), thC (blue), and mthC (red) to U, tzU, thU, and mthU by CDA. Reactions were monitored by absorbance (a, c) and emission (b, d) and fit to a first order curve (a, b) or to an integrated Michaelis-Menten set of differential equations (c, d).
Analysis of the Reactions of Cytidine Analogues With CDA
The data from the aforementioned reactions monitored by absorption and emission were analyzed using two kinetic models, a pseudo-first order model (Eq. 1–2) and a set of differential equations based on Michaelis-Menten kinetics (Eq. 3–6). The pseudo-first order model fits to the absorption curves revealed kapp values of 3.1 ± 0.1, 3.3 ± 0.1, 7.2 ± 0.2, and 6.1 ± 0.2 s–1 and t1/2 values of 220 ± 12, 210 ± 16, 92 ± 5, and 110 ± 2 s for C, tzC, thC, and mthC, respectively. The pseudo-first order model fits to the emission curves revealed kapp values of 4.1 ± 0.1, 7.4 ± 0.1, and 5.7 ± 0.1 s–1 and t1/2 values of 170 ± 10, 94 ± 2, and 120 ± 8 s for tzC, thC, and mthC, respectively.
| (1) |
| (2) |
| (3) |
| (4) |
| (5) |
| (6) |
| (7) |
Analysis of the absorption curves via the Michaelis-Menten differential equations revealed k1 values of 0.91 ± 0.42, 1.04 ± 0.01, 1.01 ± 0.47, and 0.75 ± 0.16 μM–1 s–1 and k2 values of 3.2 ± 2.1, 3.2 ± 0.3, 34 ± 7.2, and 56 ± 5.9 s–1 for C, tzC, thC and mthC, respectively. Analysis of the emission curves via the same method revealed k1 values of 1.06 ± 0.32, 0.95 ± 0.14 and 0.71 ± 0.18 μM–1 s–1 and k2 values of 4.6 ± 1.3, 46 ± 5.3, and 45 ± 2.3 s−1 for tzC, thC and mthC, respectively. k−1 values were assumed to be 10% of k1 values. KM values calculated from the k1, k−1, and k2 values of the absorption curve fits were 3.6, 3.1, 34, and 75 μM for C, tzC, thC, and mthC, respectively. The KM of C previously reported for the Q27/A70 variant of CDA, which was used in this work, was 17.6 μM. KM values calculated from the k1, k−1, and k2 values obtained from the emission curve fits were 4.4, 49, and 63 μM for tzC, thC and mthC, respectively.
Inhibition by Zebularine and THU
Testing the potency of zebularine as a CDA inhibitor using tzC, thC and mthC as C surrogates revealed IC50 values of 5.0 ± 0.4, 2.7 ± 0.2, and 1.5 ± 0.1 μM, respectively (Table 2). Using the Cheng-Prusoff equation (Eq. 7), KI values were calculated to be 1.5 ± 0.1, 2.2 ± 0.1, and 1.3 ± 0.1 μM, respectively (Table 2). Similarly, evaluating THU as an inhibitor employing tzC, thC, and mthC revealed IC50 values of 3.1 ± 0.5, 1.7 ± 0.3, and 0.61 ± 0.11 μM, respectively (Table 2). KI values were found to be 0.95 ± 0.16, 1.4 ± 0.2, and 0.53 ± 0.10 μM, respectively. Reassessing zebularine using mthC as the emissive surrogate in the presence of 100 μM adenosine revealed IC50 and KI values of 2.34 ± 0.59 and 2.02 ± 0.51 μM, respectively.
Table 2.
Experimentally Determined IC50 and KI Values of Zebularine and THU.
| Inh. | IC50 (μM) | KI (μM) | R2 | |
|---|---|---|---|---|
| tzC | Zeb | 5.0 ± 0.4 | 1.5 ± 0.1 | 0.999 |
| thC | Zeb | 2.7 ± 0.2 | 2.2 ± 0.1 | 0.999 |
| mthC | Zeb | 1.5 ± 0.1 | 1.3 ± 0.1 | 0.999 |
| tzC | THU | 3.1 ± 0.5 | 0.95 ± 0.16 | 0.948 |
| thC | THU | 1.7 ± 0.3 | 1.4 ± 0.2 | 0.995 |
| mthC | THU | 0.61 ± 0.11 | 0.53 ± 0.10 | 0.995 |
Data are presented as mean ± SD.
Discussion
Over the years, highly isomorphic fluorescent ribonucleosides have provided insight into enzyme kinetics and substrate specificity.29–33 The diverse cellular pathways these enzymes take range anywhere from immune response and signalling to purine degradation and general metabolism.29–33 In the case of adenosine deaminase (ADA), comparing two adenosine analogues as substrates illustrated the importance of N7 on deamination kinetics.26,27,29,32 We took this case as inspiration for further exploring other enzymes including cytidine deaminase. We suspected that, as in the case of ADA, synthetic cytidine analogues might be able to provide indirect insight into CDA substrate scope. We thus explored the ability of CDA to deaminate increasingly perturbed C analogues, with distinct levels of steric bulk and heteroatom composition, ranging from tzC, thC, to mthC (Fig. 1a). We already had previously synthesized tzC and thC, but mthC had yet to be reported so we began by developing a synthetic route to it.
Synthesis of mthC started with cheap, commercially available starting materials methyl thioglycolate and methyl crotonate and was completed over 7 steps (Scheme 1). The corresponding U analogue mthU, the potential product of a reaction of mthC with CDA, was synthesized so that it could be used as a reference to confirm successful deamination by CDA (Scheme 1). In anticipation of the spectral changes that would be observed during a reaction of mthC with CDA, we compared the absorption and emission spectra of mthC and mthU. Extinction coefficients, Stokes shifts, and quantum yields were calculated indicating decreases in absorption at wavelengths above 305 nm, and increases in emission intensity at wavelengths between 360 and 470 nm would occur if mthC was converted to mthU.28
With the new and previously reported analogues in hand, we incubated cytidine and each C analogue with CDA for 60 minutes. The reactions were HPLC analyzed, confirming all three substrates were deaminated to completion (Fig. S1–4).28 To explore whether the unique spectral features of the analogues could be used to monitor the deamination reactions, we first monitored the steady state absorption spectra of a reaction of CDA with each C analogue over 30 minutes (Fig. 2a–c). The spectra revealed isosbestic points of 293 nm for tzC and tzU, 292 nm for thC and thU, and 305 nm for mthC and mthU (Fig. 2a–c). Steady state emission spectra were then taken at the same time points during the reaction by exciting at the respective isoabsorptive wavelengths (Fig. 2d–f). The resulting spectra indicated a range of wavelengths from the near UV to the visible spectrum with which to spectroscopically observe their enzymatic interconversion (Fig. 2). We chose to monitor the reaction of cytidine, tzC, thC, and mthC with CDA via absorption at 260 nm, 340 nm, 330 nm, and 330 nm respectively (Fig. 3a,c). We also chose to monitor the reaction of tzC, thC, and mthC via emission at 408 nm upon excitation at 293 nm, 400 nm upon excitation at 292 nm, and 427 nm upon excitation at 305 nm respectively (Fig. 3b,d). The reaction times to completion of all three C analogues were found to be shorter than cytidine in both absorption and emission (Table 1).
Table 1.
Reaction Rate Constants for CDA Mediated Deamination.
| Pseudo-First Order | Michaelis-Menten | |||||||
|---|---|---|---|---|---|---|---|---|
| kapp (x 10−3 s−1) | t1/2 (s) | R2 | k1 (μM−1 s−1) | k−1[a] (s−1) | k2 (s−1) | KM (μM)[b] | ||
| Abs | C | 3.1 ± 0.1 | 220 ± 12 | 0.981 | 0.91 ± 0.42 | 0.091 | 3.2 ± 2.1 | 3.6 |
| tzC | 3.3 ± 0.1 | 210 ± 16 | 0.979 | 1.04 ± 0.01 | 0.104 | 3.2 ± 0.3 | 3.1 | |
| thC | 7.2 ± 0.2 | 92 ± 5 | 0.992 | 1.01 ± 0.47 | 0.101 | 34 ± 7.2 | 34 | |
| mthC | 6.1 ± 0.2 | 110 ± 2 | 0.987 | 0.75 ± 0.16 | 0.075 | 56 ± 5.9 | 75 | |
| Em | tzC | 4.1 ± 0.1 | 170 ± 10 | 0.988 | 1.06 ± 0.32 | 0.106 | 4.6 ± 1.3 | 4.4 |
| thC | 7.4 ± 0.1 | 94 ± 2 | 0.999 | 0.95 ± 0.14 | 0.095 | 46 ± 5.3 | 49 | |
| mthC | 5.7 ± 0.1 | 120 ± 8 | 0.999 | 0.71 ± 0.18 | 0.071 | 45 ± 2.3 | 63 | |
Data are presented as mean ± SD.
Values were assumed to be ≤10% of k1 values.
Values calculated from k1, k−1, and k2.
To quantify our observations, curves assuming pseudo-first order conditions were fit to the data yielding kapp values (Eqs. 1–2, Table 1). The kapp values were converted to t1/2 values for further comparison (Table 1). The reaction t1/2 value for tzC was found to be slightly shorter than C while the t1/2 values for thC and mthC were found to be two- to three-fold shorter with thC being the shortest (Table 1). The kapp and t1/2 values determined by curve fitting the observed changes in absorption and emission were found to be in good agreement with each other (Fig. 3a,b, Table 1). Intriguingly, the reaction rates suggested the addition of a thiophene ring off of the 5 and 6 positions of the pyrimidine ring improved deamination kinetics by CDA.
To further clarify these observations, a set of differential equations corresponding to the Michaelis-Menten kinetics were solved setting initial concentrations to those used in the experiments to yield time dependent substrate and product concentration curves.34–36 Those curves were fitted to the experimental data and optimized by maximizing R2, yielding k1, k2, and KM values (Eqs. 3–6, Fig. 3c,d, Table 1). While perhaps less accurate than a thorough Michaelis-Menten analyses, this streamlined approach was taken as our goal was to only compare several related substrates to one another and gain insight into their interactions with the enzyme. k−1 values below 10% of k1 values had minimal effect on R2 (varying less than 0.0001). KM values were only slightly affected at this range (3.3% at most), thus we restricted k−1 values to 10% of k1 values, effectively setting them as an upper limit to what they could be. KM values of CDA with various substrates have been previously reported indicating the enzyme adheres to Michaelis-Menten kinetics.1,2,6,12,17,18,20–23 The model revealed a slightly larger binding rate constant (k1) for tzC and thC when compared to cytidine, suggesting the fusion of a five-membered isothiazole or thiophene ring improved binding. The slightly smaller binding rate constant for mthC indicated the bulky methyl group diminishes binding, but not detrimentally, suggesting some tolerance for steric perturbation. The model further showed the deamination and unbinding rate constant (k2) for thC and mthC was faster than cytidine, but about the same for tzC as compared to cytidine (Table 1). This indicated the shorter t1/2 observed for mthC was dominated by the deamination rate rather than binding. This further confirmed the expansion of the ring system in cytidine could potentially improve substrate reception by the enzyme.
With a number of new substrates to monitor CDA activity effectively and in real time, we chose two known inhibitors, zebularine and THU, to validate these emissive nucleosides as tools for screening assays. Reactions of each C analogue with CDA were monitored via emission under the same conditions as described above, but with varying concentrations of either inhibitor (Fig. 4a,b). A selected time point for each reaction was compared to a reference reaction without inhibitor and plotted against inhibitor concentration (Fig. 4c,d). IC50 values were calculated from Hill curves fit to the resulting plots (Fig. 4c,d). The IC50 values were then converted to KI values via the Cheng-Prusoff equation (Eq. 7, Table 2). The KI values of zebularine and THU show slight variance between the three substrates used. While its origin is unclear at present, we note that Laliberte et al. have also reported discrepancies in KI values for zebularine and THU depending on the substrates used.17 In addition, zebularine was analyzed in the presence of 100 μM adenosine with mthC by the same method as described without adenosine (Fig. 4c). The IC50 and KI values resulting from the analysis with 100 μM adenosine are 2.34 ± 0.59 and 2.02 ± 0.51 μM, respectively, in good agreement with the values calculated without adenosine (Table 2). The consistency in IC50 and Ki values confirmed that each C analogue was an effective alternative for characterizing inhibitors of CDA. Furthermore, the similarity of the IC50 and KI values obtained with and without excess adenosine using mthC to monitor CDA activity indicated that background signal from similar molecules was less of a factor.
Figure 4.
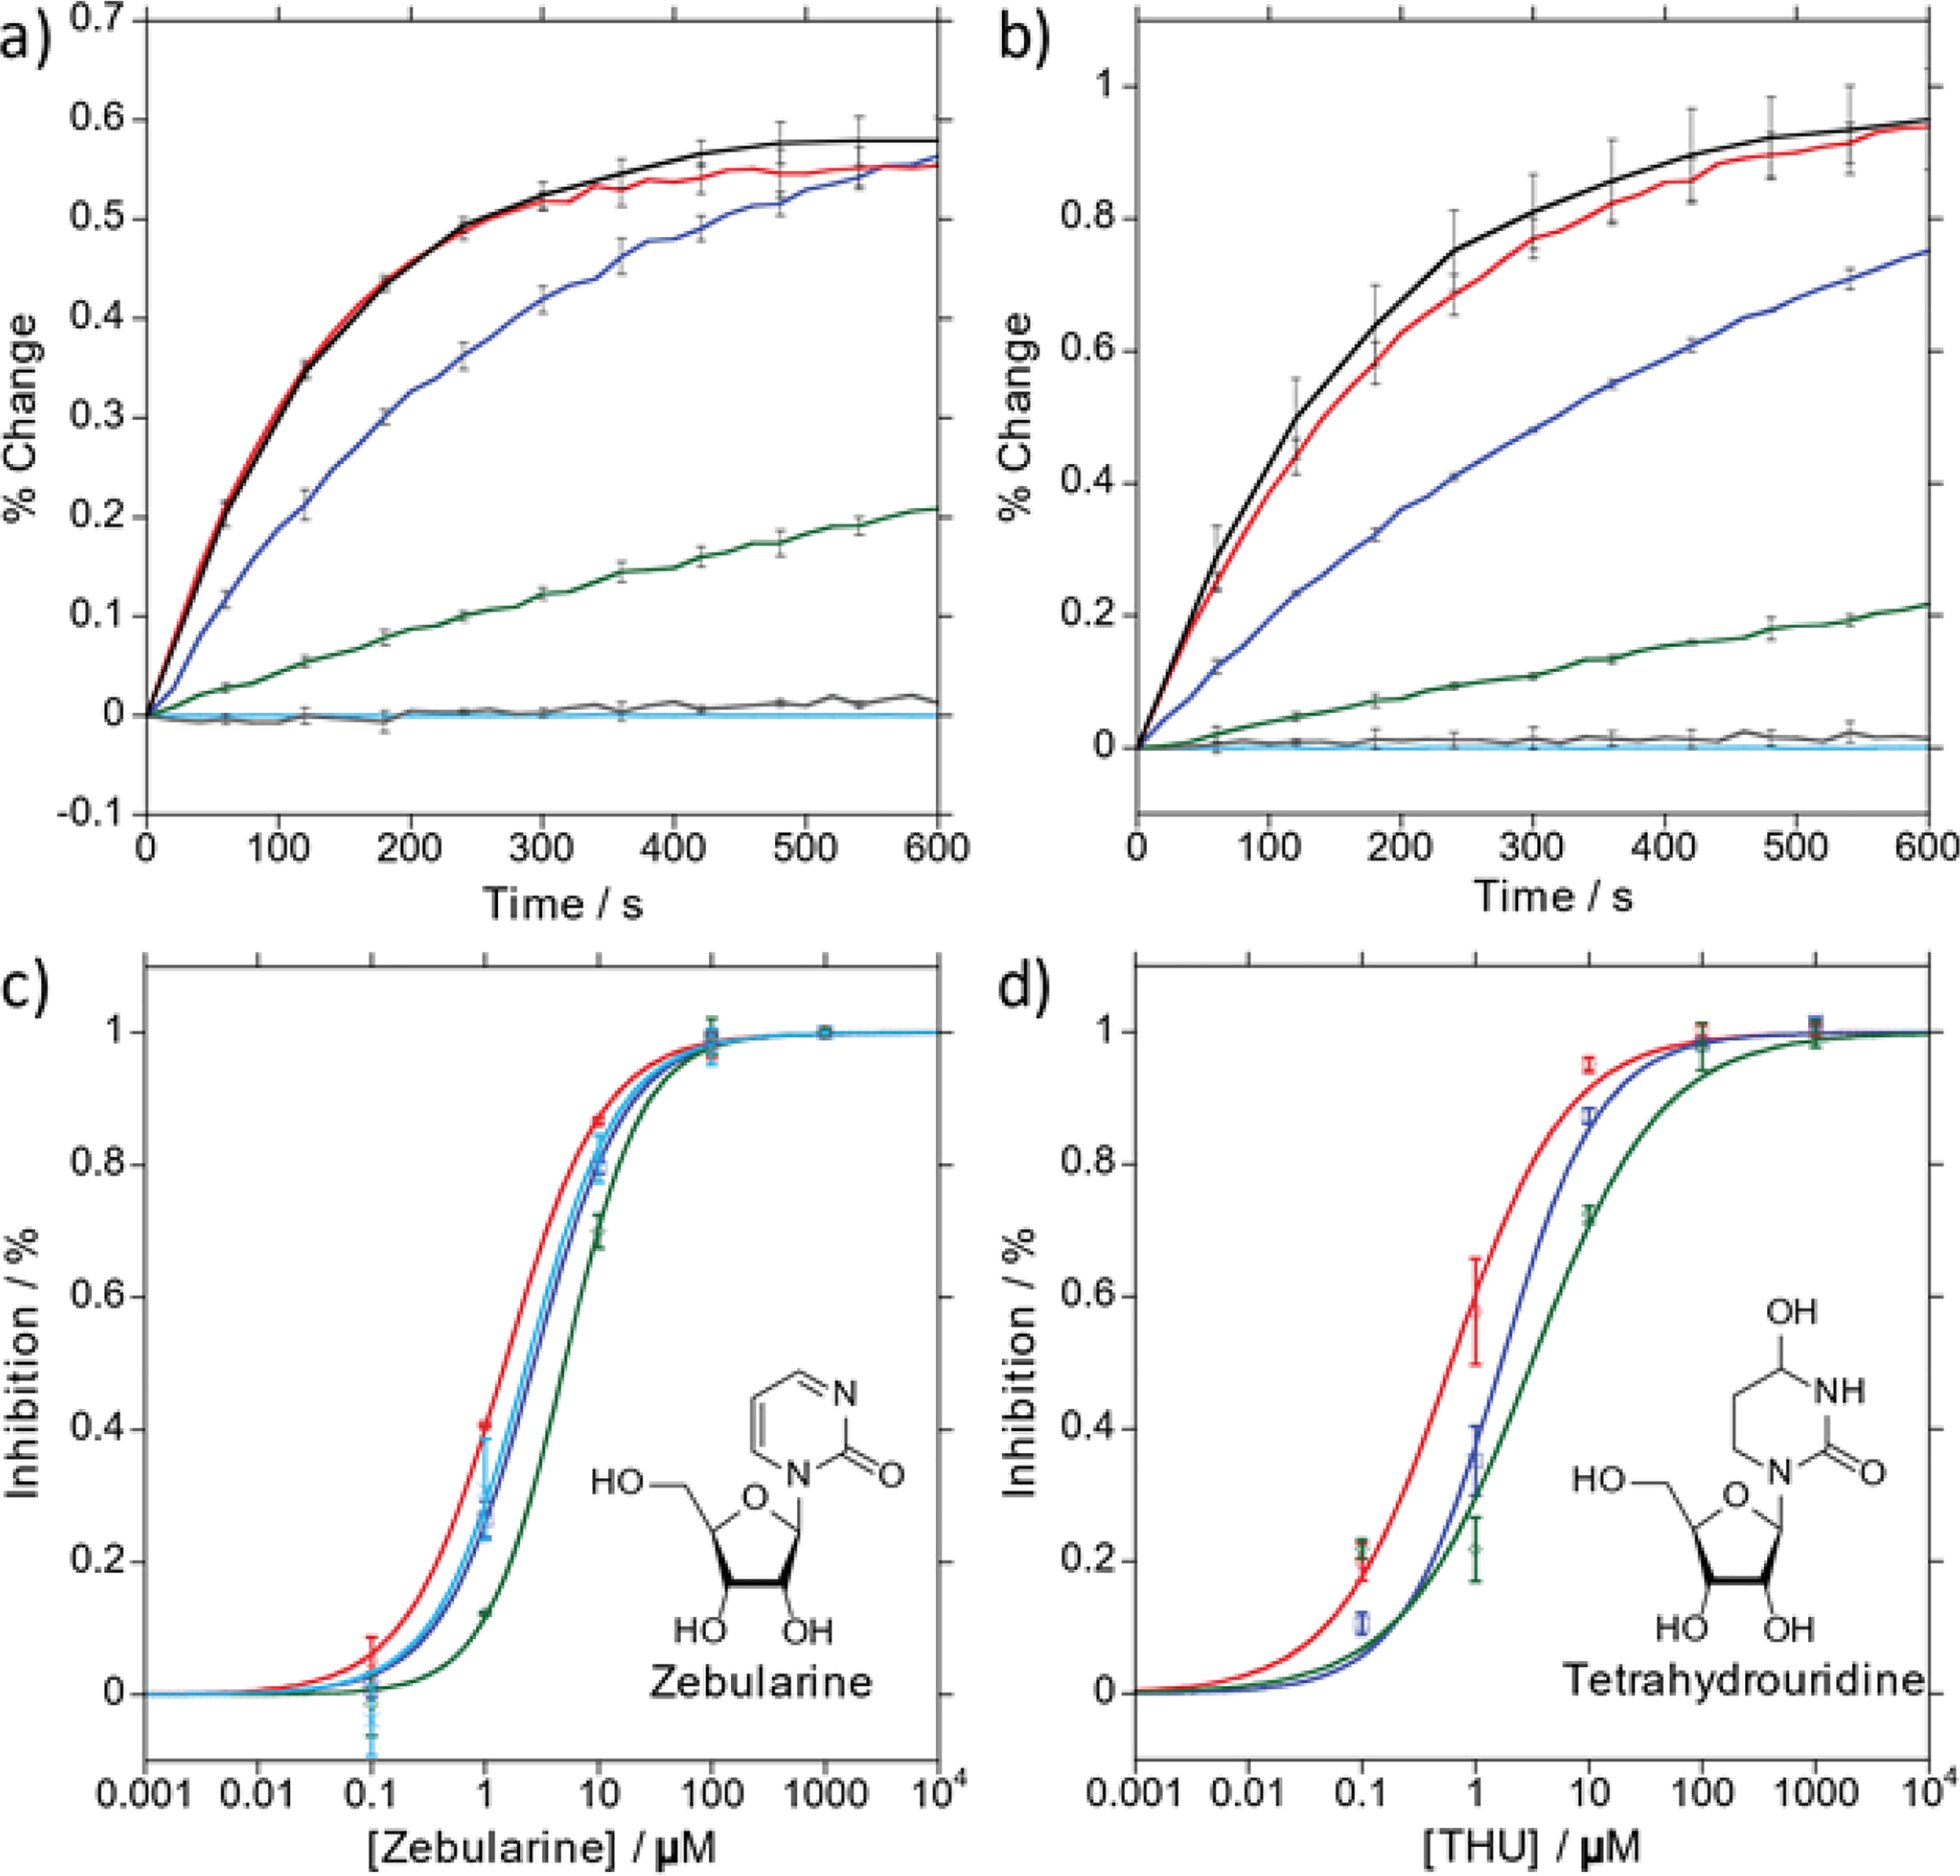
a, b) Conversion of thC to thU (a) and mthC to mthU (b) in the presence of various concentrations of Zebularine ([I] = 0 μM (black), 0.1 μM (red), 1 μM (blue), 10 μM (green), 100 μM (grey), 1 M (light blue). c, d) Semi-log plot of % inhibition in decimal form after 4 (thC) or 5 (tzC, mthC) minutes versus [Zebularine] (c) or [THU] (d) fit to a sigmoidal Hill curve: tzC (green), thC (blue), mthC (red), mthC with 100 μM Adenosine (light blue).
Conclusions
To explore the binding pocket of CDA, a new fluorescent C and U analogue pair, mthC and mthU, was synthesized (Scheme 1). The absorption and emission spectra were analyzed yielding extinction coefficients, Stokes shifts, and emission quantum yields. Upon reacting mthC and two previously synthesized C analogues, tzC and thC, with CDA we discovered that all three serve as viable substrates and, in fact, have shorter reaction half-lives than the native cytidine (Table 1). This confirmed our hypothesis that fusing additional aromatic rings onto the pyrimidine core may retain substrate viability by CDA. Further analysis indicated that the thieno- and isothiazolo-based analogs improved binding affinity and accelerated deamination rates while a methyl substitution onto the thiophene slightly diminished binding affinity (Table 1). We were also able to use tzC, thC, and mthC to establish three new templates for spectroscopy-based screening assays with zebularine and THU as model inhibitors (Fig. 4). As all three C and U analogues have red shifted absorption and emission spectra relative to the native cytidine and uridine, we submit these may be attractive alternatives for monitoring CDA activity and its inhibition as a foundation of screening campaigns.
Supplementary Material
Acknowledgements
We thank the National Institutes of Health for generous support (through grant GM 069773) and the Chemistry & Biochemistry MS Facility. We thank Dr. Milan Gembicky the UCSD X-ray Crystallography Facility for determining the crystal structure. We thank Dr. Anthony Mrse and the UCSD NMR Facility for assistance.
Footnotes
Conflicts of interest
There are no conflicts to declare.
Electronic Supplementary Information (ESI) available: [details of any supplementary information available should be included here]. See DOI: 10.1039/d1ob00705j
Notes and references
- 1.Micozzi D, Carpi FM, Pucciarelli S, Polzonetti V, Polidori P, Vilar S, Williams B, Costanzi S and Vincenzetti S, Int. J. Biol. Macromol, 2014, 63, 64–74. [DOI] [PMC free article] [PubMed] [Google Scholar]
- 2.Voorde JV, Vervaeke P, Liekens S and Balzarini J, FEBS Open Bio 2015, 5, 634–639. [DOI] [PMC free article] [PubMed] [Google Scholar]
- 3.Bjånes TK, Jordheim LP, Schjøtt J, Kamceva T, Cros-Perrial E, Langer A, de Garibay GR, Kotopoulis S, McCormack E and Riedel B, Drug Metab. Dispos, 2020, 48 (3), 153–158. [DOI] [PMC free article] [PubMed] [Google Scholar]
- 4.Bowen C, Wang S and Licea-Perez H, J. Chromatogr. B Anal. Technol. Biomed. Life Sci, 2009, 877 (22), 2123–2129. [DOI] [PubMed] [Google Scholar]
- 5.Lavelle D, Vaitkus K, Ling Y, Ruiz MA, Mahfouz R, Ng KP, Negrotto S, Smith N, Terse P, Engelke KJ, Covey J, Chan KK, DeSimone J and Saunthararajah Y, Blood, 2012, 119 (5), 1240–1247. [DOI] [PMC free article] [PubMed] [Google Scholar]
- 6.Cambi A, Vincenzetti S, Neuhard J, Costanzi S, Natalini P and Vita A, Protein Eng, 1998, 11 (1), 59–63. [DOI] [PubMed] [Google Scholar]
- 7.Teh AH, Kimura M, Yamamoto M, Tanaka N, Yamaguchi I and Kumasaka T, Biochemistry, 2006, 45 (25), 7825–7833. [DOI] [PubMed] [Google Scholar]
- 8.Chung SJ, Fromme JC and Verdine GL, J. Med. Chem, 2005, 48 (3), 658–660. [DOI] [PubMed] [Google Scholar]
- 9.Liu PS, Marquez VE, Kelley JA and Driscoll JS, J. Org. Chem, 1980, 45 (25), 5225–5227. [Google Scholar]
- 10.Marquez VE, Liu PS, Kelley JA, Driscoll JS and McCormack JJ, J. Med. Chem, 1980, 23 (7), 713–715. [DOI] [PubMed] [Google Scholar]
- 11.Kim CH, Marquez VE, Mao DT, Haines DR and McCormack JJ, J. Med. Chem, 1986, 29 (8), 1374–1380. [DOI] [PubMed] [Google Scholar]
- 12.McCormack JJ, Marquez VE, Liu PS, Vistica DT and Driscoll JS, Biochem. Pharmacol, 1980, 29 (5), 830–832. [DOI] [PubMed] [Google Scholar]
- 13.Ashley GW and Bartlett PA, J. of Biological Chemistry, 1984, 259 (21), 13621–13627. [PubMed] [Google Scholar]
- 14.Frick L, Yang C, Marquez VE and Wolfenden R, Biochemistry, 1989, 28 (24), 9423–9430. [DOI] [PubMed] [Google Scholar]
- 15.Funamizu N, Lacy CR, Fujita K, Furukawa K, Misawa T, Yanaga K and Manome Y, PLoS One, 2012, 7 (5), e37424. [DOI] [PMC free article] [PubMed] [Google Scholar]
- 16.Marquez VE, Barchi JJ, Kelley JA, Rao KVR, Agbaria R, Ben-Kasus T, Cheng JC, Yoo CB and Jones PA, Nucleosides, Nucleotides and Nucleic Acids, 2005, 24 (5–7), 305–318. [DOI] [PubMed] [Google Scholar]
- 17.Laliberte J, Marquez VE and Momparler RL, Cancer Chemotherapy and Pharmacology, 1992, 30, 7–11. [DOI] [PubMed] [Google Scholar]
- 18.Okamura T and Kigasawa K, Prenat. Diagn, 1994, 14 (3), 213–218. [DOI] [PubMed] [Google Scholar]
- 19.Sherwood RA, Biomed. Chromatogr, 1991, 5 (6), 235–239. [DOI] [PubMed] [Google Scholar]
- 20.Dutta PK, Shanley MS and O’Donovan GA, J. Chromatogr. A, 1990, 512 (C), 395–401. [DOI] [PubMed] [Google Scholar]
- 21.Chabner BA, Drake JC and Johns DG, Biochem. Pharmacol, 1973, 22 (21), 2763–2765. [DOI] [PubMed] [Google Scholar]
- 22.Wentworth DF and Wolfenden R, Biochemistry, 1975, 14 (23), 5099–5105. [DOI] [PubMed] [Google Scholar]
- 23.Frances A and Cordelier P, Mol. Therapy, 2020, 28 (2), 357–366. [DOI] [PMC free article] [PubMed] [Google Scholar]
- 24.Sinkeldam RW, Greco NJ and Tor Y, Chem. Rev, 2010, 110, 2579–2619. [DOI] [PMC free article] [PubMed] [Google Scholar]
- 25.Shin D, Sinkeldam RW and Tor Y, J. Am. Chem. Soc, 2011, 133 (38), 14912–14915. [DOI] [PMC free article] [PubMed] [Google Scholar]
- 26.Rovira AR, Fin A and Tor Y, J. Am. Chem. Soc, 2015, 137 (46), 14602–14605. [DOI] [PMC free article] [PubMed] [Google Scholar]
- 27.Rovira AR, Fin A and Tor Y, Chem. Sci, 2017, 8, 2983–2993. [DOI] [PMC free article] [PubMed] [Google Scholar]
- 28.See supporting information.
- 29.Sinkeldam RW, McCoy LS, Shin D and Tor Y, Angew. Chem. Int. Ed, 2013, 52, 14026–14030. [DOI] [PMC free article] [PubMed] [Google Scholar]
- 30.Rovira AR, Fin A and Tor Y, J. Am. Chem. Soc, 2017, 139, 15556–15559. [DOI] [PMC free article] [PubMed] [Google Scholar]
- 31.Hallé F, Fin A, Rovira AR and Tor Y, Angew. Chem. Int. Ed, 2017, 57, 1087–1090. [DOI] [PMC free article] [PubMed] [Google Scholar]
- 32.Ludford III PT, Rovira AR, Fin A and Tor Y, ChemBioChem, 2019, 20, 718–726. [DOI] [PMC free article] [PubMed] [Google Scholar]
- 33.Li Y, Ludford III PT, Fin A, Rovira AR and Tor Y, Chem. Eur. J, 2020, 26, 6076–6084. [DOI] [PMC free article] [PubMed] [Google Scholar]
- 34.Ashyraliyev M, Fomekong-Nanfack Y, Kaandorp JA, and Blom JG, FEBS Journal, 2009, 276, 886–902. [DOI] [PubMed] [Google Scholar]
- 35.Kutalik Z, Cho K-H, Wolkenhauer O, BioSystems, 2004, 75, 43–55. [DOI] [PubMed] [Google Scholar]
- 36.Hoops S, Hontecillas R, Abedi V, Leber A, Philipson C, Carbo A, and Bassaganya-Riera J, in Computational Immunology: Models and Tools, ed. Bassaganya-Riera J, Academic Press, 2016, ch. 5, 63–78. [Google Scholar]
Associated Data
This section collects any data citations, data availability statements, or supplementary materials included in this article.


