

Abstract
Melanoma is derived from melanocytes, which are located in multiple regions of the body. Cutaneous melanoma (CM) represents the major subgroup, but less common subtypes including uveal melanoma (UM), mucosal melanoma (MM), and acral melanoma (AM) arise with distinct genetic profiles. Effective treatments for CM are ineffective in UM, AM, and MM, and patient survival remains poor. As reprogrammed cancer metabolism is associated with tumorigenesis, the underlying mechanisms are well studied and provide therapeutic opportunities in many cancers; however, metabolism is less well studied in rarer melanoma subtypes. Here, we summarize current knowledge of the metabolic alterations in rare melanoma and potential applications of targeting cancer metabolism to improve therapeutic options available to UM, AM or MM patients.
Keywords: metabolism, uveal, mucosal, acral melanoma
Introduction
Melanoma arises from the aberrant growth of melanocytes and is categorized as cutaneous melanoma (CM), uveal melanoma (UM), mucosal melanoma (MM) or acral melanoma (AM) based on tissue location of the primary tumor [1]. Due to their low incidence rates, UM (5% of all melanomas), MM (1% of all melanoma) and AM (2-3% of all melanomas) are classified as rare subtypes of melanoma [2]. Sequencing of primary and metastatic tumors has led to a better understanding of their subtype-specific genomics (Table 1). Therapies that have proven effective in CM, including BRAF and MEK inhibitors and immune checkpoint antibodies, have not shown promising results in rarer melanoma [2, 3]. New approaches are needed to deepen our knowledge of the etiology of rare melanomas and to devise therapeutic options for the patients.
Table 1.
Features of rare melanoma subtypes
| UM | MM | AM | |
|---|---|---|---|
| Tissue location | Uveal tract including the choroid, iris, and ciliary body of the eye | Mucosal tissues including head, neck, anorectal, genital, and GI tract | Glabrous skin including palms, soles, and nail beds |
| Incidence rate (% of all melanomas) | 5% | 2% | 2-3%* |
| Mutational burden (compared to CM) | Low | Low | Low |
| Genetic alterations | GNAQ/11, BAP1, SF3B1, EIF1AX, CYSTLR2, PLCβ4, | BRAF, NRAS, NF1, KIT, CDKN2A, TP53, PTEN, CDK4, CCND1, RB1 | BRAF, NRAS, NF1, KIT, CDKN2A, TP53, PTEN, CDK4, CCND1, RB1 |
| Current therapeutic options | • Targeted inhibitors including MEK1/2 and ERK1/2 • HDAC inhibitor • Immunotherapies including anti-PD-1 and CTLA-4 |
• Targeted inhibitors including c-Kit and multi-kinase inhibitor • Immunotherapies including anti-PD-1 and CTLA-4 |
• Targeted inhibitors including CDK4 and CDK6 • Immunotherapies including anti-PD-1 and CTLA-4 |
CM, cutaneous melanoma; UM, uveal melanoma; AM, acral melanoma; MM, mucosal melanoma; GI tract, gastrointestinal tract; GNAQ/11, guanine nucleotide-binding protein Gq subunit α/11; BAP1, BRCA1-associated protein; SF3B1, splicing factor 3B, subunit 1; EIF1AX, eukaryotic translation initiation factor 1A, X-linked; CYSTLR2, cysteinyl leukotriene receptor 2; PLCβ4, phospholipase C β4; BRAF, brain rapidly accelerated fibrosarcoma; NF1, neurofibromin 1; CDKN2A, cyclin-dependent kinase inhibitor 2A; PTEN, phosphatase and tensin homolog; CDK4, cyclin-dependent kinase 4.
Incidence rate in European-descent populations
Reprogrammed cellular metabolism contributes to cancer progression, and its targeting represents an emerging therapeutic strategy [4, 5]. By reprogramming metabolism, cancer cells meet increased bioenergetic and biosynthetic needs and maintain redox balance [6]. An accurate understanding of tissue-specific metabolism is important, since the cellular composition and physiological responses to metabolic perturbation will differ across tissues [4]. Indeed, the tissue of origin and environment of a cancer, rather than its individual oncogenic mutations, are often a better predictor of its metabolic state [7]. In CM, hypoxia-induced factor-1α (HIF1α) is constitutively activated in both normal and hypoxic conditions [8] and increased glycolysis is observed [9]. For more in depth coverage of CM and metabolism, we refer readers to Fischer and colleagues’ review [10]. The metabolic features of UM, MM and AM are distinct from CM due to their different sites of tumor initiation and genetics. The primary goals of this review are to summarize current findings on the cellular metabolism in rare melanomas, to provide new insights into the field, and to propose that cancer metabolism can be exploited to improve the therapeutic options for the patients.
Uveal melanoma (UM)
UM is the most common eye cancer in adults [11]. Primary tumors can be successfully treated by plaque radiotherapy and/or surgery; however, ~ 50% of UM patients develop highly aggressive tumors [12]. While activating mutations in G-protein coupled receptor pathway genes (GNAQ/GNA11) are considered to be initiators of UM [13, 14], inactivating mutations in BRCA1-associated protein 1 (BAP1) are associated with UM metastasis [15].
Metabolism in normal choroidal melanocytes (NCM) versus UM:
The uveal tract plays an important physiological role in nutrient and gas exchange to support the metabolic requirements of the eye. Landreville and colleagues found that NCM grow faster under hypoxic conditions that mimic normal physiological oxygen conditions (3% O2) compared to traditional tissue culture conditions at 21% O2 [16]. Growth of NCM in hypoxic conditions let to upregulated monocarboxylate transporter (MCT4) gene expression. The export of lactate by MCT4 is important for maintaining continuous ATP production from glycolysis under anaerobic conditions [17]. These observations imply that NCM are likely to rely on increased glucose utilization and lactate production for proliferation. In contrast, UM cells grow slower in hypoxic conditions despite significant upregulation of MCT4 expression, which implies that upregulated MCT4 expression might play distinct roles in cell growth between NCM and UM cells.
UM cells display upregulated expression of genes associated with nutrient storage and differential expression of genes associated with distinct metabolic processes compared to NCM [18]. NCM showed upregulated expression of genes involved amino acid/peptide metabolism, glycogen metabolism, and cholesterol metabolism. In contrast, UM cells exhibit elevated gene expression involving glycolysis, TCA cycle and mitochondrial respiration. These results are consistent with a recent report that UM patients have significantly increased gene expression profiles affecting mitochondrial respiration and NAD+ metabolism compared to healthy individuals [19]. Additionally, UM is characterized by significantly altered gene expression profiles in the TCA cycle and carbohydrate metabolic pathways [20].
Analysis of short-term cultured primary NCM and UM cells [21] showed that the NCM secretome has higher amounts of amino acid/peptide and glycogen metabolism. In contrast, the UM secretome included 5’-nucleotidase, and fatty acid synthase. UM cells also featured a downregulation of the unfolded protein response (UPR) compared to NCM [21]. The UPR pathway is an adaptive mechanism that responds to endoplasmic reticulum (ER) stress [22], and abnormal regulation of ER stress and oxidative stress is associated with tumorigenesis [23]. The observed downregulation of UPR pathways in UM cells raises the possibility of the involvement of these pathways in UM pathology. Consistent with this idea, NCM showed increased secretion of proteins involved in antioxidant mechanisms, including glutathione reductase compared to UM cells [21].
Compared to NCM, UM cells also contain significantly decreased levels of nuclear vitamin D receptor (VDR) [24]. Vitamin D exerts anti-tumor effects through VDR [25]; therefore, dysregulation of vitamin D metabolism is associated with tumorigenesis and poor clinical outcomes [26]. For example, CM patients with lower VDR expression showed reduced overall survival [27]. A better understanding of the exact role of vitamin D metabolism in UM biology might encourage the development of novel adjuvant therapies, including vitamin D derivatives for UM patients, which have already been applied in other cancers [28].
Glucose metabolism and insulin resistance:
UM cells appear to have elevated glucose utilization [16, 18]. According to 18F-fluorodeoxyglucose positron emission/computed tomography (PET/CT) nuclear imaging, UM tumors display high glycolytic activity [29, 30]. Metabolic tumor volume and total glycolytic activity were negatively correlated with overall survival of UM patients [30]. A higher total glycolytic activity measurement was linked to reduced median overall survival of patients. In conclusion, UM is metabolically more active than the tissue it arises from and this heightened metabolic state might exert critical effects on UM pathobiology and clinical outcomes.
Increased glycogen metabolism has been observed in various cancer cell lines, where it is thought to contribute to tumor growth [31]. Although UM shows elevated glucose utilization [29, 30], cells seem to have lower anabolic glycogen metabolism compared to NCM [18, 21]. Furthermore, monosomy 3 UM (high metastatic risk) has a lower gene expression profile related to glycogen synthesis and amount of glycogen in tumor tissues, which are strongly associated with poor patient survival [32]. These results indicate that downregulated glycogen metabolism might be UM-specific metabolic characteristics compared to other cancer types and contribute to UM pathology and metastasis.
Insulin and adiponectin are critical hormones for the cellular glucose regulation. Compared to healthy individuals, UM patients exhibit insulin-resistant features, including higher levels of serum insulin, fasting plasma glucose, and lower adiponectin levels [33]. Moreover, metastatic UM patients have much lower adiponectin levels compared to non-metastatic UM patients [33]. Consistently, metastatic and monosomy 3 UM tumors exhibited higher gene expression involved in insulin-resistant and insulin secretion pathways than observed in non-metastatic and non-monosomy 3 UM tumors [32, 34]. Although it is unclear whether UM development leads to altered insulin and adiponectin levels, or conversely whether altered insulin and adiponectin levels promote UM development, these observations nevertheless suggest that UM is closely associated with insulin-resistant metabolism.
Mitochondrial metabolism:
UM is associated with alterations in mitochondrial metabolism including the TCA cycle [20, 21]. UM displays the highest median oxidative phosphorylation (OXPHOS) gene expression level among numerous cancers analyzed [35] and several observations indicate that elevated mitochondrial metabolism may be associated with metastatic risk of UM.
MacroH2A1, a histone variant is highly upregulated in metastatic UM compared to non-metastatic UM [36], and plays a key role in UM mitochondrial metabolism [19]. Knockdown of macroH2A1 in UM cells impaired mitochondrial metabolism by repressing the expression of genes related to OXPHOS and mitochondrial biogenesis. Furthermore, metastatic UM tumors show upregulated expression of these genes compared to non-metastatic UM tumors, emphasizing the potential link between increased mitochondrial metabolism and metastasis.
Succinate dehydrogenase A (SDHA) is a member of complex II of the electron transport chain (ETC). Monosomy 3 UM cells have more active mitochondria and a higher mitochondrial reserve capacity than disomy 3 or isodisomy 3 UM cells, both of which are associated with low metastatic risk [35]. Monosomy 3 UM also has increased gene expression of ETC complex II genes and SDHA compared to non-monosomy 3 UM. Monosomy 3 UM cells were resistant to OXPHOS inhibitor, but SDHA knockdown significantly increased UM cell sensitivity [35]. Taken together, the above findings indicate that reprogramming of the mitochondrial metabolism may play a role in UM metastasis.
Amino acids and lipid metabolism:
Abnormalities of urea cycle have been proposed to drive cancer cell proliferation [37] and glycerolipid metabolism is involved in energy storage and membrane formation [38]. Compared to non-metastatic UM tumors, metastatic UM tumors display enhanced gene expression in amino acid metabolism, including D-arginine, and D-ornithine, and in lipid metabolism, including glycerolipid and fatty acid metabolism [34], indicating associations with UM metastasis.
Cultured UM cells in multicellular spheroids (MCS-UM) display anoikis resistance [39]. Anoikis is a form of programmed cell death caused by detachment from the extracellular matrix, and resistance to anoikis is a critical characteristic of disseminated cancer cells [40]. The biochemical characteristics of MCS-UM were compared to adherent cultured UM cells and primary UM tumor samples [39]. MCS-UM cells have elevated gene expression profiles in lipid metabolism and free radical scavenging pathways compared to UM patient samples. They also showed higher gene expression profiles in lipid and carbohydrate metabolism relative to adherent cultured UM cells. Interestingly, the specific patterns of lipid metabolism gene expression observed in the MCS-UM cells were different from both adherent cells and tumor samples [39]. Compared to UM tumor samples, gene expression involved in fatty acid oxidation were increased in MCS-UM. In contrast, compared to the adherent cultured UM cells, gene expression profiles related to fatty acid and cholesterol synthesis were upregulated. These results raise the possibility that UM cells alter their metabolism toward lipogenesis during anchorage-independent growth, and this metabolic alteration may promote the growth of circulating UM cells, thus elevating metastatic risk.
Hypoxia and oxidative stress:
Under hypoxic conditions, tumor cells stabilize HIF1α protein expression, triggering alterations of cellular metabolism [41]. Monosomy 3 and BAP1 null UM tumors exhibit significantly higher HIF1α mRNA expression compared to disomy 3 and wild-type BAP1 expressing UM tumors [42, 43]. Interestingly, more refined subtyping of UM tumors according to their transcriptional regulatory profiles revealed that HIF1α expression was significantly higher in one subgroup within the monosomy 3 class of UM tumors [44]. These findings imply that HIF1α-dependent metabolic remodeling within monosomy 3 UM tumors, may be heterogeneous and independent of oxygen levels, which might consequently induce different metastatic potentials. Furthermore, BAP1 mutant UM contains metabolic heterogeneity based on OXPHOS gene signatures [45].
Impairment of the reactive oxygen species (ROS) scavenger system results in oxidative stress, which plays critical roles in tumorigenesis [46] and certain ocular diseases [47, 48]. Although little is known about oxidative stress and defense mechanisms to counteract it in UM cells, studies have demonstrated that ROS levels and expression of ROS signaling-related genes are significantly elevated in retinoblastoma [49, 50]. These studies suggest that eye tissues are capable of activating defense mechanisms against oxidative stress, which may also contribute to UM pathology. In fact, a recent study found that a VEGF antagonist exerts preventive effects against oxidative stress induced by ionizing radiation in UM cells [51], providing direct evidence for the potential role of ROS signaling pathways in UM pathobiology.
Therapeutic potentials of metabolic inhibitors in UM:
While the therapeutic potential of targeting cell metabolism has been explored in pre-clinical and clinical studies involving various cancer types [52], there are few pre-clinical results regarding the efficacy of metabolic inhibitors in treating UM. It has been shown that there is metabolic heterogeneity within BAP1 mutant UM tumors based on their OXPHOS gene signatures [45]. OXPHOS-high BAP1 mutant UM displays upregulated glucose utilization and nucleotide synthesis, while OXPHOS-low BAP1 mutant UM depends on fatty acid oxidation. Promisingly, selective metabolic inhibitors that target different metabolic pathways were able to significantly suppress cell growth of both of these BAP1 mutant UM subtypes. Additionally, UM cells manifested significantly reduced cell viability with an OXPHOS inhibitor [35].
A discouraging aspect of targeted therapies is development of drug resistance, which can be partially explained by metabolic adaptation. CM that are resistant to BRAF and MEK inhibitors displayed increased OXPHOS levels [53, 54]. UM tumors showed MEK inhibitor resistance and high tolerance to CDK4/6 inhibitor [55]. Both MEK inhibitor resistant- and CDK4/6 inhibitor-tolerant UM cells had increased OXPHOS [55]. Encouragingly, the addition of an OXPHOS inhibitor significantly improved the efficacy of MEK and CDK4/6 inhibitors in UM [55]. These observations indicate that targeting cell metabolism can exploit potential vulnerability of UM and drug-resistant UM and might therefore serve as a useful approach for the development of more effective UM therapies.
Mucosal melanoma (MM)
MM is the rarest subtype of melanoma (1% of all cases) but typically has a poorer prognosis than CM [2, 56]. MM shows relatively lower levels of single nucleotide mutations but has more chromosomal abnormalities and genomic DNA amplifications compared to CM [57, 58]. Amplification of the KIT locus in MM (~25%) is more prevalent than in CM (~10%) [1]. It is difficult to evaluate the efficacy of targeted therapies and immunotherapies in MM because of the relatively limited number of studies and lack of consensus results for this melanoma subtype [2].
Glucose metabolism:
As is the case with UM, elevated glucose uptake is associated with reduced MM patient survival. High maximum standard glucose uptake levels are markedly associated with poor overall survival for MM [59]. Also, MM patients with higher glucose uptake show significantly shorter time-to-progression [60] and metastatic MM patients show significantly higher lactate dehydrogenase levels [61], which are generally elevated in glycolytic tumors [62]. Interestingly, KIT mutations were associated with metabolic response of MM [60]. KIT mutant MM is characterized by more highly progressive metabolic respond than KIT wild-type MM. As with UM, MM is also a metabolically active melanoma tumor subtype and elevated glucose metabolism may be correlated with aggressiveness in MM. The findings regarding KIT mutations also highlight the potential involvement of MM-specific genetic changes in reprogramming the cellular metabolism of MM cells.
Mitochondrial metabolism:
An imbalance of mitochondrial fission and fusion lead to defects in mitochondrial number and function, resulting in abnormal mitochondrial activity and tumorigenesis [63]. Expression of several mitochondrial proteins were elevated in CM, oral MM, and sinonasal MM compared to normal adjacent tissue regions [63]. Moreover, MM tissues showed higher mitochondrial contents relative to CM, which was linked to an increased risk of nodal metastasis of oral MM [63]. In oral MM, mitochondrial fission protein 1 (FIS1) and dynamin-related protein 1 (DRP1) expression were significantly elevated, whereas sinonasal MM displayed mitofusin-2 (MFN2) overexpression. The expression of mitochondrial fission and fusion markers was higher in advanced stages of both oral and sinonasal MM [63]. These findings suggest that mitochondrial defects might cause an abnormal mitochondrial metabolism that underlies the metastatic progression of MM tumors.
Other metabolic processes:
Fatty acid synthase (FASN) is an enzyme of de novo lipogenesis and its overexpression has been reported in multiple cancers [64]. FASN expression was significantly upregulated in oral MM compared to oral nevi, although did not vary according to the tumor invasion level [65]. These results imply that oral MM might feature upregulated lipogenesis that may be associated with oral MM development and metastasis. These findings suggest that distinct potential metabolic vulnerabilities might exist for oral MM, an issue that requires further investigation.
Acral melanoma (AM)
AM is a particularly aggressive melanoma subtype, resulting in a very high 10-year mortality (88%), which is significantly worse than that of CM (68%) [66]. In European-descent populations, the incidence of AM is 2-3%, but in countries such as Singapore, AM can represent almost half of melanoma cases [67]. Similar to MM, AM also displays distinct genetics compared to CM, including higher relative levels of chromosomal aberrations. BRAF mutations are less frequent (~35%) than in CM (~50%), but genomic amplification of CCND1 (~54% vs ~13%) [1] and mutation and amplification of KIT (~36% vs ~10%) are more frequently observed in AM [1]. Currently, there are no FDA-approved therapeutic options for AM patients [2].
Low expression of the AMPK-associated kinase NUAK2 was linked to longer relapse-free survival of AM patients and NUAK2 depletion decreased cell migration in vitro and melanoma tumor growth in vivo [68]. AMPK-associated kinases play a pivotal role in cellular metabolism [69]. Whether metabolic alterations depend on NUAK2 expression remains to be clarified but the findings nevertheless suggest that functionally significant changes in cellular metabolism might be associated with progression and clinical outcomes of AM.
Conclusion and future directions
The genetic landscapes of rare melanoma have been well defined [58, 70, 71]; however, effective treatment options for rare melanoma patients are still not available. By summarizing current findings on the role of cellular metabolism of UM (Figure 1), MM (Figure 2), and AM, we aim to provide a new perspective to the field and highlight potentially productive areas for future research and clinical translation (see Outstanding Questions).
Figure 1. Summary of UM cellular metabolism.
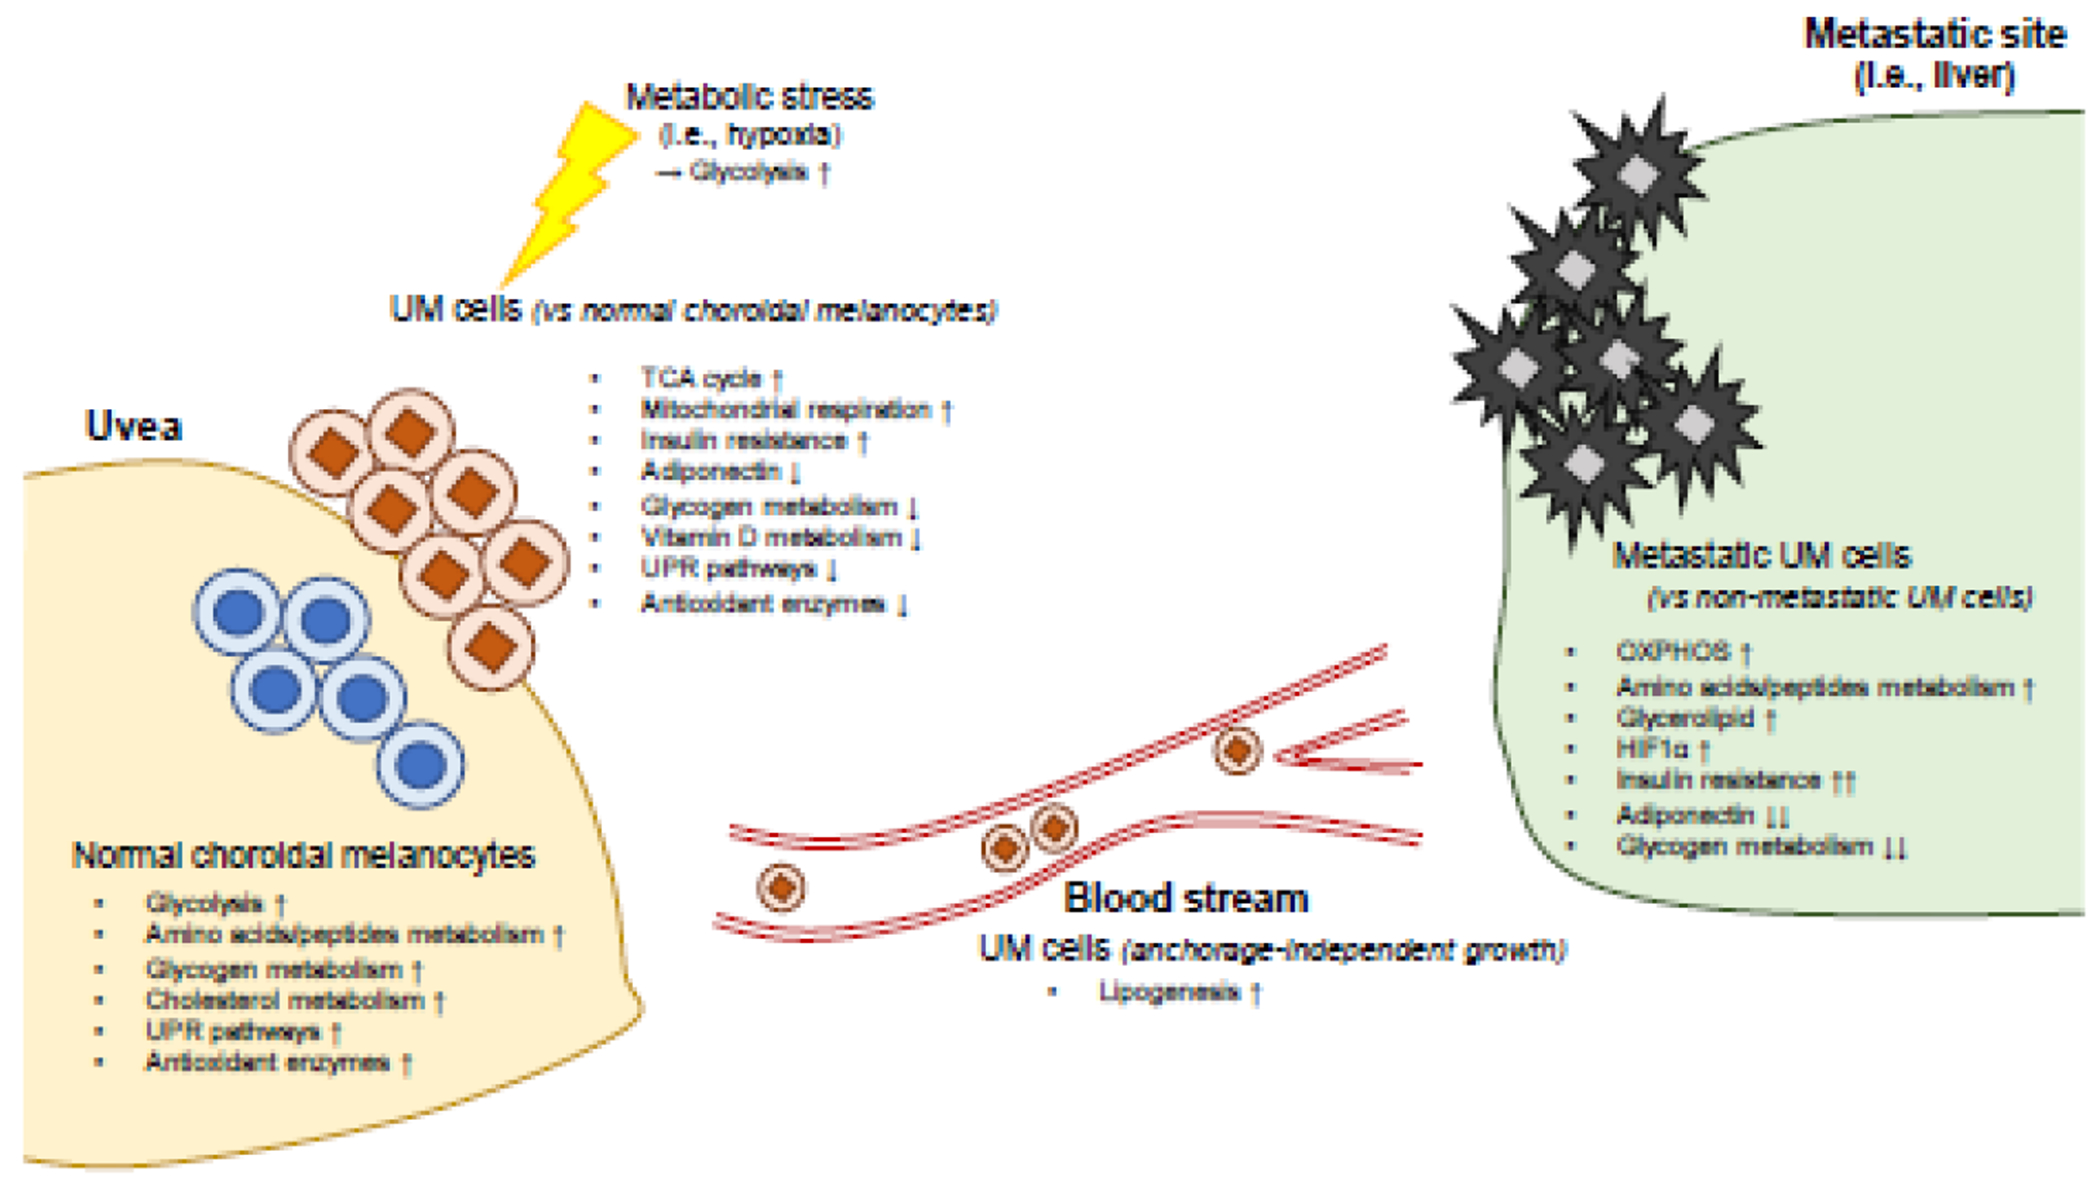
Based on gene expression profiling, normal choroidal melanocytes (NCM) and UM cells differ in several key aspects of cellular metabolism. For instance, UM cells utilize glycolysis under metabolic stress (i.e., hypoxia) to survive, while NCM metabolizes glucose to proliferate. Compared to non-metastatic UM cells, metastatic UM cells exhibit upregulated OXPHOS, glycerolipid metabolism, and reduced glycogen metabolism. Anchorage-independent UM cells display lipogenic phenotypes. UPR, unfolded protein response; OXPHOS, oxidative phosphorylation; HIF1α, hypoxia-induced factor-1α.
Figure 2. Summary of MM cellular metabolism.
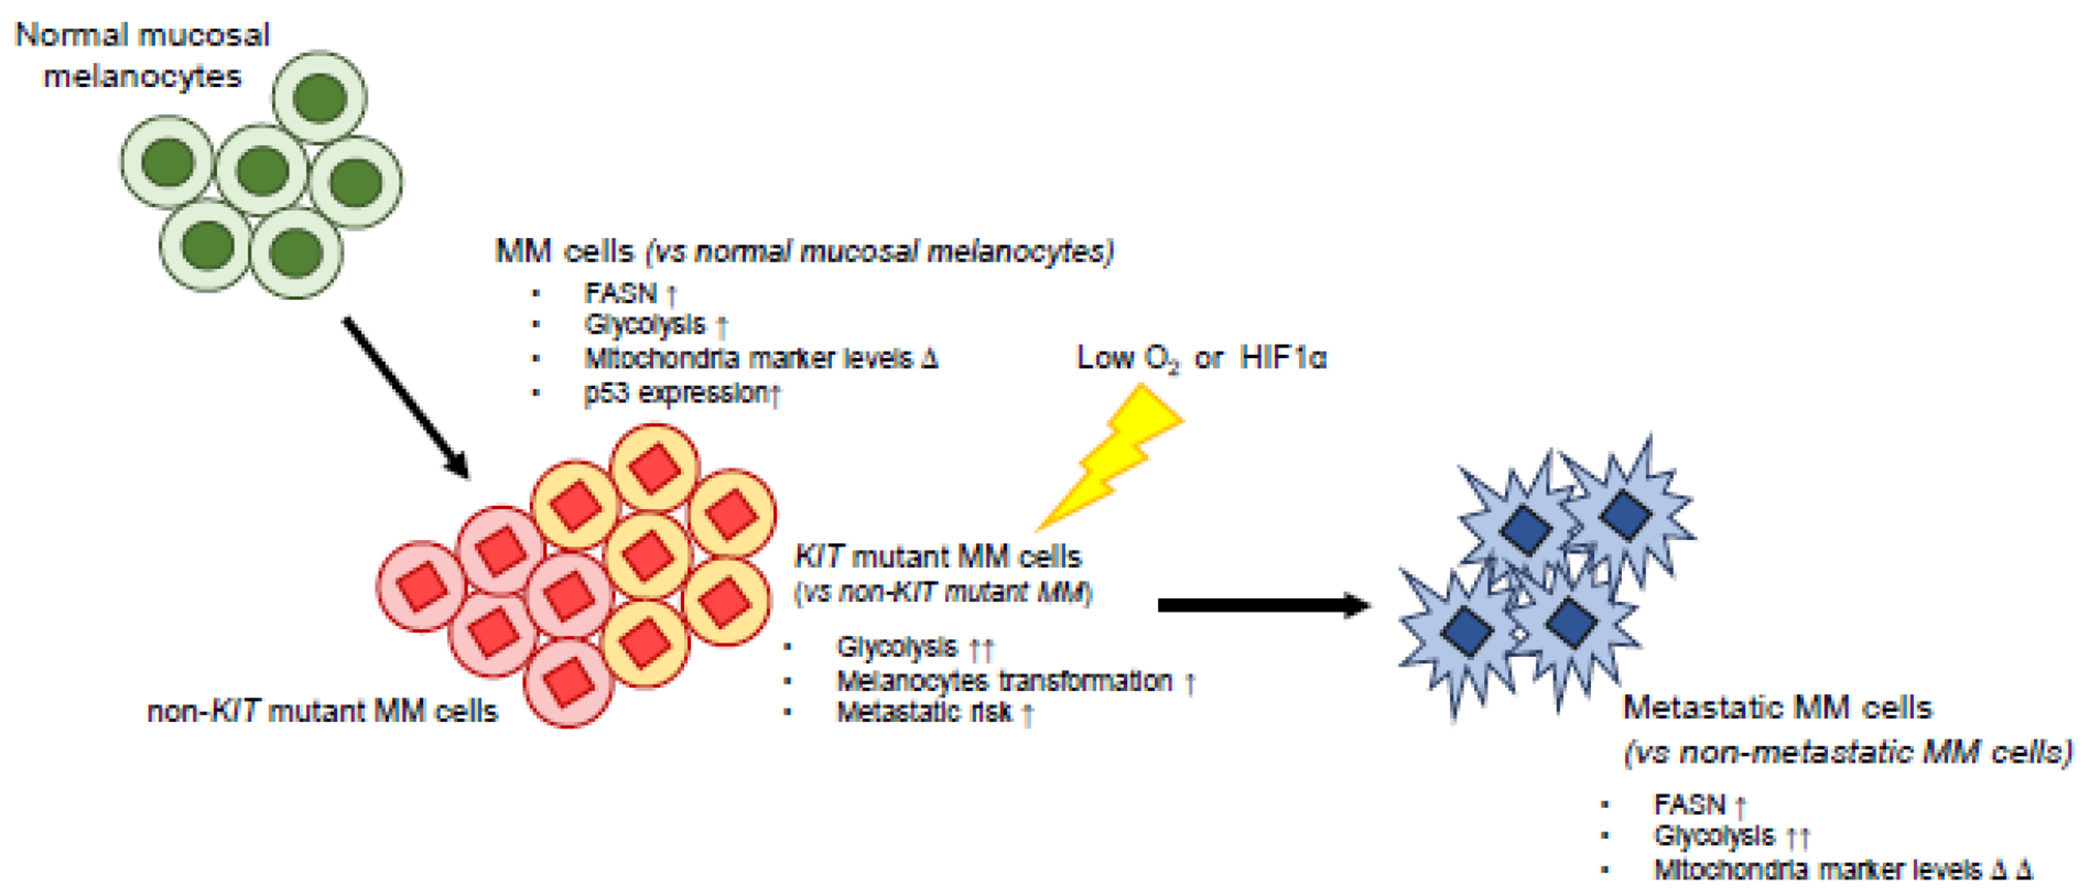
Compared to normal mucosal melanocytes, MM cells have higher FASN expression and show a glycolytic phenotype and altered mitochondria marker expression that might reflect mitochondrial dysfunction. These characteristics of MM cells are reinforced in metastatic MM cells. KIT mutations result in elevated glycolysis and the induction of melanocyte transformation under hypoxic conditions. Δ, change; FASN, fatty acid synthase; HIF1α, hypoxia-induced factor-1α.
Outstanding Questions.
Which metabolites and metabolic pathways are remodeled in each rare melanoma subtype?
What is the role of rare melanoma-specific genetic alterations and/or chromosomal abnormalities in their metabolic alterations?
Does cellular metabolism is responsible for metastasis of rare melanoma subtypes and organ tropism of UM?
Can we target rare melanoma-specific altered metabolism to benefit therapeutic options for the patients?
Most investigations of rare melanoma and cellular metabolism have been based on gene and protein expression profiling, and pathway analyses using cell lines, patient tumor samples, and The Cancer Genome Atlas (TCGA) database [18, 32, 34, 63, 68]. Technological advances in metabolomics and metabolic flux analysis now allow a more precise understanding of cancer metabolism, which will help to understand the metabolic phenotypes of each rare melanoma subtype. In the tumor microenviroment, the competition for nutrients between cancer cells and stromal cells, including immune cells, can alter immunotherapy responses [72, 73]. Metabolic profiling might therefore prove to be informative for resolving drug resistance and/or poor outcomes of immunotherapies for rare melanoma by identifying possible metabolic adaptations arising from current therapeutic regimens.
There are metabolic differences between normal melanocytes and cells from rare forms of melanoma (Figure 1 and 2) and finding the causes of these differences will be critical. Some metabolic alterations are the result of oncogene activation and/or tumor suppressor inactivation[74]. KIT mutations, for example, are more frequently observed in AM (~36%) and MM (~25%) compared with CM (~10%) (Table 1) [1]. KIT mutations activate a unique mechanism for melanocyte transformation [75]. Specifically, hypoxic conditions induce accelerated activation of the Ras/Raf/MAPK pathway in KIT mutant melanocytes, promoting proliferation and transformation (Figure 2) [75]. KIT mutations have also been associated with increased glucose utilization of MM cells [60]. Furthermore, MM displays elevated p53 expression (Figure 2) [76] and aberrant p53 levels are associated with remodeling of cancer cell metabolism [77]. These findings suggest that AM and MM-specific genetic alterations trigger functionally significant changes in cellular metabolism, emphasizing the importance of further delineating the causal links between specific genetic lesions and reprogrammed cell metabolism in future MM and AM research.
In UM, the effects of GNAQ/GNA11 mutations on downstream signaling pathways have been intensively studied, whereas the potential effects of GNAQ/GNA11 mutations on UM metabolism have not yet been investigated. Metabolic features of monosomy 3 UM and/or BAP1 null UM differ from those of cells from non-monosomy 3 and/or wild-type BAP1 UM [32, 35, 42, 43]. However, the detailed mechanisms of how BAP1 status contributes to these metabolic differences have not yet been studied. Recently, BAP1 functions in cellular metabolism have been emphasized [78]. Several metabolic genes are located on chromosome 3, which is frequently deleted in UM. For instance, the glycogen synthase kinase 3B enzyme (GSK3β) is located on 3q13.33 [32]. Future studies are required to understand the association between UM-specific genetic alterations and chromosomal abnormalities and their effects on reprogramming of cellular metabolism in rare melanoma.
Most rare melanoma-associated deaths are attributable to metastasis [79] and understanding these mechanisms is essential to devise new treatments. During metastatic progression, tumor cells undergo metabolic reprogramming to survive and maintain their metastatic properties [80]. For example, invasive breast tumor cells upregulate their OXPHOS metabolism [81]. Metastatic UM also exhibits increased gene expression affecting mitochondrial metabolism compared to non-metastatic UM [19, 35] Additionally, the acquisition of anchorage-independent UM cell growth is associated with the reprogramming of metabolism towards lipogenesis (Figure 1) [39]. Furthermore, metastatic MM cells display elevated glycolytic capacities [59–61] and aberrant mitochondrial marker expression [63], which are associated with poor prognosis and advanced stage of MM, respectively (Figure 2). A more precise understanding of the metabolic plasticity of rare melanoma cells during their metastatic progression will enable us to better understand the process of rare melanoma metastasis and to broaden the therapeutic avenues.
Lastly, UM displays remarkable hepatic tropism, with up to 90% of metastases occurring in the liver. The close similarity between tumor cell metabolic demands and supply at certain distant tissues might favor organ tropism [4]. Metastatic ovarian tumor cells prefer to utilize fatty acids as a primary energy source, which might explain their high frequency of metastasis to lipid-abundant tissues [82]. Interestingly, the selective metabolic reprograming of cancer cells may contribute to organ tropism [4]. Brain metastatic CM cells have upregulated OXPHOS gene expression profiles, and suppression of OXPHOS in melanoma cells led to a reduction in brain (but not lung) metastasis [83]. In metastatic colorectal cancer, cells utilize hepatocyte-derived metabolites to colonize the liver, resulting in liver metastasis [84], which raises the possibility that unique metabolic interactions between UM cells and secreted metabolites from metastatic microenvironment might be involved in liver tropism.
Other metabolic alterations are also likely to contribute to the hepatic tropism of UM. Upregulated mitochondrial metabolism has also been observed in metastatic UM [19, 35]. Insulin-like growth factor-1 (IGF-1) receptor expression was observed in liver metastatic UM tumors, and endo- and exogenous IGF-1 induced an increased liver metastatic UM cell proliferation [85]. High levels of IGF-1 are associated with insulin resistance, and both UM cells and patients display insulin resistant metabolic features [32, 33]. Altogether, these observations suggest that UM-specific metabolic reprogramming might underlie the hepatic tropism, a hypothesis that could be addressed by future investigations.
Here, we review recent investigations that have implicated reprogramming of cellular metabolism as a key determinant of tumor growth and metastasis in UM, MM and AM. These new studies offering potential opportunities to devise new therapies based on the targeted inhibition of specific metabolic processes. Even so, further studies are needed to (1) characterize the leading metabolites and pathways that define rare melanoma-specific metabolisms and provide detectable biomarkers, (2) clarify the effects of altered metabolism on rare melanoma development and metastasis, including the pronounced liver tropism of UM, and (3) evaluate the therapeutic efficacies of targeting metabolism in rare melanoma. This future research will successfully identify novel metabolic vulnerabilities in rare melanoma and will ultimately open new therapeutic avenues for the rare melanoma patients.
Highlights.
Uveal melanoma (UM), mucosal melanoma (MM), and acral melanoma (AM) are rarer melanoma subtypes that have distinct genetic profiles compared to cutaneous melanoma. Targeted inhibitors and immune checkpoint inhibitors that are effective in CM have shown poor responses in UM, MM, and AM.
Metabolic reprogramming of cancer cells is associated with tumorigenesis and cancer progression. Targeting cancer metabolism has been considered a promising approach in many cancers; however, this field has not yet fully investigated in rare melanoma subtypes.
Understanding of rare melanoma-specific metabolism represents an unrealized therapeutic opportunity and offers the deepen knowledge of its pathobiology.
Compared to normal melanocytes, UM and MM display distinct metabolism. Moreover, there are metabolic differences between metastatic and non-metastatic rare melanoma tumors.
Acknowledgments
We thank members of the Aplin lab for feedback on this review.
Financial support:
This work was supported by a postdoctoral fellowship from the American Association for Cancer Research (AACR) and Ocular Melanoma Foundation (OMF) awarded to A. Han. Additional support was provided by grants R01 CA196278, R01 CA253977 and P01 CA114046 from the National Institutes of Health (NIH)/National Cancer Institute (NCI) and by a Melanoma Research Alliance team science award (#559058) to A.E. Aplin. This work was also supported by grants from NIH NCI DP2 CA249950 and NIH NCI P01 CA114046 to Z.T. Schug.
Conflict of interest:
A.E. Aplin reports receiving a commercial research grant from Pfizer Inc. (2013-2017) and has ownership interest in patent number 9880150. No potential conflicts of interest are disclosed by the other authors.
Footnotes
Publisher's Disclaimer: This is a PDF file of an unedited manuscript that has been accepted for publication. As a service to our customers we are providing this early version of the manuscript. The manuscript will undergo copyediting, typesetting, and review of the resulting proof before it is published in its final form. Please note that during the production process errors may be discovered which could affect the content, and all legal disclaimers that apply to the journal pertain.
References
- 1.Rabbie R et al. (2019) Melanoma subtypes: genomic profiles, prognostic molecular markers and therapeutic possibilities. J. Pathol 247 (5), 539–551. [DOI] [PMC free article] [PubMed] [Google Scholar]
- 2.Alicea GM and Rebecca VW (2021) Emerging strategies to treat rare and intractable subtypes of melanoma. Pigment Cell Melanoma Res 34 (1), 44–58. [DOI] [PMC free article] [PubMed] [Google Scholar]
- 3.Chua V et al. (2021) The Latest on Uveal Melanoma Research and Clinical Trials: Updates from the Cure Ocular Melanoma (CURE OM) Science Meeting (2019). Clin. Cancer Res 27 (1), 28–33. [DOI] [PMC free article] [PubMed] [Google Scholar]
- 4.Faubert B et al. (2020) Metabolic reprogramming and cancer progression. Science 368 (6487), eaaw5473. [DOI] [PMC free article] [PubMed] [Google Scholar]
- 5.Najera L et al. (2019) Prognostic implications of markers of the metabolic phenotype in human cutaneous melanoma. Brit. J. Derm 181 (1), 114–127. [DOI] [PubMed] [Google Scholar]
- 6.DeBerardinis RJ and Chandel NS (2016) Fundamentals of cancer metabolism. Sci. Adv 2 (5), e1600200. [DOI] [PMC free article] [PubMed] [Google Scholar]
- 7.Mayers JR et al. (2016) Tissue of origin dictates branched-chain amino acid metabolism in mutant Kras-driven cancers. Science 353 (6304), 1161–5. [DOI] [PMC free article] [PubMed] [Google Scholar]
- 8.Kuphal S et al. (2010) Constitutive HIF-1 activity in malignant melanoma. Eur. J. Cancer 46 (6), 1159–1169. [DOI] [PubMed] [Google Scholar]
- 9.Scott DA et al. (2011) Comparative metabolic flux profiling of melanoma cell lines beyond the warburg effect. J. Biol. Chem 286 (49), 42626–42634. [DOI] [PMC free article] [PubMed] [Google Scholar]
- 10.Fischer GM et al. (2018) Metabolic strategies of melanoma cells: Mechanisms, interactions with the tumor microenvironment, and therapeutic implications. Pigment Cell Melanoma Res 31 (1), 11–30. [DOI] [PMC free article] [PubMed] [Google Scholar]
- 11.Singh AD et al. (2011) Uveal melanoma: trends in incidence, treatment, and survival. Ophthalmology 118(9), 1881–1885. [DOI] [PubMed] [Google Scholar]
- 12.Damato B (2018) Ocular treatment of choroidal melanoma in relation to the prevention of metastatic death–A personal view. Prog. Retin. Eye Res 66, 187–199. [DOI] [PubMed] [Google Scholar]
- 13.Van Raamsdonk CD et al. (2009) Frequent somatic mutations of GNAQ in uveal melanoma and blue naevi. Nature 457 (7229), 599–602. [DOI] [PMC free article] [PubMed] [Google Scholar]
- 14.Van Raamsdonk CD et al. (2010) Mutations in GNA11 in uveal melanoma. N Engl J Med 363 (23), 2191–2199. [DOI] [PMC free article] [PubMed] [Google Scholar]
- 15.Harbour JW et al. (2010) Frequent mutation of BAP1 in metastasizing uveal melanomas. Science 330 (6009), 1410–1413. [DOI] [PMC free article] [PubMed] [Google Scholar]
- 16.Weidmann C et al. (2017) Differential responses of choroidal melanocytes and uveal melanoma cells to low oxygen conditions. Mol. Vis 23, 103–115. [PMC free article] [PubMed] [Google Scholar]
- 17.Halestrap AP and PRICE NT (1999) The proton-linked monocarboxylate transporter (MCT) family: structure, function and regulation. Biochem. J 343 (2), 281–299. [PMC free article] [PubMed] [Google Scholar]
- 18.An J et al. (2011) A comparative transcriptomic analysis of uveal melanoma and normal uveal melanocyte. PLoS One 6 (1), e16516. [DOI] [PMC free article] [PubMed] [Google Scholar]
- 19.Giallongo S et al. (2020) Loss of macroH2A1 decreases mitochondrial metabolism and reduces the aggressiveness of uveal melanoma cells. Aging (Albany NY) 12 (10), 9745–9760. [DOI] [PMC free article] [PubMed] [Google Scholar]
- 20.Peng X et al. (2018) Molecular characterization and clinical relevance of metabolic expression subtypes in human cancers. Cell Rep 23 (1), 255–269. e4. [DOI] [PMC free article] [PubMed] [Google Scholar]
- 21.Angi M et al. (2016) In-depth proteomic profiling of the uveal melanoma secretome. Oncotarget 7 (31), 49623–49635. [DOI] [PMC free article] [PubMed] [Google Scholar]
- 22.Yadav RK et al. (2014) Endoplasmic reticulum stress and cancer. J. Cancer Prev 19 (2), 75–88. [DOI] [PMC free article] [PubMed] [Google Scholar]
- 23.Chong WC et al. (2017) Endoplasmic reticulum stress and oxidative stress: a vicious nexus implicated in bowel disease pathophysiology. Int. J. Mol. Sci 18 (4), 771. [DOI] [PMC free article] [PubMed] [Google Scholar]
- 24.Markiewicz A et al. (2019) Vitamin D receptors (VDR), hydroxylases CYP27B1 and CYP24A1 and retinoid-related orphan receptors (ROR) level in human uveal tract and ocular melanoma with different melanization levels. Sci. Rep 9 (1), 1–13. [DOI] [PMC free article] [PubMed] [Google Scholar]
- 25.Slominski AT et al. (2017) Vitamin D signaling and melanoma: role of vitamin D and its receptors in melanoma progression and management. Lab Invest 97 (6), 706–724. [DOI] [PMC free article] [PubMed] [Google Scholar]
- 26.Hu M-J et al. (2018) Association between vitamin D deficiency and risk of thyroid cancer: a case–control study and a meta-analysis. J Endocrinol Invest 41 (10), 1199–1210. [DOI] [PubMed] [Google Scholar]
- 27.Brożyna AA et al. (2013) Expression of the vitamin D–activating enzyme 1α-hydroxylase (CYP27B1) decreases during melanoma progression. Hum. Pathol 44 (3), 374–387. [DOI] [PMC free article] [PubMed] [Google Scholar]
- 28.Saw RP et al. (2014) Adjuvant therapy with high dose vitamin D following primary treatment of melanoma at high risk of recurrence: a placebo controlled randomised phase II trial (ANZMTG 02.09 Mel-D). BMC cancer 14 (1), 780. [DOI] [PMC free article] [PubMed] [Google Scholar]
- 29.Cohen VM et al. (2018) Staging uveal melanoma with whole-body positron-emission tomography/computed tomography and abdominal ultrasound: Low incidence of metastatic disease, high incidence of second primary cancers. Middle East Afr. J. Ophthalmol 25 (2), 91–95. [DOI] [PMC free article] [PubMed] [Google Scholar]
- 30.Eldredge-Hindy H et al. (2016) Yttrium-90 microsphere brachytherapy for liver metastases from uveal melanoma: clinical outcomes and the predictive value of fluorodeoxyglucose positron emission tomography. J Clin Oncol 39 (2), 189–95. [DOI] [PMC free article] [PubMed] [Google Scholar]
- 31.Rousset M et al. (1981) Presence of glycogen and growth-related variations in 58 cultured human tumor cell lines of various tissue origins. Cancer Res 41 (3), 1165–1170. [PubMed] [Google Scholar]
- 32.Vardanyan S et al. (2020) Metastasis of Uveal Melanoma with Monosomy-3 Is Associated with a Less Glycogenetic Gene Expression Profile and the Dysregulation of Glycogen Storage. Cancers 12 (8), 2101. [DOI] [PMC free article] [PubMed] [Google Scholar]
- 33.Sevim DG and Kiratli H (2016) Serum adiponectin, insulin resistance, and uveal melanoma: clinicopathological correlations. Melanoma Res 26 (2), 164–172. [DOI] [PubMed] [Google Scholar]
- 34.Xu B et al. (2018) Genome-wide analysis of uveal melanoma metastasis-associated LncRNAs and their functional network. DNA Cell Biol 37 (2), 99–108. [DOI] [PubMed] [Google Scholar]
- 35.Chattopadhyay C et al. (2019) Elevated Endogenous SDHA Drives Pathological Metabolism in Highly Metastatic Uveal Melanoma. Investig. Ophthalmol. Vis. Sci 60 (13), 4187–4195. [DOI] [PMC free article] [PubMed] [Google Scholar]
- 36.Salvatorelli L et al. (2019) Immunoexpression of Macroh2a in Uveal Melanoma. Appl. Sci 9 (16), 3244. [Google Scholar]
- 37.Keshet R et al. (2018) Rewiring urea cycle metabolism in cancer to support anabolism. Nat. Rev. Cancer 18 (10), 634–645. [DOI] [PubMed] [Google Scholar]
- 38.Van Meer G et al. (2008) Membrane lipids: where they are and how they behave. Nat. Rev. Mol. Cell Biol 9 (2), 112–124. [DOI] [PMC free article] [PubMed] [Google Scholar]
- 39.Ness C et al. (2017) Multicellular tumor spheroids of human uveal melanoma induce genes associated with anoikis resistance, lipogenesis, and SSXs. Mol. Vis 23, 680–694. [PMC free article] [PubMed] [Google Scholar]
- 40.Paoli P et al. (2013) Anoikis molecular pathways and its role in cancer progression. Biochim Biophys Acta 1833 (12), 3481–3498. [DOI] [PubMed] [Google Scholar]
- 41.Eales K et al. (2016) Hypoxia and metabolic adaptation of cancer cells. Oncogenesis 5 (1), e190. [DOI] [PMC free article] [PubMed] [Google Scholar]
- 42.Brouwer NJ et al. (2019) Tumour angiogenesis in uveal melanoma is related to genetic evolution. Cancers 11 (7), 979. [DOI] [PMC free article] [PubMed] [Google Scholar]
- 43.Brouwer NJ et al. (2019) Ischemia is related to tumour genetics in uveal melanoma. Cancers 11 (7), 1004. [DOI] [PMC free article] [PubMed] [Google Scholar]
- 44.Robertson AG et al. (2017) Integrative analysis identifies four molecular and clinical subsets in uveal melanoma. Cancer cell 32 (2), 204–220. e15. [DOI] [PMC free article] [PubMed] [Google Scholar]
- 45.Han A et al. (2021) BAP1 mutant uveal melanoma is stratified by metabolic phenotypes with distinct vulnerability to metabolic inhibitors. Oncogene 40 (3), 618–632. [DOI] [PMC free article] [PubMed] [Google Scholar]
- 46.Reuter S et al. (2010) Oxidative stress, inflammation, and cancer: how are they linked? Free Radio. Biol. Med 49 (11), 1603–1616. [DOI] [PMC free article] [PubMed] [Google Scholar]
- 47.Dogru M et al. (2018) Potential role of oxidative stress in ocular surface inflammation and dry eye disease. Investig. Ophthalmol. Vis. Sci 59 (14), DES163–DES168. [DOI] [PubMed] [Google Scholar]
- 48.Tangvarasittichai O and Tangvarasittichai S (2018) Oxidative stress, ocular disease and diabetes retinopathy. Curr. Pharm. Des 24 (40), 4726–4741. [DOI] [PubMed] [Google Scholar]
- 49.Vandhana S et al. (2012) Microarray analysis and biochemical correlations of oxidative stress responsive genes in retinoblastoma. Curr. Eye Res 37 (9), 830–841. [DOI] [PubMed] [Google Scholar]
- 50.Valluru L and Subramanyam Dasari RW (2014) Role of free radicals and antioxidants in gynecological cancers: current status and future prospects. Oxid Antioxid Med Sci 3 (1), 15–26. [Google Scholar]
- 51.Dithmer M et al. (2019) Uveal melanoma cell under oxidative stress-influence of VEGF and VEGF-inhibitors. Klin Monbl Augenheilkd. 236 (3), 295–307. [DOI] [PubMed] [Google Scholar]
- 52.Luengo A et al. (2017) Targeting metabolism for cancer therapy. Cell Chem. Biol 24 (9), 1161–1180. [DOI] [PMC free article] [PubMed] [Google Scholar]
- 53.Gopal YV et al. (2014) Inhibition of mTORC1/2 overcomes resistance to MAPK pathway inhibitors mediated by PGC1α and oxidative phosphorylation in melanoma. Cancer Res 74 (23), 7037–7047. [DOI] [PMC free article] [PubMed] [Google Scholar]
- 54.Corazao-Rozas P et al. (2013) Mitochondrial oxidative stress is the Achille’s heel of melanoma cells resistant to Braf-mutant inhibitor. Oncotarget 4 (11), 1986–98. [DOI] [PMC free article] [PubMed] [Google Scholar]
- 55.Teh JL et al. (2020) Metabolic adaptations to MEK and CDK4/6 co-targeting in uveal melanoma. Mol. Cancer Ther (8), 1719–1726. [DOI] [PMC free article] [PubMed] [Google Scholar]
- 56.Dumaz N et al. (2019) Atypical BRAF and NRAS mutations in mucosal melanoma. Cancers 11 (8), 1133. [DOI] [PMC free article] [PubMed] [Google Scholar]
- 57.Hayward NK et al. (2017) Whole-genome landscapes of major melanoma subtypes. Nature 545 (7653), 175–180. [DOI] [PubMed] [Google Scholar]
- 58.Nassar KW and Tan AC, The mutational landscape of mucosal melanoma, Semin Cancer Biol, Elsevier, 2020, pp. 139–148. [DOI] [PMC free article] [PubMed] [Google Scholar]
- 59.Seban R-D et al. (2020) Prognostic 18F-FDG PET biomarkers in metastatic mucosal and cutaneous melanoma treated with immune checkpoint inhibitors targeting PD-1 and CTLA-4. Eur. J. Nucl. Med. Mol. Imaging (10), 2301–2312. [DOI] [PubMed] [Google Scholar]
- 60.Zukotynski K et al. (2014) Metabolic response by FDG-PET to imatinib correlates with exon 11 KIT mutation and predicts outcome in patients with mucosal melanoma. Cancer Imaging 14 (1), 30. [DOI] [PMC free article] [PubMed] [Google Scholar]
- 61.Ascierto PA et al. (2016) Complete response to nivolumab monotherapy in a treatment-naive, BRAF wild-type patient with advanced mucosal melanoma and elevated lactate dehydrogenase: a case report from a phase III trial. Cancer Immunol Immunother 65 (11), 1395–1400. [DOI] [PMC free article] [PubMed] [Google Scholar]
- 62.Forkasiewicz A et al. (2020) The usefulness of lactate dehydrogenase measurements in current oncological practice. Cell Mol Biol Lett 25 (1), 1–14. [DOI] [PMC free article] [PubMed] [Google Scholar]
- 63.Soares CD et al. (2019) Expression of mitochondrial dynamics markers during melanoma progression: Comparative study of head and neck cutaneous and mucosal melanomas. J Oral Pathol Med 48 (5), 373–381. [DOI] [PubMed] [Google Scholar]
- 64.Koundouros N and Poulogiannis G (2020) Reprogramming of fatty acid metabolism in cancer. Br J Cancer 122 (1), 4–22. [DOI] [PMC free article] [PubMed] [Google Scholar]
- 65.de Andrade B et al. (2011) Expression of fatty acid synthase (FASN) in oral nevi and melanoma. Oral Dis 17 (8), 808–812. [DOI] [PubMed] [Google Scholar]
- 66.Bradford PT et al. (2009) Acral lentiginous melanoma: incidence and survival patterns in the United States, 1986-2005. Arch Dermatol 145 (4), 427–434. [DOI] [PMC free article] [PubMed] [Google Scholar]
- 67.Basurto-Lozada P et al. (2021) Acral lentiginous melanoma: Basic facts, biological characteristics and research perspectives of an understudied disease. Pigment Cell Melanoma Res 34(1), 59–71. [DOI] [PMC free article] [PubMed] [Google Scholar]
- 68.Namiki T et al. (2011) AMP kinase-related kinase NUAK2 affects tumor growth, migration, and clinical outcome of human melanoma. PNAS 108 (16), 6597–6602. [DOI] [PMC free article] [PubMed] [Google Scholar]
- 69.Hardie DG (2011) AMP-activated protein kinase—an energy sensor that regulates all aspects of cell function. Genes Dev 25 (18), 1895–1908. [DOI] [PMC free article] [PubMed] [Google Scholar]
- 70.Johansson PA et al. (2020) Whole genome landscapes of uveal melanoma show an ultraviolet radiation signature in iris tumours. Nat. Commun 11 (1), 1–8. [DOI] [PMC free article] [PubMed] [Google Scholar]
- 71.Yeh I et al. (2019) Targeted genomic profiling of acral melanoma. J. Natl. Cancer Inst 111 (10), 1068–1077. [DOI] [PMC free article] [PubMed] [Google Scholar]
- 72.Watson MJ et al. (2021) Metabolic support of tumour-infiltrating regulatory T cells by lactic acid. Nature. [DOI] [PMC free article] [PubMed] [Google Scholar]
- 73.Zappasodi R et al. (2021) CTLA-4 blockade drives loss of T(reg) stability in glycolysis-low tumours. Nature. [DOI] [PMC free article] [PubMed] [Google Scholar]
- 74.Nanda CS et al. (2019) Defining a metabolic landscape of tumours: genome meets metabolism. Br. J. Cancer, 1–14. [DOI] [PMC free article] [PubMed] [Google Scholar]
- 75.Monsel G et al. (2010) C-Kit mutants require hypoxia-inducible factor 1α to transform melanocytes. Oncogene 29 (2), 227–236. [DOI] [PubMed] [Google Scholar]
- 76.Gwosdz C et al. (2006) Comprehensive analysis of the p53 status in mucosal and cutaneous melanomas. Int J Cancer 118 (3), 577–582. [DOI] [PubMed] [Google Scholar]
- 77.Vousden KH and Ryan KM (2009) p53 and metabolism. Nat. Rev. Cancer 9 (10), 691–700. [DOI] [PubMed] [Google Scholar]
- 78.Han A et al. (2021) Roles of the BAP1 tumor suppressor in cell metabolism. Cancer Res, canres.3430. [DOI] [PMC free article] [PubMed] [Google Scholar]
- 79.Kuk D et al. (2016) Prognosis of mucosal, uveal, acral, nonacral cutaneous, and unknown primary melanoma from the time of first metastasis. Oncologist 21 (7), 848–54. [DOI] [PMC free article] [PubMed] [Google Scholar]
- 80.Lehuédé C et al. (2016) Metabolic plasticity as a determinant of tumor growth and metastasis. Cancer Res. 76 (18), 5201–5208. [DOI] [PubMed] [Google Scholar]
- 81.LeBleu VS et al. (2014) PGC-1α mediates mitochondrial biogenesis and oxidative phosphorylation in cancer cells to promote metastasis. Nat. Cell Biol 16 (10), 992–1003. [DOI] [PMC free article] [PubMed] [Google Scholar]
- 82.Nieman KM et al. (2011) Adipocytes promote ovarian cancer metastasis and provide energy for rapid tumor growth. Nat. Med 17 (11), 1498–503. [DOI] [PMC free article] [PubMed] [Google Scholar]
- 83.Fischer GM et al. (2019) Molecular profiling reveals unique immune and metabolic features of melanoma brain metastases. Cancer Discov 9 (5), 628–645. [DOI] [PMC free article] [PubMed] [Google Scholar]
- 84.Loo JM et al. (2015) Extracellular metabolic energetics can promote cancer progression. Cell 160 (3), 393–406. [DOI] [PMC free article] [PubMed] [Google Scholar]
- 85.Yoshida M et al. (2014) Expression of insulin-like growth factor-1 receptor in metastatic uveal melanoma and implications for potential autocrine and paracrine tumor cell growth. Pigment Cell Melanoma Res 27 (2), 297–308. [DOI] [PubMed] [Google Scholar]