

Abstract
Male patients have a significantly higher prevalence of advanced-stage thyroid cancer. However, sex differences in the risk of differentiated thyroid carcinoma (DTC) recurrence have not been fully elucidated. Therefore, the present study aimed to investigate male sex as a prognostic factor for DTC. We assessed 5566 patients with DTC who underwent thyroid surgery between January 2009 and December 2015 at Seoul St. Mary’s Hospital (Seoul, Korea). Clinicopathological characteristics and long-term oncologic outcomes between female and male patients with DTC were compared using propensity score matching to reduce selection bias. The mean follow-up duration was 99.9 ± 18.7 months. The recurrence rate was significantly higher in male patients than female patients before matching (3.3% vs. 2.2%, p = 0.030), and there was no significant difference in recurrence rates between the matched groups after matching (3.0% vs. 2.5%, p = 0.591). Based on Kaplan–Meier analysis, the two groups did not significantly differ in disease-free survival after matching. Multivariate analysis revealed that male sex was not an independent prognostic factor of DTC recurrence. Male sex did not have a significant effect on DTC recurrence. Further studies with larger cohorts are required to validate the findings of this study.
Subject terms: Cancer, Endocrinology
Introduction
Thyroid cancer is one of the most common endocrine malignancies. The incidence of thyroid cancer has substantially increased worldwide in the last several decades1–3. Differentiated thyroid carcinoma (DTC), including papillary thyroid carcinoma (PTC), follicular thyroid carcinoma (FTC), and Hürthle cell carcinoma, is the most common malignancy of the thyroid gland4. In terms of overall incidence, DTC accounts for 1%–1.5% of all cases of cancer, and its incidence is three times higher in female patients than male patients2,5,6.
Generally, DTC has an excellent prognosis because of its indolent features. According to a Surveillance, Epidemiology, and End Results report, patients with DTC have an overall survival rate of 90%–95%7. However, some clinicopathological risk factors, including age, tumor size, lymph node (LN) metastasis, and extrathyroidal extension (ETE), are associated with the aggressive nature and high recurrence of DTC8. The American Thyroid Association (ATA) management guidelines have proposed a clinicopathological risk stratification system that can be used for classifying patients as those who are at low, intermediate, or high risk. Using this system, several factors, such as ETE, LN metastasis, aggressive histology, vascular invasion, and multifocality were found to be associated with increased risk of recurrence9. However, sex is not considered a risk factor for recurrence.
DTC is more prevalent in women than men but the cause is not fully elucidated10. Li et al. reported that male patients had a 0.78-fold risk of developing malignancy and larger tumor size than female patients11. Moreover, male patients had a significantly higher prevalence of advanced-stage thyroid cancer, LN metastasis, and ETE12. Some studies have reported that sex, age, tumor size, aggressive histology, ETE, and LN metastasis were significant prognostic factors for thyroid cancer13–17. The impact of sex on the risk of DTC recurrence is controversial, and results pertaining to this concept vary in the literature14,16,18–21. Toniato et al. and several other studies have concluded that sex does not significantly contribute to recurrence and survival16,20. By contrast, Zahedi et al. studied patients with DTC who were > 18 years old and showed that the recurrence rate was higher in males than in females, a finding supported by other studies14,18,19. In another novel study, Choi H. et al. summarized secular trends by analyzing results to date and found that the poor outcome of PTC associated with men decreased over time, whereas aggressive pathological features remained the same or increased over time21.
Therefore, the current study aimed to compare the clinicopathological characteristics and long-term oncologic outcomes between females and males with DTC using propensity score matching to reduce selection bias.
Results
Comparison of clinicopathological characteristics between female and male patients before and after propensity score matching
Table 1 shows the baseline clinicopathological characteristics of female and male patients before and after propensity score matching. In terms of age, males were significantly younger than females (45.8 ± 11.8 vs. 46.8 ± 12.2 years, p = 0.017). The surgical extent was significantly more extensive in males than females (p = 0.001). Tumor size was significantly larger in males than females (1.1 ± 0.8 vs. 0.9 ± 0.7 cm, p < 0.001). The incidence of lymphatic and vascular invasions was significantly higher in males than females (34.3% vs. 24.6%, p < 0.001 and 4.0% vs. 1.9%, p < 0.001, respectively). Female patients had a significantly higher prevalence of ETE that male patients (5.7% vs. 3.9%. p = 0.022). Moreover, the proportion of harvested and positive LNs was higher in males than females (12.6 ± 16.7 vs. 10.7 ± 12.1, p < 0.001 and 3.1 ± 4.9 vs. 1.7 ± 3.4, p < 0.001, respectively). Males had significantly more advanced N and TNM stage than females (p < 0.001 and p = 0.021, respectively). A significantly higher recurrence rate was observed in males than females before matching (3.3% vs. 2.2%, p = 0.030).
Table 1.
Comparison of clinicopathological characteristics between females and males before and after propensity score matching.
| Before matching | After matching | |||||
|---|---|---|---|---|---|---|
| Female (n = 4420) | Male (n = 1146) | p-value | Female (n = 1040) | Male (n = 1040) | p-value | |
| Age (years) |
46.8 ± 12.2 (range, 12–88) |
45.8 ± 11.8 (range, 11–81) |
0.017 |
46.5 ± 12.4 (range, 14–79) |
46.2 ± 11.8 (range, 11–81) |
0.535 |
| Extent of operation | 0.001 | 0.376 | ||||
| Less than TT | 3313 (75.0%) | 805 (70.2%) | 764 (73.5%) | 745 (71.6%) | ||
| TT and/or mRND | 1107 (25.0%) | 341 (29.8%) | 276 (26.5%) | 295 (28.4%) | ||
| Type of carcinoma | 0.823 | 0.986 | ||||
| PTC | 4333 (98.0%) | 1124 (98.1%) | 1018 (97.9%) | 1019 (98.0%) | ||
| FTC | 75 (1.7%) | 18 (1.6%) | 18 (1.7%) | 17 (1.6%) | ||
| HTC | 12 (0.3%) | 4 (0.3%) | 4 (0.4%) | 4 (0.4%) | ||
| Tumor size (cm) |
0.9 ± 0.7 (range, 0.2–9.0) |
1.1 ± 0.8 (range, 0.2–5.5) |
< 0.001 |
1.1 ± 0.8 (range, 0.2–6.5) |
1.1 ± 0.8 (range, 0.2–5.5) |
0.933 |
| ETE | 250 (5.7%) | 45 (3.9%) | 0.022 | 39 (3.8%) | 40 (3.8%) | 0.909 |
| Multifocality | 1708 (38.6%) | 446 (38.9%) | 0.865 | 398 (38.3%) | 390 (37.5%) | 0.752 |
| Bilaterality | 414 (9.4%) | 101 (8.8%) | 0.607 | 101 (9.7%) | 82 (7.9%) | 0.163 |
| Lymphatic invasion | 1086 (24.6%) | 393 (34.3%) | < 0.001 | 326 (31.3%) | 325 (31.3%) | 0.962 |
| Vascular invasion | 83 (1.9%) | 46 (4.0%) | < 0.001 | 35 (3.4%) | 35 (3.4%) | 1.000 |
| Perineural invasion | 81 (1.8%) | 24 (2.1%) | 0.544 | 21 (2.0%) | 20 (1.9%) | 0.875 |
| BRAFV600E positive | 2871/3650 (78.7%) | 748/929 (80.5%) | 0.223 | 659/866 (76.1%) | 675/846 (79.8%) | 0.071 |
| Harvested LNs | 10.7 ± 12.1 | 12.6 ± 16.7 | < 0.001 | 10.8 ± 12.3 | 11.7 ± 15.2 | 0.109 |
| Positive LNs | 1.7 ± 3.4 | 3.1 ± 4.9 | < 0.001 | 2.4 ± 3.8 | 2.6 ± 3.9 | 0.355 |
| T stage | 0.710 | 0.779 | ||||
| T1 | 3911 (88.5%) | 991 (86.5%) | 924 (88.8%) | 909 (87.4%) | ||
| T2 | 218 (4.9%) | 91 (7.9%) | 64 (6.2%) | 74 (7.1%) | ||
| T3a | 41 (0.5%) | 19 (1.7%) | 13 (1.3%) | 17 (1.6%) | ||
| T3b | 238 (5.4%) | 44 (3.8%) | 37 (3.6%) | 39 (3.8%) | ||
| T4a | 12 (0.3%) | 1 (0.1%) | 2 (0.2%) | 1 (0.1%) | ||
| N stage | < 0.001 | 0.502 | ||||
| N0 | 2351 (53.2%) | 471 (41.1%) | 456 (43.8%) | 455 (43.8%) | ||
| N1a | 1880 (42.5%) | 597 (52.1%) | 533 (51.3%) | 522 (50.2%) | ||
| N1b | 189 (4.3%) | 78 (6.8%) | 51 (4.9%) | 63 (6.1%) | ||
| M stage | 0.471 | |||||
| M1 | 2 (0.0%) | 0 (0.0%) | 0 (0%) | 0 (0%) | ||
| TNM stage | 0.021 | 0.530 | ||||
| Stage I | 3903 (88.3%) | 983 (85.8%) | 887 (85.3%) | 898 (86.3%) | ||
| Stage II | 516 (11.7%) | 163 (14.2%) | 153 (14.7%) | 142 (13.7%) | ||
| Stage III | 1 (0.0%) | 0 (0%) | 0 (0%) | 0 (0%) | 0.530 | |
| Recurrence | 96 (2.2%) | 38 (3.3%) | 0.030 | 26 (2.5%) | 31 (3.0%) | 0.591 |
Data are expressed as patient’s number (%), or mean ± SD.
A statistically significant difference was defined as p < 0.05.
TT total thyroidectomy, mRND modified radical neck dissection, PTC papillary thyroid carcinoma, FTC follicular thyroid carcinoma, HTC Hürthle cell thyroid carcinoma, ETE extrathyroidal extension, LN lymph node, T tumor, N node, M metastasis.
Propensity score matching yielded 1040 matched pairs of patients. There were no significant differences in clinicopathological characteristics, including the recurrence rate, between the matched groups (Table 1).
Univariate and multivariate analyses of the risk factors for recurrence before and after propensity score matching
Table 2 presents the univariate and multivariate Cox regression analysis results for the risk factors of recurrence before propensity score matching. Age ≤ 45 years (hazard ratio (HR) 1.841; 95% confidence interval (CI) 1.278–2.652; p = 0.001), ETE (HR 2.196; 95% CI 1.305–3.695; p = 0.003), vascular invasion (HR 2.504; 95% CI 1.286–4.876; p = 0.007), and number of positive LNs were considered to be significant predictors of recurrence (HR 1.062; 95% CI 1.041–1.083; p < 0.001). Among the various risk factors, N1a stage was the most significant predictor of recurrence (HR 3.159; 95% CI 2.015–4.955; p < 0.001).
Table 2.
Univariate and multivariate analyses of risk factors for recurrence before propensity score matching.
| Univariate | Multivariate | |||
|---|---|---|---|---|
| HR (95% CI) | p-value | HR (95% CI) | p-value | |
| Gender | ||||
| Female | Ref. | |||
| Male | 1.552 (1.066–2.259) | 0.022 | ||
| Age (years) | ||||
| > 45 | Ref. | Ref. | ||
| ≤ 45 | 2.192 (1.537–3.125) | < 0.001 | 1.841 (1.278–2.652) | 0.001 |
| Extent of operation | ||||
| Less than TT | Ref. | |||
| TT and/or mRND | 1.821 (1.286–2.577) | 0.001 | ||
| Tumor size | ||||
| < 1 cm | Ref. | |||
| ≥ 1 cm | 2..136 (1.522–2.998) | < 0.001 | ||
| ETE | 3.409 (2.140–5.432) | < 0.001 | 2.196 (1.305–3.695) | 0.003 |
| Multifocality | 1.563 (1.114–2.193) | 0.010 | ||
| Bilaterality | 1.744 (1.084–2.805) | 0.022 | ||
| Lymphatic invasion | 3.202 (2.281–4.496) | < 0.001 | ||
| Vacular invasion | 3.471 (1.822–6.611) | < 0.001 | 2.504 (1.286–4.876) | 0.007 |
| Perineural invasion | 3.335 (1.632–6.815) | 0;001 | ||
| Harvested LNs | 1.021 (1.014–1.028) | < 0.001 | ||
| Positive LNs | 1.076 (1.063–1.088) | < 0.001 | 1.062 (1.041–1.083) | < 0.001 |
| T stage | ||||
| T1 | Ref. | |||
| T2 | 2.488 (1.445–4.285) | 0.001 | ||
| T3b | 3.649 (2.256–5.903) | < 0.001 | ||
| T4a | 3.928 (0.548–28.173) | 0.173 | ||
| N stage | ||||
| N0 | Ref. | Ref. | ||
| N1a | 4.350 (2.797–6.765) | < 0.001 | 3.159 (2.015–4.955) | < 0.001 |
| N1b | 7.002 (3.738–13.116) | < 0.001 | 1.488 (0.630–3.512) | 0.364 |
Data are expressed as hazard ratio (HR) and 95% confidence interval (CI).
A p value < 0.05 was considered statistically significant.
TT total thyroidectomy, mRND modified radical neck dissection, ETE extrathyroidal extension, LN lymph node, T tumor, N node.
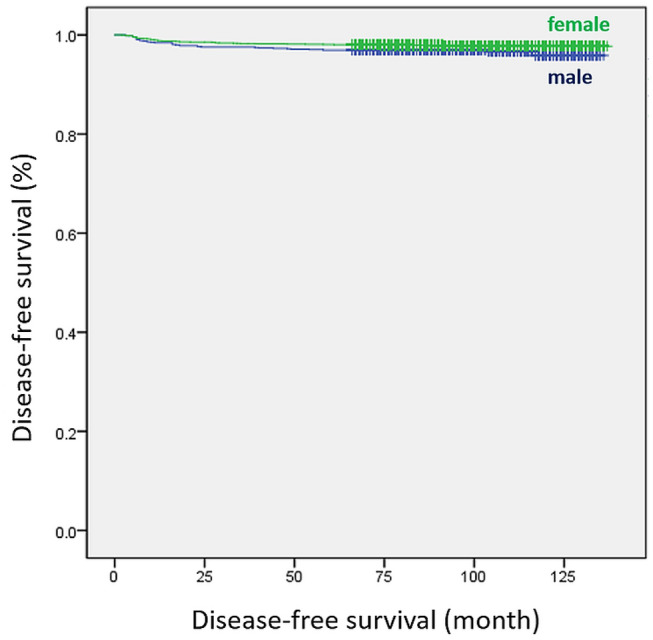
After propensity score matching, the number of positive LNs (HR 1.193; 95% CI 1.129–1.260; p < 0.001) and N1a stage (HR 2.401; 95% CI 1.010–5.708; p = 0.047) were found to be significant predictors of recurrence (Table 3). In the Kaplan–Meier analysis, disease-free survival (DFS) was significantly differed between the two groups before matching (p = 0.021, Fig. 1). However, there was no significant difference in DFS between the two groups after matching (p = 0.492, Fig. 2).
Table 3.
Univariate and multivariate analyses of risk factors for recurrence after propensity score matching.
| Univariate | Multivariate | |||
|---|---|---|---|---|
| HR (95% CI) | p-value | HR (95% CI) | p-value | |
| Tumor size | ||||
| < 1 cm | Ref. | |||
| ≥ 1 cm | 2.155 (1.281–3.624) | 0.004 | ||
| ETE | 4.330 (2.050–9.144) | < 0.001 | ||
| Bilaterality | 2.259 (1.141–4.471) | 0.019 | ||
| Lymphatic invasion | 4.185 (2.429–7.210) | < 0.001 | ||
| Perineural invasion | 3.787 (1.370–10.464) | 0.010 | ||
| Harvested LNs | 1.022 (1.012–1.032) | < 0.001 | ||
| Positive LNs | 1.152 (1.115–1.190) | < 0.001 | 1.193 (1.129–1.260) | < 0.001 |
| T stage | ||||
| T1 | Ref. | |||
| T2 | 3.079 (1.494–6.346) | 0.002 | ||
| T3b | 5.077 (2.376–10.847) | < 0.001 | ||
| N stage | ||||
| N0 | Ref. | Ref. | ||
| N1a | 5.432 (2.444–12.077) | < 0.001 | 2.401 (1.010–5.708) | 0.047 |
| N1b | 8.255 (2.895–23.542) | < 0.001 | 0.545 (0.121–2.464) | 0.431 |
Data are expressed as hazard ratio (HR) and 95% confidence interval (CI).
A p value < 0.05 was considered statistically significant.
ETE extrathyroidal extension, LN lymph node, T tumor, N node.
Figure 1.
Disease-free survival curves of female and male groups before propensity score matching (log-rank p = 0.021).
Figure 2.

Disease-free survival curves of female and male groups after propensity score matching (log-rank p = 0.492).
Subgroup analysis between female and male patients aged between 20 and 45 years before and after propensity score matching
The baseline clinicopathological characteristics of female and male patients aged between 20 and 45 years are summarized in Table 4. Before propensity score matching, age was considered to be a significant factor. That is, males were significantly older than females (36.8 ± 5.2 vs. 35.8 ± 6.2 years, p = 0.001). Moreover, males underwent significantly more extensive surgeries than females (p = 0.001). The incidence of lymphatic invasion was significantly higher in males than in females (36.8% vs. 30.3%, p = 0.003). Male patients had a significantly higher proportion of harvested and positive LNs than female patients (13.9 ± 16.9 vs. 11.4 ± 13.0, p < 0.001 and 3.6 ± 5.3 vs. 2.2 ± 3.8, p < 0.001, respectively). N stage was significantly more advanced in males than females (p < 0.001). However, there were no significant differences in recurrence rates between the two groups (p = 0.086).
Table 4.
Subgroup comparison between female and male participants aged 20–45 years before and after propensity score matching.
| Before matching | After matching | |||||
|---|---|---|---|---|---|---|
| Female (n = 1948) | Male (n = 587) | p-value | Female (n = 515) | Male (n = 515) | p-value | |
| Age (years) |
35.8 ± 6.2 (range, 20–45) |
36.8 ± 5.2 (range, 20–45) |
0.001 |
36.8 ± 6.0 (range, 20–45) |
36.7 ± 5.2 (range, 20–45) |
0.722 |
| Extent of operation | 0.001 | 0.946 | ||||
| Less than TT | 1470 (75.5%) | 402 (68.5%) | 356 (69.1%) | 355 (68.9%) | ||
| TT and/or mRND | 478 (24.5%) | 185 (31.5%) | 159 (30.9%) | 160 (31.1%) | ||
| Type of carcinoma | 0.283 | 0.155 | ||||
| PTC | 1915 (98.3%) | 576 (98.1%) | 510 (99.0%) | 504 (97.9%) | ||
| FTC | 30 (1.5%) | 8 (1.4%) | 5 (1.0%) | 8 (1.6%) | ||
| HTC | 3 (0.2%) | 3 (0.5%) | 0 (0%) | 3 (0.6%) | ||
| Tumor size (cm) |
1.0 ± 0.7 (range, 0.2–9.0) |
1.0 ± 0.7 (range, 0.2–5.5) |
0.072 |
1.0 ± 0.8 (range, 0.2–9.0) |
1.0 ± 0.7 (range, 0.2–5.5) |
0.589 |
| ETE | 71 (3.6%) | 19 (3.2%) | 0.704 | 20 (3.9%) | 18 (3.5%) | 0.869 |
| Multifocality | 653 (33.5%) | 206 (35.1%) | 0.486 | 174 (33.8%) | 172 (33.4%) | 0.947 |
| Bilaterality | 156 (8.0%) | 47 (8.0%) | 0.999 | 50 (9.7%) | 37 (7.2%) | 0.178 |
| Lymphatic invasion | 590 (30.3%) | 216 (36.8%) | 0.003 | 186 (36.1%) | 180 (35.0%) | 0.745 |
| Vascular invasion | 40 (2.1%) | 18 (3.1%) | 0.157 | 15 (2.9%) | 15 (2.9%) | 1.000 |
| Perineural invasion | 26 (1.3%) | 11 (1.9%) | 0.330 | 7 (1.4%) | 9 (1.7%) | 0.802 |
| BRAFV600E positive | 1250/1608 (77.7%) | 388/476 (81.5%) | 322/416 (77.4%) | 337/417 (80.8%) | 0.234 | |
| Harvested LNs | 11.4 ± 13.0 | 13.9 ± 16.9 | < 0.001 | 13.0 ± 15.2 | 13.1 ± 15.4 | 0.798 |
| Positive LNs | 2.2 ± 3.8 | 3.6 ± 5.3 | < 0.001 | 3.2 ± 5.1 | 3.1 ± 4.5 | 0.816 |
| T stage | 0.219 | 0.748 | ||||
| T1 | 1745 (89.6%) | 519 (88.4%) | 460 (89.3%) | 455 (88.3%) | ||
| T2 | 116 (6.0%) | 47 (8.0%) | 32 (6.2%) | 40 (7.8%) | ||
| T3a | 16 (0.8%) | 2 (0.3%) | 3 (0.6%) | 2 (0.4%) | ||
| T3b | 67 (3.4%) | 19 (3.2%) | 20 (3.9%) | 18 (3.5%) | ||
| T4a | 4 (0.2%) | 0 (0%) | 0 (0%) | 0 (0%) | ||
| N stage | < 0.001 | 0.847 | ||||
| N0 | 921 (47.3%) | 210 (35.8%) | 194 (37.7%) | 197 (38.3%) | ||
| N1a | 917 (47.1%) | 327 (55.7%) | 277 (53.8%) | 279 (54.2%) | ||
| N1b | 110 (5.6%) | 50 (8.5%) | 44 (8.5%) | 39 (7.6%) | ||
| TNM stage | 1.000 | |||||
| Stage I | 1946 (99.9%) | 587 (100%) | 0.590 | 514 (99.8%) | 515 (100%) | |
| Stage II | 2 (0.1%) | 0 (0%) | 1 (0.2%) | 0 (0%) | ||
| Recurrence | 63 (3.2%) | 21 (3.6%) | 0.086 | 23 (4.5%) | 20 (3.9%) | 0.756 |
Data are expressed as patient’s number (%), or mean ± SD.
A statistically significant difference was defined as p < 0.05.
TT total thyroidectomy, mRND modified radical neck dissection, PTC papillary thyroid carcinoma, FTC follicular thyroid carcinoma, HTC Hürthle cell thyroid carcinoma, ETE extrathyroidal extension, LN lymph node, T tumor, N node, M metastasis.
Propensity score matching yielded 515 matched pairs of patients. There were no significant differences in clinicopathological characteristics between the matched groups (Table 4).
Table 5 depicts the risk factors for recurrence among patients aged between 20 and 45 years after propensity score matching. Lymphatic invasion (HR 2.214; 95% CI 1.118–4.381; p = 0.023) and the proportion of positive LNs (HR 1.071; 95% CI 1.028– 1.115; p < 0.001) were considered to be significant predictors of recurrence.
Table 5.
Univariate and multivariate analyses of risk factors for recurrence in patients aged 20–45 years after propensity score matching.
| Univariate | Multivariate | |||
|---|---|---|---|---|
| HR (95% CI) | p-value | HR (95% CI) | p-value | |
| Extent of operation | ||||
| Less than TT | Ref. | |||
| TT and/or mRND | 2.380 (1.309–4.329) | 0.004 | ||
| ETE | 2.916 (1.042–8.163) | 0.042 | ||
| Bilaterality | 2.259 (1.141–4.471) | 0.019 | ||
| Lymphatic invasion | 3.217 (1.732–5.972) | < 0.001 | 2.214 (1.118–4.381) | 0.023 |
| Vascular invasion | 4.446 (1.748–11.305) | 0.002 | ||
| Harvested LNs | 1.015 (1.001–1.029) | 0.041 | ||
| Positive LNs | 1.094 (1.056–1.133) | < 0.001 | 1.071 (1.028–1.115) | < 0.001 |
| N stage | ||||
| N0 | Ref. | |||
| N1a | 3.148 (1.383–7.169) | 0.006 | ||
| N1b | 4.255 (1.429–12.671) | 0.009 | ||
Data are expressed as hazard ratio (HR) and 95% confidence interval (CI).
A p value < 0.05 was considered statistically significant.
TT total thyroidectomy, mRND modified radical neck dissection, ETE extrathyroidal extension, LN lymph node, N node.
Subgroup analysis between female and male patients aged over 45 years before and after propensity score matching
Table 6 presents the baseline clinicopathological characteristics of females and males aged over 45 years before and after propensity score matching. The tumor size was significantly larger in males than in females (1.1 ± 0.9 vs. 1.0 ± 0.7 cm, p < 0.001). Males had a significantly higher prevalence of ETE than females (4.5% vs 7.5%, p < 0.024). The incidence of lymphatic and vascular invasions was significantly higher in males than in females (31.2% vs. 19.7%, p < 0.001 and 4.5% vs. 1.7%, p < 0.001, respectively). Males had a significantly higher proportion of positive LNs than females (2.4 ± 4.2 vs. 1.3 ± 2.6, p < 0.001). Further, male patients had a significantly higher T, N, and TNM stage than female patients (p < 0.001, p < 0.001 and p < 0.001, respectively). The recurrence rate was significantly higher in males than in females (2.9% vs 1.3%, p = 0.012). After matching, the recurrence rate did not significantly differ between the two groups (p = 0.301).
Table 6.
Subgroup comparison between females and males aged > 45 years before and after propensity score matching.
| Before matching | After matching | |||||
|---|---|---|---|---|---|---|
| Female (n = 2451) | Male (n = 552) | p-value | Female (n = 515) | Male (n = 515) | p-value | |
| Age (years) |
55.8 ± 7.3 (range, 46—88) |
55.9 ± 7.8 (range, 46—81) |
0.796 |
56.3 ± 7.5 (range, 46—83) |
55.8 ± 7.8 (range, 46—81) |
0.360 |
| Extent of operation | 0.259 | 0.003 | ||||
| Less than TT | 1829 (74.6%) | 399 (72.3%) | 401 (82.9%) | 362 (74.8%) | ||
| TT and/or mRND | 622 (25.4%) | 153 (27.7%) | 83 (17.1%) | 122 (25.2%) | ||
| Type of carcinoma | 0.774 | 0.035 | ||||
| PTC | 2399 (97.9%) | 542 (98.2%) | 461 (95.2%) | 475 (98.1%) | ||
| FTC | 43 (1.8%) | 9 (1.6%) | 18 (3.7%) | 8 (1.7%) | ||
| HTC | 9 (0.4%) | 1 (0.2%) | 5 (1.0%) | 1 (0.2%) | ||
| Tumor size (cm) |
1.0 ± 0.7 (range, 0.2 – 6.0) |
1.1 ± 0.9 (range, 0.2 – 5.5) |
< 0.001 |
1.1 ± 0.9 (range, 0.2 – 5.0) |
1.1 ± 0.9 (range, 0.2 – 5.5) |
0.906 |
| ETE | 177 (7.2%) | 25 4.5%) | 0.024 | 19 (3.9%) | 22 (4.5%) | 0.750 |
| Multifocality | 1049 (42.8%) | 239 (42.3%) | 0.849 | 215 (44.4%) | 205 (42.4%) | 0.559 |
| Bilaterality | 256 (10.4%) | 53 (9.6%) | 0.588 | 42 (8.7%) | 45 (9.3%) | 0.822 |
| Lymphatic invasion | 483 (19.7%) | 172 (31.2%) | < 0.001 | 120 (24.8%) | 131 (27.1%) | 0.463 |
| Vascular invasion | 41 (1.7%) | 25 (4.5%) | < 0.001 | 22 (4.5%) | 17 (3.5%) | 0.514 |
| Perineural invasion | 54 (2.2%) | 13 (2.4%) | 0.873 | 11 (2.3%) | 11 (2.3%) | 1.000 |
| BRAFV600E positive | 1611/2026 (79.5%) | 354/447 (79.2%) | 0.897 | 325/402 (80.8%) | 313/394 (79.4%) | 0.657 |
| Harvested LNs | 10.1 ± 10.8 | 10.9 ± 14.6 | 0.151 | 9.9 ± 11.6 | 10.9 ± 15.1 | 0.230 |
| Positive LNs | 1.3 ± 2.6 | 2.4 ± 4.2 | < 0.001 | 2.0 ± 3.4 | 2.3 ± 4.2 | 0.313 |
| T stage | < 0.001 | 0.879 | ||||
| T1 | 2153 (87.8%) | 470 (85.1%) | 423 (87.4%) | 418 (88.3%) | ||
| T2 | 97 (4.0%) | 41 (7.4%) | 31 (6.4%) | 33 (7.8%) | ||
| T3a | 24 (1.0%) | 16 (2.9%) | 11 (2.3%) | 11 (0.4%) | ||
| T3b | 169 (6.9%) | 24 (4.3%) | 19 (3.9%) | 21 (3.5%) | ||
| T4a | 8 (0.3%) | 1 (0.2%) | 0 (0%) | 1 (0.2%) | ||
| N stage | < 0.001 | 0.909 | ||||
| N0 | 1425 (58.1%) | 260 (47.1%) | 250 (51.7%) | 244 (50.4%) | ||
| N1a | 951 (38.8%) | 265 (48.0%) | 210 (43.4%) | 214 (44.2%) | ||
| N1b | 75 (3.1%) | 27 (4.9%) | 24 (5.0%) | 26 (5.4%) | ||
| TNM stage | < 0.001 | 0.884 | ||||
| Stage I | 1936 (79.0%) | 389 (70.5%) | 356 (73.6%) | 359 (74.2%) | ||
| Stage II | 514 (21.0%) | 163 (29.5%) | 128 (26.4%) | 125 (25.8%) | ||
| Stage III | 1 (0.0%) | 0 (0%) | 0 (0%) | 0 (0%) | ||
| Recurrence | 31 (1.3%) | 16 (2.9%) | 0.012 | 9 (1.9%) | 15 (3.1%) | 0.301 |
Data are expressed as patient’s number(%), or mean ± SD.
A statistically significant difference was defined as p < 0.05.
TT total thyroidectomy, mRND modified radical neck dissection, PTC papillary thyroid carcinoma, FTC follicular thyroid carcinoma, HTC Hürthle cell thyroid carcinoma, ETE extrathyroidal extension, LN lymph node, T tumor, N node, M metastasis.
The risk factors for recurrence in patients aged > 45 years after propensity score matching are shown in Table 7. Multifocality (HR 3.438; 95% CI 1.143–10.342; p = 0.028) and the proportion of positive LNs (HR 1.259; 95% CI 1.117– 1.429; p < 0.001) were found to be significant predictors of recurrence.
Table 7.
Univariate and multivariate analyses of risk factors for recurrence in patients aged > 45 years after propensity score matching.
| Univariate | Multivariate | |||
|---|---|---|---|---|
| HR (95% CI) | p-value | HR (95% CI) | p-value | |
| Tumor size | ||||
| < 1 cm | Ref. | |||
| ≥ 1 cm | 3.267 (1.430–7.466) | 0.005 | ||
| ETE | 7.779 (3.088–19.600) | < 0.001 | ||
| Multifocality | 2.642 (1.131–6.173) | 0.025 | 3.438 (1.143–10.342) | 0.028 |
| Lymphatic invasion | 4.068 (1.807–9.158) | 0.001 | ||
| Vascular invasion | 4.810 (1.644–14.072) | 0.004 | ||
| Perineural invasion | 8.741 (2.987–25.576) | < 0.001 | ||
| Harvested LNs | 1.027 (1.014–1.040) | < 0.001 | ||
| Positive LNs | 1.112 (1.079–1.147) | < 0.001 | 1.259 (1.117–1.419) | < 0.001 |
| T stage | ||||
| T1 | Ref. | |||
| T2 | 3.873 (1.275–11.766) | 0.017 | ||
| T3b | 9.329 (3.585–24.279) | < 0.001 | ||
| N stage | ||||
| N0 | Ref. | |||
| N1a | 3.545 (1.288–9.754) | 0.014 | ||
| N1b | 8.059 (2.164–30.013) | 0.002 | ||
Data are expressed as hazard ratio (HR) and 95% confidence interval (CI).
A p value < 0.05 was considered statistically significant.
ETE extrathyroidal extension, LN lymph node, N node.
Discussion
DTC is the most common endocrine malignancy, and it usually has a favorable prognosis, with a 10-year disease-specific survival rate of > 90%2,7,22–24. However, some patients can develop local recurrence or distant metastasis to the lung and/or bone, resulting in death. This finding indicates that DTC can progress via different clinical pathways. Several clinicopathological factors, including age, tumor size, ETE, multifocality, LN metastasis, and histologic type, were found to be significant prognostic factors for DTC25–28. The ATA management guidelines have proposed a risk stratification system based on significant prognostic factors9. The American Joint Committee on Cancer/Union for International Cancer Control TNM staging system has been widely used for predicting the prognosis of DTC29. However, sex has not been considered a prognostic factor in the commonly used staging systems.
Male sex was associated with a lower DFS and disease-specific survival based on previous studies18,30–33. However, some reports showed that the overall survival was not affected by sex34,35. A prognostic factor correlated with sex is not a consistent finding, and the effect of sex on DFS has not yet been validated. Recently, Zahedi et al. reported that the risk of DTC recurrence is higher in men than in women18. Thus, this study aimed to evaluate the effect of sex on long-term prognosis of DTC.
This study compared the clinicopathological characteristics and long-term oncologic outcomes of male and female patients with DTC. Results showed that compared with females, males had significantly larger tumor sizes, higher prevalence of ETE and lymphatic and vascular invasions and greater proportions of positive LNs and TNM stage. This result is consistent with that of previous studies showing that men were more likely to present with more aggressive disease characteristics11,12,36,37. The recurrence rate was significantly higher in males than in females (3.3% vs. 2.2%, p = 0.030). However, this result may not be accurate with respect to disease severity.
In this study, the impact of sex was assessed in patients with DTC. However, a significant difference was observed between males and females in terms of several clinicopathological characteristics. That is, males were significantly younger than females. Furthermore, male sex was significantly associated with more aggressive tumor characteristics, including larger tumor size, higher incidence of ETE and lymphatic and vascular invasion, and greater TNM stage and proportion of positive LNs. Therefore, the findings of this study were affected by several confounding factors, including selection bias, between the two groups. To minimize the effects of these factors, propensity score matching analysis was performed to adjust for several clinicopathological characteristics. After matching, the recurrence rates between female and male patient did not significantly differ (2.5% vs. 3.0%, p = 0.591).
We performed multivariate Cox regression and Kaplan–Meier analyses to identify whether sex was independently associated with DFS before and after propensity score matching. Before matching, male sex was considered to be a significant predictor of recurrence (HR 1.552; p = 0.022) based on the univariate analysis. A statistically significant difference was also observed in the Kaplan–Meier analysis (log-rank test, p = 0.021). However, sex was not an independent prognostic factor for recurrence in multivariate analysis. Several studies have reported that male sex was not an independent risk factor for survival in DTC20,37. After matching, our analyses confirmed that sex was not a significant predictor of DTC recurrence.
It is difficult to explain why the DFS did not significantly differ between male and female patients with DTC in current study. However, this result may be attributed to the long-term decreasing prognostic potential of male sex. Choi et al. have assessed secular trends in the prognostic factors for PTC. They reported that the risk for poor outcomes associated with male sex decreased over time in PTC. However, the risk associated with pathologic characteristics remained the same or increased over time21. Further, another study has shown that young women had a better prognosis, and the outcomes were similar between men and those aged > 55 years33. Therefore, a subgroup analysis was conducted to evaluate the differences in prognosis between male and female patients according to age. The patients were divided into two groups, which were as follows: young age group (≤ 45 years) and old age group (> 45 years). We validated that sex was not an independent prognostic factor for recurrence in both age groups in the multivariate analysis after propensity score matching. The cause of the difference in DTC presentation between males and females is unclear. However, the increased number of screening tests might be correlated to these changes. In the past, men were less likely to visit hospitals than women; thus, they present with more aggressive stages of thyroid cancer. In addition, since a high proportion of women present with benign thyroid disease, such as thyroiditis, screening is faster due to serial follow-up. Therefore, women with thyroid cancer could be diagnosed at earlier stage. However, with the higher number of health examinations performed, the number of male patients with incidentally detected thyroid cancer has been increasing recently. Machens et al. emphasized the need for earlier diagnosis and intervention in men to validate whether male sex is an ominous prognostic factor of advanced-stage thyroid cancer12.
Another study showed that sex was an age-specific effect modifier for the incidence of PTC. Thus, the sex gap in the incidence of PTC decreased with age33,38. Since the proportion of elderly male patients is relatively higher, age might be an important confounding factor when conducting a comparison between two groups according to sex. Hence, sex might not be an independent prognosis factor39.
Based on the results of our research, large multicenter studies with propensity score matching on sex difference should be conducted to determine if our results are confirmed. That is, sex is not an independent prognosis factor. To date, most studies, such as that conducted by Zahedi et al., did not perform propensity score matching18. In addition, we might conduct a study with a subgroup analysis according to tumor size. Lee et al. showed that male sex is an independent prognostic factor for recurrence in PTC > 1 cm, but not in thyroid microcarcinoma19. By conducting an analysis using propensity score matching on whether sex has a tumor size-specific effect, further research can identify whether the management of males and females should vary based on tumor size.
This study had several limitations. That is, it was retrospective in nature. Moreover, there might have been selection bias because data were collected at a single tertiary institution and do not represent the entire patient population. However, propensity score matching was performed to adjust for differences in clinicopathological characteristics and to minimize bias. In propensity score matching analysis, data loss from 3486 patients should also be considered. Finally, the mean follow-up period was relatively short (99.9 ± 18.7 months). Hence, a longer follow-up is required to predict the prognosis of patients with DTC, as it has indolent characteristics. In addition, although all patients were followed up for the appropriate levothyroxine dose, RAI ablation, and serum Tg level, those parameters were not appropriately included in this study. Because these parameters are crucial and may affect the propensity score matching, more reliable results would have been obtained if the above parameters were included.
This study had several important strengths. Each patient was followed up, and a standardized laboratory and imaging protocol was used in a single institution. Moreover, this is one of the largest cohort studies conducted on this topic to date. To the best of our knowledge, few studies have used propensity score matching to evaluate the effect of sex on the long-term prognosis for DTC.
In conclusion, compared with females, male patients were more likely to present with more aggressive disease characteristics, including larger tumor size, higher prevalence of ETE and lymphatic and vascular invasions, greater proportion of positive LNs, higher grade of TNM stage, and higher recurrence rate. However, after propensity score matching, no significant difference was observed in the recurrence rates between the matched groups. Therefore, male sex was not found to be an independent prognostic factor for DTC recurrence. Further studies with larger cohorts should be conducted to validate this result.
Methods
Patients
We retrospectively analyzed 5827 patients with DTC who underwent thyroid surgery from January 2009 to December 2015 at Seoul St. Mary’s Hospital (Seoul, Korea). In total, 198 patients with incomplete data and 63 who were lost to follow-up were excluded from the analysis. The medical charts and pathology reports of 5566 patients were reviewed and analyzed. According to sex, patients were categorized into two groups (female and male groups). The mean follow-up duration was 99.9 ± 18.7 (range 66–137) months. This study was conducted in accordance with the Declaration of Helsinki (as revised in 2013) and was approved by the institutional review board of Seoul St. Mary’s Hospital, The Catholic University of Korea (IRB No: KC20RISI0829), The need for informed consent was waived due to the retrospective nature of this study.
Preoperative workup
The preoperative workup included physical examination, serum thyroid function test, neck ultrasonography (US), and computed tomography (CT) scan. Thyroid nodules were diagnosed based on preoperative US-guided fine needle aspiration cytology (FNAC). FNAC was performed by experienced radiologists. The diagnoses made by using FNAC were based on the Bethesda system40. To validate the size and location of tumors, presence/absence of ETE, LN status, and other abnormal findings in the neck, all patients diagnosed with DTC were evaluated via preoperative US and neck CT scan. If there were palpable LNs or suspicious LNs were found on preoperative US or neck CT, FNAC and washout thyroglobulin testing were performed. The surgical extent was decided in accordance with the ATA management guideline.
Postoperative management and follow-up
Postoperative care and follow-up were conducted according to the ATA management guidelines regardless of sex. Patients underwent physical examination, neck US, and serum thyroid function testing at 3–6-month intervals and annually thereafter. All patients took suppressive doses of L-thyroxine and were regularly followed up by physical examination, thyroid function testing, Tg and anti-Tg antibody concentration measurements, and neck US at 3–6-month intervals and annually thereafter. Radioactive iodine (RAI) ablation was performed at 6–8 weeks postoperatively, and whole body scans were performed at 5–7 days after RAI ablation in patients who underwent total thyroidectomy.
Those with recurrence or distant metastasis on routine follow-up evaluations underwent additional diagnostic imaging, including CT scan, positron emission tomography/CT scan, and/or radioactive iodine whole body scan, to determine the location and extent of suspected recurrence. In cases of suspected recurrence in the remnant thyroid, resection bed, or lymph nodes, diagnosis was confirmed via histologic examination using FNAC or a surgical biopsy specimen.
Primary and secondary endpoints
The primary endpoint was DFS between males and females after propensity score matching, and the secondary endpoint was the clinicopathological characteristic differences between males and females before and after propensity score matching.
Statistical analysis
Continuous variables were presented as means with standard deviations and categorical variables were presented as numbers with percentages. Student’s t-test and the Pearson’s chi-square test or Fisher’s exact test were used to compare continuous and categorical variables, respectively. Univariate and multivariate Cox regression analyses were performed to validate the predictors of DFS, and HRs with 95% CIs were calculated. DFS was compared by performing Kaplan–Meier survival analysis with the log-rank test.
To reduce the effects of selection bias and potential confounding factors, propensity score matching was performed using various clinicopathological characteristics: age, extent of operation, tumor size, ETE, lymphatic invasion, vascular invasion, harvested LNs, positive LNs, N stage, and TNM stage. Individual patient propensity scores were calculated via logistic regression analysis. After propensity score matching, the clinicopathological characteristics representative of long-term oncologic outcome and recurrence were compared between females and males. A p value of < 0.05 was considered statistically significant. All statistical analyses were performed by using the Statistical Package for the Social Sciences software for Windows version 23.0 (IBM SPSS Statistics for Windows, IBM Corp., Armonk, NY).
Acknowledgements
This research was supported by the Basic Science Research Program through the National Research Foundation of Korea (NRF) funded by the Ministry of Education (NRF-2015R1D1A1A01058798).
Author contributions
K.K. designed the study, participated in data collection, data interpretation, and revised the manuscript. J.P. participated in the interpretation of the data and drafted and revised the manuscript. D.J.L., J.S.B., and J.S.K. participated in data analysis, interpretation of data and revised the manuscript. All authors approved the final version of the manuscript.
Data availability
The data that support the findings of this study are available on request from the corresponding author. The data are not publicly available due to privacy or ethical restrictions.
Competing interests
The authors declare no competing interests.
Footnotes
Publisher's note
Springer Nature remains neutral with regard to jurisdictional claims in published maps and institutional affiliations.
References
- 1.Chen AY, Jemal A, Ward EMJ. Increasing incidence of differentiated thyroid cancer in the United States, 1988–2005. Surgery. 2009;115:3801–3807. doi: 10.1002/cncr.24416. [DOI] [PubMed] [Google Scholar]
- 2.Pellegriti G, Frasca F, Regalbuto C, Squatrito S, Vigneri RJ. Worldwide increasing incidence of thyroid cancer: update on epidemiology and risk factors. J. Cancer Epidemiol. 2013;2013:1–10. doi: 10.1155/2013/965212. [DOI] [PMC free article] [PubMed] [Google Scholar]
- 3.Davies L, Welch HG. Current thyroid cancer trends in the United States. Surgery. 2014;140:317–322. doi: 10.1001/jamaoto.2014.1. [DOI] [PubMed] [Google Scholar]
- 4.Sherman SI, Perrier N, Clayman GL. 60 Years of Survival Outcomes at The University of Texas MD Anderson Cancer Center. Springer; 2013. pp. 295–310. [Google Scholar]
- 5.Kilfoy BA, et al. International patterns and trends in thyroid cancer incidence 1973–2002. Surgery. 2009;20:525–531. doi: 10.1007/s10552-008-9260-4. [DOI] [PMC free article] [PubMed] [Google Scholar]
- 6.Siegel R, Naishadham D, Jemal A. Cancer statistics 2012. CA Cancer J. Clin. 2012;62:10–29. doi: 10.3322/caac.20138. [DOI] [PubMed] [Google Scholar]
- 7.Cramer JD, Fu P, Harth KC, Margevicius S, Wilhelm SM. Analysis of the rising incidence of thyroid cancer using the Surveillance, Epidemiology and End Results national cancer data registry. Surgery. 2010;148:1147–1153. doi: 10.1016/j.surg.2010.10.016. [DOI] [PubMed] [Google Scholar]
- 8.Howlader, N. et al. SEER cancer statistics review, 1975–2009 (Vintage 2009 populations). (2012).
- 9.Haugen BR, et al. 2015 American Thyroid Association management guidelines for adult patients with thyroid nodules and differentiated thyroid cancer: the American Thyroid Association guidelines task force on thyroid nodules and differentiated thyroid cancer. Cancer. 2016;26:1–133. doi: 10.1089/thy.2015.0020. [DOI] [PMC free article] [PubMed] [Google Scholar]
- 10.Chow SM, et al. Differentiated thyroid carcinoma: Comparison between papillary and follicular carcinoma in a single institute. Head Neck. 2002;24:670–677. doi: 10.1002/hed.10080. [DOI] [PubMed] [Google Scholar]
- 11.Li T, et al. The derivation and validation of a prediction rule for differential diagnosis of thyroid nodules. Zhonghua Nei Ke Za Zhi. 2013;52:945–950. [PubMed] [Google Scholar]
- 12.Machens A, Hauptmann S, Dralle H. Disparities between male and female patients with thyroid cancers: Sex difference or gender divide? Clin. Endocrinol. 2006;65:500–505. doi: 10.1111/j.1365-2265.2006.02623.x. [DOI] [PubMed] [Google Scholar]
- 13.Gilliland FD, Hunt WC, Morris DM, Key CR. Prognostic factors for thyroid carcinoma: A population-based study of 15,698 cases from the Surveillance, Epidemiology and End Results (SEER) Program 1973–1991. Cancer. 1997;79:564–573. doi: 10.1002/(SICI)1097-0142(19970201)79:3<564::AID-CNCR20>3.0.CO;2-0. [DOI] [PubMed] [Google Scholar]
- 14.Jeon MJ, et al. Disease-specific mortality of differentiated thyroid cancer patients in Korea: A multicenter cohort study. Endocrinol. Metab. 2017;32:434–441. doi: 10.3803/EnM.2017.32.4.434. [DOI] [PMC free article] [PubMed] [Google Scholar]
- 15.Johnston LE, TranCao HS, Chang DC, Bouvet M. Sociodemographic predictors of survival in differentiated thyroid cancer: Results from the SEER database. ISRN Endocrinol. 2012;2012:1–8. doi: 10.5402/2012/384707. [DOI] [PMC free article] [PubMed] [Google Scholar]
- 16.Toniato A, et al. Papillary thyroid carcinoma: Factors influencing recurrence and survival. Ann. Surg. Oncol. 2008;15:1518–1522. doi: 10.1245/s10434-008-9859-4. [DOI] [PubMed] [Google Scholar]
- 17.Kim H, et al. Prognosis of differentiated thyroid carcinoma with initial distant metastasis: A multicenter study in Korea. Endocrinol. Metab. 2018;33:287–295. doi: 10.3803/EnM.2018.33.2.287. [DOI] [PMC free article] [PubMed] [Google Scholar]
- 18.Zahedi A, et al. Risk for thyroid cancer recurrence is higher in men than in women independent of disease stage at presentation. Thyroid. 2020;30:871–877. doi: 10.1089/thy.2018.0775. [DOI] [PubMed] [Google Scholar]
- 19.Lee YH, et al. Is male gender a prognostic factor for papillary thyroid microcarcinoma? Ann. Surg. Oncol. 2017;24:1958–1964. doi: 10.1245/s10434-017-5788-4. [DOI] [PubMed] [Google Scholar]
- 20.Kim MJ, et al. Current trends in the features of male thyroid cancer: retrospective evaluation of their prognostic value. Medicine. 2019;98:e15559. doi: 10.1097/MD.0000000000015559. [DOI] [PMC free article] [PubMed] [Google Scholar]
- 21.Choi H, et al. Secular trends in the prognostic factors for papillary thyroid cancer. Eur. J. Endocrinol. 2014;171:667–675. doi: 10.1530/EJE-14-0225. [DOI] [PubMed] [Google Scholar]
- 22.Davies L, Welch HG. Thyroid cancer survival in the United States: Observational data from 1973 to 2005. Arch. Otolaryngol. Head Neck Surg. 2010;136:440–444. doi: 10.1001/archoto.2010.55. [DOI] [PubMed] [Google Scholar]
- 23.Husson O, et al. Rising incidence, no change in survival and decreasing mortality from thyroid cancer in The Netherlands since 1989. Endocr. Relat. Cancer. 2013;20:263–271. doi: 10.1530/ERC-12-0336. [DOI] [PubMed] [Google Scholar]
- 24.Dal Maso L, et al. Survival of 86,690 patients with thyroid cancer: A population-based study in 29 European countries from EUROCARE-5. Eur. J. Cancer. 2017;77:140–152. doi: 10.1016/j.ejca.2017.02.023. [DOI] [PubMed] [Google Scholar]
- 25.Purnomo HS, Yulian ED, Makes B, Wangge G. Clinicopathological predictors of central compartment lymph node metastases in cN0 papillary thyroid carcinoma. New Ropanasuri J. Surg. 2017;2:2. doi: 10.7454/nrjs.v2i1.14. [DOI] [Google Scholar]
- 26.Leboulleux S, et al. Prognostic factors for persistent or recurrent disease of papillary thyroid carcinoma with neck lymph node metastases and/or tumor extension beyond the thyroid capsule at initial diagnosis. J. Clin. Endocrinol. Metab. 2005;90:5723–5729. doi: 10.1210/jc.2005-0285. [DOI] [PubMed] [Google Scholar]
- 27.Joseph KR, Edirimanne S, Eslick GD. Multifocality as a prognostic factor in thyroid cancer: A meta-analysis. Int. J. Surg. 2018;50:121–125. doi: 10.1016/j.ijsu.2017.12.035. [DOI] [PubMed] [Google Scholar]
- 28.Shoup M, et al. Prognostic indicators of outcomes in patients with distant metastases from differentiated thyroid carcinoma. J. Am. Coll. Surg. 2003;197:191–197. doi: 10.1016/S1072-7515(03)00332-6. [DOI] [PubMed] [Google Scholar]
- 29.Kim K, et al. Comparison of long-term prognosis for differentiated thyroid cancer according to the 7th and 8th editions of the AJCC/UICC TNM staging system. Ther. Adv. Endocrinol. Metab. 2020;11:2042018820921019. doi: 10.1177/2042018820921019. [DOI] [PMC free article] [PubMed] [Google Scholar]
- 30.Akslen LA, Myking AO, Salvesen H, Varhaug JE. Prognostic importance of various clinicopathological features in papillary thyroid carcinoma. Eur. J. Cancer. 1993;29:44–51. doi: 10.1016/0959-8049(93)90574-Y. [DOI] [PubMed] [Google Scholar]
- 31.Mazzaferri EL, Jhiang SM. Long-term impact of initial surgical and medical therapy on papillary and follicular thyroid cancer. Am. J. Med. 1994;97:418–428. doi: 10.1016/0002-9343(94)90321-2. [DOI] [PubMed] [Google Scholar]
- 32.Micheli A, et al. The advantage of women in cancer survival: an analysis of EUROCARE-4 data. Eur. J. Cancer. 2009;45:1017–1027. doi: 10.1016/j.ejca.2008.11.008. [DOI] [PubMed] [Google Scholar]
- 33.Jonklaas J, et al. The impact of age and gender on papillary thyroid cancer survival. J. Clin. Endocrinol. Metab. 2012;97:E878–E887. doi: 10.1210/jc.2011-2864. [DOI] [PMC free article] [PubMed] [Google Scholar]
- 34.Carcangiu ML, Zampi G, Pupi A, Castagnoli A, Rosai J. Papillary carcinoma of the thyroid: A clinicopathologic study of 241 cases treated at the University of Florence, Italy. Cancer. 1985;55:805–828. doi: 10.1002/1097-0142(19850215)55:4<805::AID-CNCR2820550419>3.0.CO;2-Z. [DOI] [PubMed] [Google Scholar]
- 35.Elisei R, et al. Are the clinical and pathological features of differentiated thyroid carcinoma really changed over the last 35 years? Study on 4187 patients from a single Italian institution to answer this question. J. Clin. Endocrinol. Metab. 2010;95:1516–1527. doi: 10.1210/jc.2009-1536. [DOI] [PubMed] [Google Scholar]
- 36.Nilubol N, Zhang L, Kebebew E. Multivariate analysis of the relationship between male sex, disease-specific survival, and features of tumor aggressiveness in thyroid cancer of follicular cell origin. Thyroid. 2013;23:695–702. doi: 10.1089/thy.2012.0269. [DOI] [PMC free article] [PubMed] [Google Scholar]
- 37.Oyer SL, Smith VA, Lentsch EJ. Sex is not an independent risk factor for survival in differentiated thyroid cancer. Laryngoscope. 2013;123:2913–2919. doi: 10.1002/lary.24018. [DOI] [PubMed] [Google Scholar]
- 38.Kilfoy BA, et al. Gender is an age-specific effect modifier for papillary cancers of the thyroid gland. Cancer Epidemiol. Prev. Biomark. 2009;18:1092–1100. doi: 10.1158/1055-9965.EPI-08-0976. [DOI] [PMC free article] [PubMed] [Google Scholar]
- 39.Lorenz K, Schneider R, Elwerr M. Thyroid carcinoma: Do we need to treat men and women differently? Vis. Med. 2020;36:10–14. doi: 10.1159/000505496. [DOI] [PMC free article] [PubMed] [Google Scholar]
- 40.Cibas ES, Ali SZ. The 2017 Bethesda system for reporting thyroid cytopathology. Thyroid. 2017;27:1341–1346. doi: 10.1089/thy.2017.0500. [DOI] [PubMed] [Google Scholar]
Associated Data
This section collects any data citations, data availability statements, or supplementary materials included in this article.
Data Availability Statement
The data that support the findings of this study are available on request from the corresponding author. The data are not publicly available due to privacy or ethical restrictions.