

Abstract
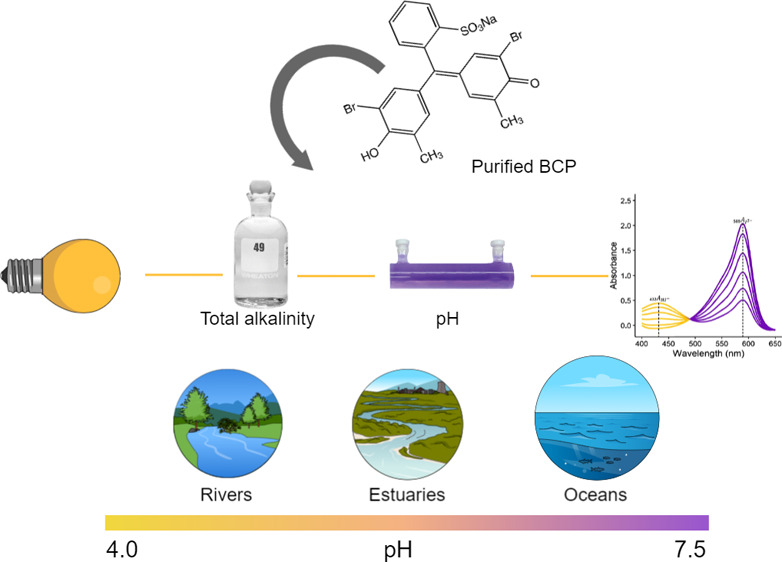
This work provides an algorithm to describe the salinity (SP) and temperature (T) dependence of the equilibrium and molar absorptivity characteristics of purified bromocresol purple (BCP, a pH indicator) over a river-to-sea range of salinity (0 ≤ SP ≤ 40). Based on the data obtained in this study, the pH of water samples can be calculated on the seawater pH scale as follows: pHSW = −log(K2e2) + log((R – e1)/(1 – Re4)) where −log(K2e2) = 4.981 – 0.1710SP0.5 + 0.09428SP + 0.3794SP1.5 + 0.0009129SP2 + 310.2/T – 17.33S1.5/T – 0.05895SP1.5 ln T – 0.0005730SP0.5T, e1 = 0.00049 ± 0.00029, and e4 = −7.101 × 10⁻³ + 7.674 × 10⁻⁵T + 1.361 × 10⁻⁵SP. The term pHSW is the negative log of the hydrogen ion concentration determined on the seawater pH scale; R is the ratio of BCP absorbances (A) at 432 and 589 nm; K2 is the equilibrium constant for the second BCP dissociation step; and e1, e2, and e4 are BCP molar absorptivity ratios. A log(K2e2) equation is also presented on the total pH scale. The e4 value determined for purified BCP in this study can be used with previously published procedures to correct BCP absorbance measurements obtained using off-the-shelf (unpurified) BCP. This work provides a method for purifying BCP, fills a critical gap in the suite of available purified sulfonephthalein indicators, enables high-quality spectrophotometric measurements of total alkalinity, and facilitates pH measurements in freshwater, estuarine, and ocean environments within the range 4.0 ≤ pH ≤ 7.5.
Introduction
Sulfonephthalein pH indicators have been extensively used to describe the acid–base chemistry of oceans, estuaries, and rivers.1−5 Meta-cresol purple (mCP), for example, with physical–chemical characteristics particularly suitable for measurements at circumneutral pH (Table 1), has been widely used to obtain full water-column pH profiles in all five ocean basins and also to monitor pH in estuarine, freshwater, and sub-zero environments.6−13 Thymol blue (TB), with a pH-indicating range approximately 0.5 pH units higher than mCP,5,14 has been used to measure pH in cold open-ocean surface waters of New Zealand, the Norwegian Coastal Current, and the Weddell Sea.15−17 TB has also been employed in coastal systems with high photosynthetic activity (resulting in elevated pH) and in highly alkaline environments such as tidal pools of the San Juan Islands.7,18 Sulfonephthalein indicators with pH-indicating ranges lower than that of mCP, such as cresol red (CR) and phenol red (PR), have been used to measure freshwater pH.9,19 Additionally, CR has been used to study carbon chemistry dynamics under sea ice at high latitudes20,21 and also pH distributions resulting from hydrothermal inputs on the Juan de Fuca ridge.22
Table 1. Characterizations of Sulfonephthalein Indicator Dyes Suitable for pH Measurements, Arranged in the Order of Descending pK2 (so the Lower the Entry in the Table, the Lower the Optimal pH-Indicating Range)a.
| indicator | references | conditions: SP, T (K) | λ (nm) | pK2 (SP = 35, T = 298.15 K) | pH (R = 1, SP = 35, T = 298.15 K) |
|---|---|---|---|---|---|
| TB | Zhang and Byrne (1996)14 | 30 ≤ SP ≤ 40, 278.15 ≤ T ≤ 308.15 | 435, 596 | 8.5 | 8.2 |
| Mosley et al. (2004)7 | 0.06 ≤ SP ≤ 40, T = 298.15 | ||||
| Hudson-Heck and Byrne (2019)*5 | 0 ≤ SP ≤ 40,278.15 ≤ T ≤ 308.15 | ||||
| mCP | Clayton and Byrne (1993)23 | 30 ≤ SP ≤ 37, 293 ≤ T ≤ 303 | 434, 578 | 8.0 | 7.6 |
| Mosley et al. (2004)7 | 0.06 ≤ SP ≤ 40, T = 298.15 | ||||
| Liu et al. (2011)*(24) | 20 ≤ SP ≤ 40,278.15 ≤ T ≤ 308.15 | ||||
| Lai et al. (2016)(9) | SP = 0,278.15 ≤ T ≤ 308.15 | ||||
| Loucaides et al. (2017)11 | 35 ≤ SP ≤ 100, freezing point ≤ T ≤ 298.15 | ||||
| Douglas and Byrne (2017b)3 | 0 ≤ SP ≤ 40, 278.15 ≤ T ≤ 308.15 | ||||
| Müller and Rehder (2018)4 | 0 ≤ SP ≤ 40,278.15 ≤ T ≤ 308.15 | ||||
| CR | Byrne and Breland (1989)22 | SP = 35, T = 298.15 | 433, 573 | 7.8 | 7.4 |
| French et al. (2002)19 | SP = 0, T = 293.15 | ||||
| Patsavas et al. (2013b)*(1) | 20 ≤ SP ≤ 40,278.15 ≤ T ≤ 308.15 | ||||
| PR | Robert-Baldo et al. (1985)25 | 33 ≤ SP ≤ 37, 273 ≤ T ≤ 303 | 433, 558 | 7.5 | 7.0 |
| Lai et al. (2016)(9) | SP = 0,281.15 ≤ T ≤ 303.15 | ||||
| Yao and Byrne (2001)26 | SP = 0, 281.15 ≤ T ≤ 303.15 | ||||
| BCP | Breland and Byrne (1992)27 | 29 ≤ SP ≤ 35.2, 286.15 ≤ T ≤ 305.15 | 432, 589 | 5.8 | 5.4 |
| Yao and Byrne (2001)26 | SP = 0, 283.15 ≤ T ≤ 303.15 | ||||
| this work* | 0 ≤ SP ≤ 40,278.15 ≤ T ≤ 308.15 | ||||
| BCG | Breland and Byrne (1993)28 | 29 ≤ SP ≤ 37, 286 ≤ T ≤ 305 | 444, 616 | 4.3 | 3.9 |
Publications listed in bold font used purified indicator dye; asterisks denote publications that describe purification procedures. Publications that provide characterizations appropriate for freshwater [e.g., Lai et al. (2016)9] will have higher corresponding pK2 values. pH values were calculated using the bolded references for each dye with the exception of the pH value for PR, which was calculated utilizing Robert-Baldo et al. (1985).25
Sulfonephthalein pH indicators have also been used for accurate and precise determination of other carbon system parameters such as total alkalinity (AT),2,28,29 total dissolved inorganic carbon (CT),30,31 carbon dioxide fugacity (fCO2),32−34 seawater calcium carbonate saturation states (Ω),29 and the organic alkalinity of coastal seawater.35 Sulfonephthalein indicators have been used in some cases for in situ measurements, providing carbon system measurements with high spatial and temporal resolution.32,36−41 The diversity of uses for sulfonephthalein indicators has included, as well, investigations of acid–base equilibria and trace metal speciation,42,43 observations of the hydration and dehydration kinetics of aqueous CO2,44 assessments of boron isotopic equilibria for determining paleo-pH,45,46 analysis of CO2-concentrating mechanisms in biota,47,48 and examinations of acid–base chemistry and metal toxicity in soils.49,50
The most accurate sulfonephthalein-based spectrophotometric measurements require the use of purified indicators to remove the substantial colored-impurities in some batches of commercial indicators that lead to erroneous absorbance ratio measurements, in conjunction with detailed characterizations of the physical–chemical properties of the indicator. Over the past 30 years, researchers have created algorithms to describe the behavior of sulfonephthalein indicators as a function of practical salinity (SP) and temperature (T) (Table 1). Purification methods have been developed for four sulfonephthalein indicators (mCP, TB, PR, and CR), but only TB and mCP have been characterized over a freshwater-to-seawater range of salinities (0 ≤ SP ≤ 40). The characteristics of purified PR have been reported only for zero ionic strength (I), and those for purified CR have been reported only for SP > 20.
Table 1 lists the currently available suite of sulfonephthalein indicators in order of dissociation constant K2, expressed as pK2 (i.e., −log K2) at 298.15 K. As a general guide, the pH-indicating range of each dye extends from approximately one pH unit above to one pH unit below its pK2 value.23,26,51 Significantly, the pK2 values of the first four indicators (TB, mCP, CR, and PR) range over only one log unit, while the difference between the values of the next two indicators [PR and bromocresol purple (BCP)] is nearly two units. As such, there is a substantial gap in the sulfonephthalein toolbox between purified indicators appropriate for mildly alkaline conditions (7.5 ≤ pK2 ≤ 8.5; TB, mCP, CR, and PR) and those appropriate for mildly acidic conditions [4.0 ≤ pH ≤ 6.3; BCP, bromocresol green (BCG)]. Importantly, BCP is one of only two sulfonephthalein indicators with pK2 values low enough for measurements of residual acid in total alkalinity titrations. Although BCG is, like BCP, appropriate for use in alkalinity titrations, BCP has a significantly higher pK2 value than BCG (Table 1), making it the ideal indicator for quantifying residual acid at a relatively high pH, thereby minimizing uncertainties in residual acid determinations. As such, although it would be useful to expand characterizations of purified PR to include marine and estuarine conditions, and CR to include SP < 20, the most pressing need in terms of current measurement capabilities is the development of BCP purification procedures and characterization of purified BCP. This new capability would extend the use of BCP for pH and AT measurements to include estuarine environments and enable pH measurements in environments that cannot be accessed with any of the current suites of purified sulfonephthalein indicators (e.g., alpine lakes or waters exposed to acid mine drainage).
BCP has been previously characterized using off-the-shelf (unpurified) indicators, over a narrow range of SP conditions in seawater (29 ≤ SP ≤ 35)27 and freshwater (SP = 0).26 Colored impurities in the indicator powders may therefore have influenced the absorbance measurements used in these characterizations, thus potentially causing significant errors in the published pH algorithms. This work aims to improve the accuracy of BCP-based pH measurements and extend characterizations to include estuarine conditions by (1) developing an efficient BCP purification method and (2) deriving an algorithm to describe the equilibrium and molar absorptivity characteristics of purified BCP over a full freshwater-to-seawater range of salinity conditions.
Theory
The pH of aqueous solutions can be calculated from sulfonephthalein absorbance ratios (R)1,4,5,14,24
| 1 |
where pH is the negative log of the hydrogen ion concentration (−log [H+]), expressed on either the seawater scale (pHSW), defined as [H+]SW = [H+]F + [HSO4–] + [HF], or the total scale (pHT), defined as [H+]T = [H+]F + [HSO4–];23,52K2 is the equilibrium constant for the second dissociation step of the indicator dye, expressed on either the seawater scale (K2SW) or the total scale (K2), with units of mol/kg; R is a sulfonephthalein absorbance ratio that is measured, in the case of BCP, at 432 and 589 nm (R = 589A/432A); and ex are molar absorptivity coefficients, also expressed in terms of the absorbance properties of BCP at 432 and 589 nm. For BCP, these constants are defined as
| 2a |
| 2b |
| 2c |
| 2d |
where epsilon (ε) has units of kg per mole per cm and the ratios are dimensionless.
Values of e1 (by definition, dependent on the HI– species alone) can be determined under acidic conditions, where absorbance contributions from H2I and I2– are negligible. Similarly, values of e4 can be determined at a sufficiently high pH that absorbance contributions from H2I and HI– are negligible. Use of eq 1 obviates the necessity for direct determinations of e2 and e3 and thus reduces the number of required ex characterizations for spectrophotometric pH measurements from 3 to 2.
The log(K2e2) term in eq 1 can be determined spectrophotometrically via paired measurements of mCP and BCP absorbance ratios (mCPR and BCPR). This type of approach is possible because there is a small region of overlap in the pH-indicating range of mCP and BCP. First, for a given batch of sample seawater and set of (SP, T) conditions, the pH term in eq 1 is directly measured using mCP, with the absorbance ratio mCPR = A578/A434 serving as input to the pH algorithm of Müller and Rehder (2018) (their eq 6 and Table 2; mCPpH).4 Then, for the same conditions (i.e., another sample of the same seawater at the same SP and T), the BCP absorbance ratio (BCPR = 589A/432A) is measured. Finally, with known values of BCP ex (eqs 2a and 2d), eq 1 can be solved for log(K2e2). It should be noted that log(K2e2) is determined as a single entity in order to eliminate the need for independent determinations of K2 and e2.1,4,14
Table 2. Mobile Phase Profile for Purifying BCP Using a Redisep Gold C18Aq Column.
| time (min) | % ACN |
|---|---|
| 0–3 | 10 |
| 3–7 | 15 |
| 7–10 | 20 |
| 10–14 | 30 |
| 14–18 | 40 |
| 18–22 | 80 |
| 22–25 | 10 |
Results
Purification of BCP
Table S1 outlines the purification method, using a Sielc PrimeSep B column, that provided the purified BCP used for the characterization of the absorbance and equilibrium properties of the indicator. During purification trials, it was noted that BCP had a very high affinity to the Sielc PrimeSep B column, resulting in a portion of the dye being inextricably retained on the column. As a result, the methods given in Table S1, although effective in purifying BCP, produced weight percentage recoveries of purified BCP somewhat smaller than 1%. Accordingly, additional purification methods were explored and resulted in weight percentage recoveries on the order of 2%. This yield is sufficient for approximately 8000 pH measurements. Table 2 shows the optimized mobile phase profile used to purify BCP with a Redisep Gold C18Aq column. The mixture is composed of acetonitrile (ACN), Milli-Q water, and 0.5% trifluoro acetic acid (TFA), with ACN being increased throughout the purification run. The main dye band began to move down the column when the ACN was 20% or greater (Figure S1). As the main band (Figure S1, orange) reached the end of the column, the initial portion of the band (Figure S1, yellow) was collected (approximately 30 mL) and HPLC analysis demonstrated that there was a minor impurity in this portion of the band. This portion of the band was discarded. Collection of the pure indicator was initiated when the absorbance reached a maximum and continued until the absorbance fell to 90% of the maximum (collected volume approximately 120 mL). Chromatographs of BCP before and after purification using the Redisep Gold C18Aq column (Figure 1) indicate the success of the method in removing impurities from commercial BCP. Impurity peaks seen in the chromatograph of off-the-shelf BCP at approximately 23 and 28 min, which show absorbance near 400 nm (Figure 1a), are absent in the post-purification chromatograph (Figure 1b).
Figure 1.

Chromatographs of off-the-shelf BCP (TCI batch WU III-FQ) before purification (a) and after purification (b) on the same scale using the Redisep Gold C18Aq column. In panel a, the absorbance spectra of the impurities with an elution time of 23 and 28 min are expanded and shown in red. The combined integrated area of the impurities is approximately 1% of the pure BCP peak. Chromatographs of additional unpurified batches of BCP are provided in Figure S2.
Molar Absorptivity Characteristics of BCP
For e1, the average value for 288 ≤ T ≤ 305 K can be expressed as
| 3 |
The full e1 data set is provided in Table S2. For the temperature range 288 ≤ T ≤ 305 K, e1 variations with temperature could not be discerned (Table S2). Given the very small value of e1 and considering that previous studies have noted the small influence of salinity relative to temperature on molar absorptivity ratios,1,24 variations with salinity were not explored.
The dependence of e4 on SP and T over 5 ≤ SP ≤ 40 and 278.15 ≤ T ≤ 308.15 K (Table S3, Figure S3) are well described by the following model
| 4 |
The residuals from this fit are shown in Figure 2 as a function of T. Overall, 95% of the residuals (Figure 2) are within ±0.00035. Figure S3 shows the separate influences of T and SP on e4. Though values of e4 were not determined for SP < 5, the weak dependence of e4 on SP allows satisfactory extrapolation to lower salinities.
Figure 2.

Residuals from fitting eq 4 to the e4 data set (Table S3) shown here as a function of T.
Equilibrium Characteristics of BCP
The experimentally determined log(K2e2) values (Table S4) were fit using the following equation
| 5 |
The coefficient values generated from these fits are provided in Table 3 for both the total and seawater pH scales. Overall, 99% of the residuals (i.e., empirical log(K2e2)—predicted log(K2e2); Figure 3) are within ±0.006 over the full range of SP and T. This range of residuals is consistent with previous indicator characterizations performed using TRIS buffers.4 Furthermore, good experimental control of solution temperature (with T between the paired mCP and BCP measurements differing by only 0.02 K on average) minimized the pH error attributable to T fluctuations to within ±0.0001 for a given SP and T.
Table 3. Modeled Coefficient Values for Calculating log(K2SWe2) and log(K2e2) from eq 5.
| coefficient | value (seawater scale) | value (total scale) |
|---|---|---|
| A | 4.981 | 4.981 |
| B | –0.1710 | –0.1729 |
| C | 0.09428 | 0.09406 |
| D | 0.3794 | 0.3730 |
| E | 0.0009129 | 0.0009074 |
| F | 310.2 | 310.1 |
| G | –17.33 | –17.03 |
| H | –0.05895 | –0.0580 |
| I | –0.0005730 | –0.0005658 |
Figure 3.

Residuals from fitting eq 5 to the log(K2SWe2) data set (Table S4) shown here as a function of SP.
Table 4 shows calculated log(K2SWe2) and log(K2e2) values for freshwater and typical seawater at 298.15 K using Table 3 coefficients.
Table 4. Check Values for Seawater and Freshwater Conditionsa.
| SP | T | e1 | e4 | –log(K2SWe2) | –log(K2Te2) |
|---|---|---|---|---|---|
| 35 | 298.15 | 0.00049 | 0.0163 | 5.3944 | 5.3850 |
| 0 | 298.15 | 0.00049 | 0.0158 | 6.0214 | 6.0211 |
Approximate pK2 values for BCP (5.85, at SP = 35 and T = 298.15 K) can be obtained using the e2 value of Breland and Byrne (1992).
These values serve as check values to ensure that eq 5 coefficients, and all other coefficients, are correctly entered into investigators’ computational programs.
Discussion
Comparison with Previous Studies
Molar Absorptivity (ex)
Previous investigators used off-the-shelf BCP to determine e1, e2, and e3 for a single set of conditions each: SP = 35, T = 298.15 K27 and SP = 0, T = 298.15 K.26 This work, in contrast, used purified BCP to determine these values over ranges of SP and T conditions.
For e1, the value determined in this study (0.00049 ± 0.00029; eq 3) is roughly one-tenth the values reported by Breland and Byrne (1992)27 and Yao and Byrne (2001).26 We hypothesize that this difference is due to insufficient acidification in those earlier studies. The previous e1 determinations were made in solutions in which the absorbance of HI– (432A) was maximized. However, further acidification is required to reduce absorbance contributions of the I2– species at 589 nm to zero. The significance of this problem was not recognized in the previous work. Our investigations revealed that, subsequent to acidification to a point that 432A reached a maximum, with further acidification to pH values less than 2, the absorbance of HI– at λ = 432 nm was very nearly constant (i.e., H2I was not significantly impacting the measurements), while absorbances at λ = 589 nm decreased substantially (Tables S2 and S5). At pH ≈ 1.6, [I2–]/[HI–] ≈ 10–4, which resulted in e1 values barely distinguishable from zero. The very low values obtained for e1 in this work means that errors in e1 will have a significant impact on pH calculations only at very low pH conditions (i.e., very low R values). As an example, the difference in pH calculated using e1 = 0.00049 compared to e1 values 30% larger and 30% smaller is <0.00001 at pH 6 and increases to only 0.001 at pH 4.
For e4, the value experimentally determined in this work at SP = 35 and T = 298.15 K (e4 = 0.0162; eq 4) is approximately 10% lower than the value calculated by Breland and Byrne (1992)27 (e4 = 0.0178) likely due to the absence of dye impurities in this work (Figure 1). Impurities in sulfonephthalein indicators characteristically absorb at short wavelengths (e.g., λ = 432 nm; Yao et al., 2007,55Figure 1). Given the very low absorbance of I2– at λ = 432 nm (i.e., A432 = 0.016 when A589 = 1.000), any light-absorbing impurities will cause erroneously high absorbances at 432 nm and thereby erroneously high values of e4.
log(K2SWe2) Calculations
Values of log(K2SWe2) for Breland and Byrne (1992)27 and Yao and Byrne (2001)26 were derived from their previous separate determinations of e2 and pK2. Figure S4 shows that the −log(K2e2) values predicted from eq 5 for T = 298.15 K are, on average, 0.032 higher than the results of Breland and Byrne (1992)27 (comparing over the range 29 ≤ SP ≤ 35) and 0.016 lower than the I = 0 value of Yao and Byrne (2001).51 In view of the substantial methodological differences among the three studies, this level of agreement is remarkably good. Yao and Byrne (2001),51 for example, used phosphate buffer characteristics appropriate at low ionic strength to calculate their log(K2SWe2) values, whereas the BCP log(K2e2) values of this work (eq 5, Table 3) are directly dependent on mCP log(K2e2) indicator properties that were determined using TRIS buffers characterized with Harned cells.4
It is important to note that the uncertainty in BCP log(K2e2) values is directly linked to the uncertainty in mCPpH (approximately 0.010; Orr et al. 2018).53 As such, the uncertainty of pH values obtained with BCP will be somewhat greater than 0.01 pH units. Notably, because the algorithms provided in this study (eqs 3, 4, and 5) are based on the molecular properties of purified BCP and are linked to the characterization of mCP, if BCP coefficients (Table 3) or mCP coefficients are refined in the future, historical pH data obtained using purified BCP can accordingly be easily revised.
Use of BCP to Measure pH
The pH-indicating range of any particular pH indicator dye depends on how log(K2e2) varies with T and SP. The algorithm developed in this work describes, for the first time, BCP log(K2e2) values over 0 ≤ SP ≤ 40 and 278.15 ≤ T ≤ 308.15 K, thereby providing pH measurement capabilities over wide-ranging conditions in rivers, estuaries, and oceans. Notably, this work provides, also for the first time, a basis for spectrophotometric determinations of alkalinity that include estuarine conditions, as well as procedures for eliminating alkalinity errors associated with the use of impure BCP.
The mid-point of the pH-indicating range of a sulfonephthalein indicator dye is determined by the physicochemical properties of the dye—specifically, its pK2 value (Table 1) as well as e4. The extent of the pH-indicating range (narrow or wide) about that mid-point is determined by the quality of the spectrophotometer used to measure A for a given application or experiment54 and is also influenced by the e4 value of the dye. For the purpose of characterizing indicator dyes (such as methods utilized in this work), it is essential that high-quality spectrophotometers (i.e., allowing measurements at A > 3) are used. However, accurate measurements of pH can still be achieved for general purposes using moderately priced spectrophotometers. If measurements are obtained using a lower specification spectrophotometer capable, nonetheless, of accurately measuring absorbances over an absorbance range of 0.05 ≤ A ≤ 1 (e.g., the Agilent 8453, which is often used for shipboard pH measurements), then corresponding conservative assessments of BCP absorbance ratios (0.05 ≤ R ≤ 20) can be used in conjunction with known BCP properties (eqs 3, 4, and 5 and Table 3) to describe the BCP pH-indicating range as a function of SP and T (Figure 4). For seawater of SP = 35 and T = 298.15 K, the pH-indicating range of BCP is thus shown to extend from pH 4.08 (Figure 4A) to 6.86 (Figure 4B). For freshwater (SP = 0, T = 298.15 K), the pH-indicating range extends from pH 4.72 (Figure 4C) to 7.49 (Figure 4D), on the order of 0.6 units higher than for seawater due to changes in indicator and H+ activity coefficient characteristics between low and high salinity waters.
Figure 4.

Dependence of pH on SP and T, as calculated using the BCP algorithm of this study (eqs 1, 3, 4, and 5) and the minimum and maximum R values that can be reliably measured with a typical seagoing spectrophotometer. The upper panels (a,b) are for seawater, and the lower panels (c,d) are for freshwater. The left panels (a,c) are for the case of R = 0.05, and the right panels (b,d) are for R = 20.
As discussed in Hudson-Heck and Byrne (2019),5 a more expensive and higher-quality spectrophotometer (e.g., the Cary 400, used for the benchtop studies of this work with periodically verified linearity) can enable accurate measurements at higher absorbances (e.g., A > 3) and therefore extend the range of R values used in pH measurements. In this case, the BCP pH-indicating range would be expanded substantially beyond what is shown in Figure 4. However, Hudson-Heck and Byrne (2019)5 also noted that the denominator of eq 1 indicates that R cannot exceed e4–1 (i.e., Re4 must be ≤1) and, as such, indicator dyes have an inherent maximum R value that is directly dependent on the magnitude of the e4 value of that dye. Because of this limitation, inaccuracies in pH calculations can become large as R closely approaches its maximum value.
Measurements of both BCP and mCP absorbance ratios performed in this study were made in solutions with 6.2 ≤ pH ≤ 7.0. Although measurements of mCPR were made at a pH slightly lower than the ideal indicating range of mCP, the magnitude of mCPRe4 in the denominator of eq 1 was small which minimized the uncertainty in mCPpH calculations. Conversely, measurements of BCPR were made at a pH slightly higher than the ideal indicating range of BCP. However, the BCP e4 value is uniquely low (∼0.016) and therefore BCP has a much higher inherent maximum R value than most other indicators. Therefore, since measurements of mCP and BCP were performed within appropriate ranges of R (determined by the value of e4 and the quality of the spectrophotometer), the upper bound uncertainty of the log R term in eq 1 [i.e., log((R – e1)/(1 – Re4))] can be estimated as ±0.005. In this case, combining the ±0.01 uncertainty of mCP pH53 with ±0.005 uncertainties for the log((R – e1)/(1 – Re4)) terms of both mCP and BCP, the uncertainty of the BCP log(K2e2) is calculated as ±0.012.
In this work, we measured e4 values of two unpurified batches of BCP (Kodak batch A8a and TCI batch WU III-FQ). Both batches of unpurified BCP showed very high levels of impurities compared to the pure e4 value determine in this study (pure = 0.016, Kodak = 0.133, and TCI = 0.165). Subsequently, these two unpurified batches of BCP were used to measure spectrophotometric pH along with corresponding pH measurements made with pure BCP. These measurements, performed in 0.7 M NaCl solutions over a range of pH from 3.8 to 5.3, highlight the large pH errors that can arise through the use of unpurified commercial batches of BCP. The use of unpurified BCP for these two batches of indicators (Kodak and TCI) produced pH errors (differences between pure and impure indicator) as large as 0.07 at pH 3.8 and as large as 0.2 at pH 5.3. These errors in measured pH using batches of unpurified commercial BCP are much greater than what has been observed for unpurified mCP.24,55 Notably, however, as the BCP characterizations of Yao and Byrne (2001)26 and Breland and Byrne (1992)27 are in substantial agreement with the purified-BCP characterizations obtained in the present work, the characteristics of commercial BCP are diverse and can include batches with low levels of impurities. Accordingly, the use of purified BCP is certainly the preferred option, and the use of unpurified batches of BCP should include purity-assessments. As a tool to quickly assess the impurity of a given batch of BCP, we suggest researchers perform measurements of e4 and compare the results to e4 values for pure BCP (eq 4). In addition, researchers should examine the absorbance spectra of each batch of BCP at pH ∼1.6 to confirm that the wavelength of maximum absorbance is at 432 nm.
For best practices, we recommend using purified BCP (not currently commercially available) to measure the pH of aqueous samples, but we also recognize that the process of purifying an indicator is laborious and time-consuming and may be out of reach for some investigators or even unnecessary for some applications. Douglas and Byrne (2017a)56 have outlined an alternative approach, whereby accurate pH measurements with mCP can be achieved via (a) absorbance measurements obtained using an off-the-shelf indicator in combination with (b) absorbance ratio corrections obtained using e4 values appropriate to the purified form of that indicator. Our eq 4 can be used with the procedure outlined in Table 1 of Douglas and Byrne (2017a)56 to correct absorbance ratios obtained with unpurified BCP. This method is described in detail in Douglas and Byrne (2017a).56 As a brief summary, (1) solutions of 0.7 M NaCl at pH 12 are prepared, (2) R values are measured using unpurified BCP, (3) absorbance contributions from impurities are calculated using eq 17 of Douglas and Byrne (2017a),56 and (4) using the absorbance contribution from the impurity at 432 nm, R values obtained with unpurified BCP are corrected to R values appropriate to purified BCP. It is important to note that this type of approach is appropriate for batches of unpurified BCP with moderate levels of impurities [such as those used by Breland and Byrne (1992)27 and Yao and Byrne (2001)].26 This correction procedure may be less effective for correcting BCP pH measurements that are obtained with high levels of impurities such as Kodak A8a and TCI WU III-FQ batches.
Use of BCP to Measure AT
Single-step spectrophotometric AT measurements2,26 rely on interpretations of BCP absorbance ratios and subsequent calculations of pH in order to quantify the residual acid that remains in a sample after acidification and then bubbling to remove CO2. To reduce errors in residual acid, we recommend using purified BCP. If, however, purified BCP is unavailable, then this work’s characterization of e4 (eq 4) can be used in combination with the procedure of Douglas and Byrne (2017a)56 to reduce errors caused by the use of off-the-shelf BCP for determinations of AT.
As an additional means of reducing AT errors in single-step acid addition methods,2,29 we recommend that titrations be performed such that the final pH (i.e., after acidification and bubbling) is above 4.5 (i.e., minimizing the concentration of the residual acid). In this case, errors in the measured pH [due to errors in log(K2e2)] propagate to produce only small errors in derived AT (Figure 5).2,29 Even for a systematic pH error as large as 0.02 (Figure 5 blue line), if the final pH is >4.5 then the contribution of this 0.02 unit pH error in the excess acid term to an error in AT is ≤1.8 μmol/kg. Accordingly, the use of impure indicators for single-step AT measurements, in conjunction with the correction procedure of Douglas and Byrne (2017a),56 should be sufficient to achieve accuracy well within the ±2 μmol/kg uncertainties typical of modern AT analyses.
Figure 5.

For single-step AT methods, influence of the error in log(K2e2) on uncertainty in derived AT [using the equations of Liu et al. (2015)2], expressed as a function of the final titration pH. AT values were calculated over a range of R using log(K2e2) values +0.01 and +0.02 units higher than the predicted value (eq 5). This figure illustrates the consequence of systematic pH errors [e.g., attributable to log(K2e2)] of 0.01 (red line) and 0.02 (blue line) on errors in derived AT values.
Conclusions
Purified and well-calibrated indicator dyes are essential, high-quality analytical tools for obtaining measurements of pH and other carbon system parameters in aqueous solutions. This study adds BCP to the suite of available sulfonephthalein indicators (Table 1) by (a) developing a method to purify BCP, (b) providing a characterization of purified BCP over 0 ≤ SP ≤ 40 and 278.15 ≤ T ≤ 308.15 K, and (c) reporting a key parameter (e4) needed to make spectrophotometric absorbance measurements using off-the-shelf BCP. This work thus enables accurate BCP-based pH measurements in freshwater, estuarine, and marine conditions; expands the use of sulfonephthalein indicators to include pH measurements in mildly acidic environments (e.g., alpine lakes, soils, and waters impacted by acid-mine drainage); and improves the accuracy and range of conditions that can be utilized in spectrophotometric AT measurements.
Experimental Section
Materials and Reagents
BCP (acid form) (Tokyo Chemical Industry, TCI, Batch WU III-FQ), mCP sodium salt (TCI, Batch M0074), high-performance liquid chromatography (HPLC)-grade ACN, high-purity TFA, and ultrapure bis–tris (≥98%) were purchased from Fisher Scientific. High purity sodium chloride (NaCl), calcium chloride (CaCl2), and potassium chloride (KCl) salts were purchased from MP Biomedicals, Sigma Aldrich, and Fisher Scientific, respectively. Seawater was collected from the surface waters of the open Gulf of Mexico. Purified mCP was obtained using the flash chromatographic method described in Patsavas et al. (2013a).57
BCP purification was performed using a Teledyne ISCO CombiFlash RF instrument and purification quality was assessed using a Waters Prep HPLC system. Multiple columns with different solid-phase compositions (e.g., Sielc PrimeSep B, Redisep Gold C18Aq, and Redisep Gold C18) were explored to optimize the purification method. The SP of each seawater solution was measured (±0.01) on a Guildline 8410A salinometer, and the temperature was measured (±0.05) with a Fisher Scientific, Traceable thermometer. BCP and mCP absorbance measurements were conducted using a Cary 400 Bio UV-VIS dual-beam spectrophotometer (bandwidth = 0.1 nm). Glass spectrophotometric cells (10 cm pathlength) housed in a custom-made thermostatted cell holder inside the Cary 400 were equilibrated to the desired temperature using a Lauda Ecoline E-100 circulating water bath. Acid titrations (performed in the course of the e1 and logK2e2 determinations) were monitored using an Orion pH electrode that had been spectrophotometrically calibrated using mCP.58,59
Absorbance Measurement Protocol
Each optical cell was first equilibrated to the desired T, and a blank absorbance measurement (i.e., solution only, with no added indicator dye) was recorded. For determinations of log(K2e2), paired cells of identical solution were used: one for the mCP measurements and one for the BCP measurements. After dye injection, absorbances were measured at the wavelengths of maximum absorbance for the dye (434λ and 578λ nm for mCP, and 432λ and 589λ nm for BCP). To account for pH perturbations resulting from indicator additions, each cell received two dye injections;23,24 observed R values could then be extrapolated to R values appropriate to zero added indicator. To correct for potential baseline shifts during measurements, absorbances at non-absorbing wavelengths (A730 for mCP and A750 for BCP) were also measured and used in the calculation of absorbance ratios
| 6 |
The volume of each indicator addition was chosen to maintain absorbance measurements within the linear range of the spectrophotometer (approximately 0.0–4.0 absorbance units for the Cary 400). For low-temperature conditions, dry nitrogen gas was directed at the cells’ optical surfaces to prevent condensation.
Purification of BCP
Multiple purification trials were performed to determine the optimal procedure for purifying BCP. Each purification began by dissolving unpurified indicator powder in Milli-Q water. The indicator was added to the purification column (∼20 mL) as a stock solution of 50 mM BCP plus 0.5% TFA. There were no solubility problems at this concentration of BCP. This stock solution was then loaded onto a flash purification column that had been saturated with 5% ACN. Separation of pure product from the impurities was continuously monitored from a control screen, and once the purified dye eluted off the column, the eluate was collected and its purity was HPLC-verified (Sielc PrimeSep B2 column, 70%, ACN, 30% Milli-Q water, 0.1% TFA). Residual mobile-phase solvents were removed from the eluate through evaporation (i.e., air-dried), and the resulting purified solid was then redissolved in Milli-Q water (10 mM) to produce a pure indicator solution for use in the BCP characterization experiments. Dissolution of the purified BCP solid was facilitated by incremental additions of sodium hydroxide (NaOH; 1 M) until the dissolution was complete (typically 200–300 μL of NaOH was required).
Determination of e1
Measurements of e1 (eq 2a) were conducted in a solution of NaCl (0.7 M; see the Results section for further details) using an open-top quartz spectrophotometric cell (10 cm pathlength) that was fitted with a lid to support an Orion pH electrode, an overhead stirring rod, and a temperature probe. BCP (∼6 μM) was added to the NaCl solution. A strong acid (HCl, 1 N) was used to titrate the NaCl solution to a pH at which 589A/432A reached a minimum (usually 1 ≤ pH ≤ 2). At low pH, the solution is well buffered solely by the presence of H+. Values of e1 were directly determined from absorbance ratios (e1 = 589A/432A) measured over a range of temperature: 288 ≤ T ≤ 305 K. An ionic strength of 0.7 M is approximately equivalent to SP = 35 in seawater.
Determination of e4
Measurements of e4 (eq 2d) were performed in artificial seawater at pH = 12, whereby [I2–]/[HI–] = 106. In a 4 L amber bottle, a stock solution of artificial seawater was prepared at SP = 40 (0.568 M NaCl, 0.072 M CaCl2, and 0.012 M KCl), largely following the recipe of DelValls and Dickson (1998).60 The MgCl2 and Na2SO4 of the original recipe were excluded from our formulation in order to avoid the formation of precipitates under the high-pH conditions required to maximize [I2–]. This stock artificial seawater was gravimetrically diluted to obtain a range of salinities (Table S4) and included the addition of sufficient NaOH (1 M) titrant to each solution to maintain a pH of 12 (0.01 M NaOH). Two dye injections were required for each e4 measurement. After the first injection, 589A was measured. After the second injection, 432A was measured. The second addition of indicator was used to increase the BCP concentration by a factor of ∼10 because 432εI2– is very small relative to 589εI2–. For both measurements, an additional wavelength (500λ) was monitored so that the ratio of absorbances after the second and the first injections (500A(2)/500A(1)) could be used to calculate the ratio of the BCP concentrations after the first and second indicator additions. This wavelength choice was not tightly constrained. Other wavelengths in the vicinity of 500 nm would have been equally suitable. Measurements were performed over ranges of salinity and temperature: 5 ≤ SP ≤ 40 and 278.15 ≤ T ≤ 308.15 K.
Determination of log(K2e2)
Values of log(K2e2) were determined using paired absorbance measurements, as described in Hudson-Heck and Byrne (2019).5 A stock solution of CO2-free seawater was prepared by using HCl (1 N) to acidify the solution to pH = 4.2 and subsequently purging the solution of CO2 with dry nitrogen gas. This acid titration was monitored using an Orion pH electrode calibrated spectrophotometrically with mCP.58 Bis–tris was added to the CO2-free seawater (approximately 1 mM) and, using HCl (1 M) or NaOH (1 M), the pH was adjusted to an R ratio at which the absorbances of BCP and mCP were within the linear range of the spectrophotometer (typically, at 6.2 ≤ pH ≤ 7.0, it is observed that 0.05 ≤ mCPR ≤ 0.07 and 7 ≤ BCPR ≤ 11). Measurements of log(K2e2) at low ionic strengths (I ≤ 0.0004) were performed in mixtures of Milli-Q water and bis–tris (1 mM). The ionic strengths and corresponding salinities of these solutions were calculated from the concentrations of added HCl.
The glass spectrophotometric cells (one cell for mCP and another cell for BCP) used for the measurements were filled with bis–tris buffered solutions (using Teflon tubing) and allowed to overflow for ∼20 s. Absorbance measurements were collected following the protocol outlined in the Absorbance Measurement Protocol section. The paired measurements of mCP and BCP absorbance ratios were each obtained in triplicate. Each aliquot of sample solution received two dye injections, allowing extrapolation of observed absorbance ratios to R values appropriate to zero added indicator.5,23,61 The perturbation correction is essential for obtaining accurate absorbance ratio measurements in weakly buffered solutions (i.e., seawater or Milli-Q water with bis–tris). The corrected R values for mCP and BCP were then used to calculate either the solution mCPpH (mCP aliquot) or an absorbance ratio (BCP aliquot). Finally, using mCPpH and BCPR, values of log(K2e2) for BCP were calculated using eq 1 over ranges of salinity and temperature (0 ≤ SP ≤ 40 and 278.15 ≤ T ≤ 308.15 K).
Fitting Procedure for log(K2e2) Data Sets
Using the programming code CO2SYS,62 log(K2e2) results were reported on both the total and seawater scales for compatibility with previous results reported on these two pH scales: measurements of mCPpH on the total scale were converted to equivalent values of mCPpH on the seawater scale, and these values were subsequently used to determine log(K2e2) on the seawater scale. Both data sets (total and seawater scales) were fit as functions of salinity and temperature using the “stats” package of the programming language “R”.63 Coefficients were added or subtracted from the model in a stepwise fashion until p < 0.05 for all terms and the residual sum of squares was at a minimum. For each set of triplicate R measurements, the average temperature over the three measurements was used.
Acknowledgments
Support for this work was provided by the National Science Foundation (award OCE-1657894) as well as the C.W. Bill Young Fellowship Program Fund and the Carl Riggs Fellowship in Marine Science, both provided by the University of South Florida, College of Marine Science. We would like to thank Tonya Clayton for her thoughtful editing of early versions of this manuscript. We also thank four anonymous reviewers for their valuable perspectives. The authors declare that there are no conflicts of interest.
Supporting Information Available
The Supporting Information is available free of charge at https://pubs.acs.org/doi/10.1021/acsomega.1c01579.
Supplemental purification method; data tables for e1, e4, and log(K2e2) results; figure of various unpurified BCP batches; figure of flash column during purification; figure of e4 model fits; and figure of log(K2e2) comparison data (PDF)
The authors declare no competing financial interest.
Supplementary Material
References
- Patsavas M. C.; Byrne R. H.; Liu X. Physical–chemical characterization of purified cresol red for spectrophotometric pH measurements in seawater. Mar. Chem. 2013b, 155, 158–164. 10.1016/j.marchem.2013.06.007. [DOI] [Google Scholar]
- Liu X.; Byrne R. H.; Lindemuth M.; Easley R.; Mathis J. T. An Automated Procedure for Laboratory and Shipboard Spectrophotometric Measurements of Seawater Alkalinity: Continuously Monitored Single-Step Acid Additions. Mar. Chem. 2015, 174, 141–146. 10.1016/j.marchem.2015.06.008. [DOI] [Google Scholar]
- Douglas N. K.; Byrne R. H. Spectrophotometric PH Measurements from River to Sea: Calibration of MCP for 0≤S≤40 and 278.15≤T≤308.15K. Mar. Chem. 2017, 197, 64–69. 10.1016/j.marchem.2017.10.001. [DOI] [Google Scholar]
- Müller J. D.; Rehder G. Metrology of PH Measurements in Brackish Waters—Part 2: Experimental Characterization of Purified Meta-Cresol Purple for Spectrophotometric PHT Measurements. Front. Mar. Sci. 2018, 5, 177. 10.3389/fmars.2018.00177. [DOI] [Google Scholar]
- Hudson-Heck E.; Byrne R. H. Purification and Characterization of Thymol Blue for Spectrophotometric PH Measurements in Rivers, Estuaries, and Oceans. Anal. Chim. Acta 2019, 1090, 91–99. 10.1016/j.aca.2019.09.009. [DOI] [PubMed] [Google Scholar]
- Feely R. A.; Wanninkhof R.; Cosca C. E.; McPhaden M. J.; Byrne R. H.; Millero F. J.; Chavez F. P.; Clayton T.; Campbell D. M.; Murphy P. P. The Effect of Tropical Instability Waves on CO2 Species Distributions along the Equator in the Eastern Equatorial Pacific during the 1992 ENSO Event. Geophys. Res. Lett. 1994, 21, 277–280. 10.1029/93gl03212. [DOI] [Google Scholar]
- Mosley L. M.; Husheer S. L. G.; Hunter K. A. Spectrophotometric PH Measurement in Estuaries Using Thymol Blue and M-Cresol Purple. Mar. Chem. 2004, 91, 175–186. 10.1016/j.marchem.2004.06.008. [DOI] [Google Scholar]
- Hammer K.; Schneider B.; Kuliński K.; Schulz-Bull D. E. Precision and Accuracy of Spectrophotometric PH Measurements at Environmental Conditions in the Baltic Sea. Estuar. Coast Shelf Sci. 2014, 146, 24–32. 10.1016/j.ecss.2014.05.003. [DOI] [Google Scholar]
- Lai C. Z.; DeGrandpre M. D.; Wasser B. D.; Brandon T. A.; Clucas D. S.; Jaqueth E. J.; Benson Z. D.; Beatty C. M.; Spaulding R. S. Spectrophotometric Measurement of Freshwater PH with Purified Meta-Cresol Purple and Phenol Red. Limnol. Oceanogr.: Methods 2016, 14, 864–873. 10.1002/lom3.10137. [DOI] [Google Scholar]
- Rérolle V.; Ruiz-Pino D.; Rafizadeh M.; Loucaides S.; Papadimitriou S.; Mowlem M.; Chen J. Measuring PH in the Arctic Ocean: Colorimetric Method or SeaFET?. Methods Oceanogr. 2016, 17, 32–49. 10.1016/j.mio.2016.05.006. [DOI] [Google Scholar]
- Loucaides S.; Rèrolle V. M. C.; Papadimitriou S.; Kennedy H.; Mowlem M. C.; Dickson A. G.; Gledhill M.; Achterberg E. P. Characterization of Meta -Cresol Purple for Spectrophotometric PH Measurements in Saline and Hypersaline Media at Sub-Zero Temperatures. Sci. Rep. 2017, 7, 2481. 10.1038/s41598-017-02624-0. [DOI] [PMC free article] [PubMed] [Google Scholar]
- Yao H.; Hu X. Responses of Carbonate System and CO2 Flux to Extended Drought and Intense Flooding in a Semiarid Subtropical Estuary. Limnol. Oceanogr. 2017, 62, S112–S130. 10.1002/lno.10646. [DOI] [Google Scholar]
- Hu X.; Nuttall M. F.; Wang H.; Yao H.; Staryk C. J.; McCutcheon M. R.; Eckert R. J.; Embesi J. A.; Johnston M. A.; Hickerson E. L.; Schmahl G. P.; Manzello D.; Enochs I. C.; DiMarco S.; Barbero L. Seasonal Variability of Carbonate Chemistry and Decadal Changes in Waters of a Marine Sanctuary in the Northwestern Gulf of Mexico. Mar. Chem. 2018, 205, 16–28. 10.1016/j.marchem.2018.07.006. [DOI] [Google Scholar]
- Zhang H.; Byrne R. H. Spectrophotometric PH Measurements of Surface Seawater at In-Situ Conditions: Absorbance and Protonation Behavior of Thymol Blue. Mar. Chem. 1996, 52, 17–25. 10.1016/0304-4203(95)00076-3. [DOI] [Google Scholar]
- Bellerby R.; Olsen A.; Johannessen T.; Croot P. A High Precision Spectrophotometric Method for On-Line Shipboard Seawater PH Measurements: The Automated Marine PH Sensor (AMpS). Talanta 2002, 56, 61–69. 10.1016/s0039-9140(01)00541-0. [DOI] [PubMed] [Google Scholar]
- Ohline S. M.; Reid M. R.; Husheer S. L. G.; Currie K. I.; Hunter K. A. Spectrophotometric Determination of PH in Seawater off Taiaroa Head, Otago, New Zealand: Full-Spectrum Modelling and Prediction of PCO2 Levels. Mar. Chem. 2007, 107, 143–155. 10.1016/j.marchem.2007.06.018. [DOI] [Google Scholar]
- Reggiani E. R.; King A. L.; Norli M.; Jaccard P.; Sørensen K.; Bellerby R. G. J. FerryBox-Assisted Monitoring of Mixed Layer PH in the Norwegian Coastal Current. J. Mar. Syst. 2016, 162, 29–36. 10.1016/j.jmarsys.2016.03.017. [DOI] [Google Scholar]
- Gilmore R. E.; Challener R.; Guenther R.; Newcomb L.; Rickards K.. Variations in Tide Pool Carbonate Chemistry and Temperature, 2011.
- French C. R.; Carr J. J.; Dougherty E. M.; Eidson L. A. K.; Reynolds J. C.; DeGrandpre M. D. Spectrophotometric PH Measurements of Freshwater. Anal. Chim. Acta 2002, 453, 13–20. 10.1016/s0003-2670(01)01509-4. [DOI] [Google Scholar]
- Gibson J. A. E.; Trull T. W. Annual Cycle of FCO2 under Sea-Ice and in Open Water in Prydz Bay, East Antarctica. Mar. Chem. 1999, 66, 187–200. 10.1016/s0304-4203(99)00040-7. [DOI] [Google Scholar]
- Shetye S. S.; Mohan R.; Patil S.; Jawak S.; Nair A.; Warrier A. K.; Badnal M.; Shirodkar R. Hidden Biogeochemical Anonymities under Antarctic Fast Ice. Reg. Stud. Mar. Sci. 2019, 31, 100789. 10.1016/j.rsma.2019.100789. [DOI] [Google Scholar]
- Byrne R. H.; Breland J. A. High Precision Multiwavelength PH Determinations in Seawater Using Cresol Red. Deep-Sea Res., Part A 1989, 36, 803–810. 10.1016/0198-0149(89)90152-0. [DOI] [Google Scholar]
- Clayton T. D.; Byrne R. H. Spectrophotometric Seawater PH Measurements: Total Hydrogen Ion Concentration Scale Calibration of m-Cresol Purple and at-Sea Results. Deep Sea Res., Part I 1993, 40, 2115–2129. 10.1016/0967-0637(93)90048-8. [DOI] [Google Scholar]
- Liu X.; Patsavas M. C.; Byrne R. H. Purification and Characterization of Meta-Cresol Purple for Spectrophotometric Seawater PH Measurements. Environ. Sci. Technol. 2011, 45, 4862–4868. 10.1021/es200665d. [DOI] [PMC free article] [PubMed] [Google Scholar]
- Robert-Baldo G. L.; Morris M. J.; Byrne R. H. Spectrophotometric Determination of Seawater PH Using Phenol Red. Anal. Chem. 1985, 57, 2564–2567. 10.1021/ac00290a030. [DOI] [Google Scholar]
- Yao W.; Byrne R. H. Spectrophotometric Determination of Freshwater PH Using Bromocresol Purple and Phenol Red. Environ. Sci. Technol. 2001, 35, 1197–1201. 10.1021/es001573e. [DOI] [PubMed] [Google Scholar]
- Breland J. A.; Byrne R. H. Determination of Sea Water Alkalinity by Direct Equilibration with Carbon Dioxide. Anal. Chem. 1992, 64, 2306–2309. 10.1021/ac00043a022. [DOI] [Google Scholar]
- Breland J. A.; Byrne R. H. Spectrophotometric Procedures for Determination of Sea Water Alkalinity Using Bromocresol Green. Deep Sea Res., Part I 1993, 40, 629–641. 10.1016/0967-0637(93)90149-w. [DOI] [Google Scholar]
- Yao W.; Byrne R. H. Simplified Seawater Alkalinity Analysis: Use of Linear Array Spectrometers. Deep Sea Res., Part I 1998, 45, 1383–1392. 10.1016/s0967-0637(98)00018-1. [DOI] [Google Scholar]
- Byrne R. H.; Liu X.; Kaltenbacher E. A.; Sell K. Spectrophotometric Measurement of Total Inorganic Carbon in Aqueous Solutions Using a Liquid Core Waveguide. Anal. Chim. Acta 2002, 451, 221–229. 10.1016/s0003-2670(01)01423-4. [DOI] [Google Scholar]
- Liu X.; Byrne R. H.; Adornato L.; Yates K. K.; Kaltenbacher E.; Ding X.; Yang B. In Situ Spectrophotometric Measurement of Dissolved Inorganic Carbon in Seawater. Environ. Sci. Technol. 2013, 47, 11106–11114. 10.1021/es4014807. [DOI] [PubMed] [Google Scholar]
- DeGrandpre M. D.; Hammar T. R.; Smith S. P.; Sayles F. L. In Situ Measurements of Seawater PCO2. Limnol. Oceanogr. 1995, 40, 969–975. 10.4319/lo.1995.40.5.0969. [DOI] [Google Scholar]
- Wang Z. A.; Liu X.; Byrne R. H.; Wanninkhof R.; Bernstein R. E.; Kaltenbacher E. A.; Patten J. Simultaneous Spectrophotometric Flow-through Measurements of PH, Carbon Dioxide Fugacity, and Total Inorganic Carbon in Seawater. Anal. Chim. Acta 2007, 596, 23–36. 10.1016/j.aca.2007.05.048. [DOI] [PubMed] [Google Scholar]
- Cuyler E. E.; Byrne R. H. Spectrophotometric Calibration Procedures to Enable Calibration-Free Measurements of Seawater Calcium Carbonate Saturation States. Anal. Chim. Acta 2018, 1020, 95–103. 10.1016/j.aca.2018.02.071. [DOI] [PubMed] [Google Scholar]
- Yang B.; Byrne R. H.; Lindemuth M. Contributions of Organic Alkalinity to Total Alkalinity in Coastal Waters: A Spectrophotometric Approach. Mar. Chem. 2015, 176, 199–207. 10.1016/j.marchem.2015.09.008. [DOI] [Google Scholar]
- Liu X.; Wang Z. A.; Byrne R. H.; Kaltenbacher E. A.; Bernstein R. E. Spectrophotometric Measurements of PH In-Situ: Laboratory and Field Evaluations of Instrumental Performance. Environ. Sci. Technol. 2006, 40, 5036–5044. 10.1021/es0601843. [DOI] [PubMed] [Google Scholar]
- Aßmann S.; Frank C.; Körtzinger A. Spectrophotometric High-Precision Seawater PH Determination for Use in Underway Measuring Systems. Ocean Sci. 2011, 7, 597–607. 10.5194/os-7-597-2011. [DOI] [Google Scholar]
- Adornato L.; Kaltenbacher E.; Byrne R. H.; Liu X.; Sharp J.. Development of a Portable Carbon System Sensor for Ocean Acidification Research. OCEANS 2016 MTS/IEEE Monterey, 2016; pp 1–7.
- Lai C.-Z.; DeGrandpre M. D.; Darlington R. C. Autonomous Optofluidic Chemical Analyzers for Marine Applications: Insights from the Submersible Autonomous Moored Instruments (SAMI) for PH and PCO2. Front. Mar. Sci. 2018, 4, 438. 10.3389/fmars.2017.00438. [DOI] [Google Scholar]
- Seidel M. P.; DeGrandpre M. D.; Dickson A. G. A Sensor for in Situ Indicator-Based Measurements of Seawater PH. Mar. Chem. 2008, 109, 18–28. 10.1016/j.marchem.2007.11.013. [DOI] [Google Scholar]
- Spaulding R. S.; DeGrandpre M. D.; Beck J. C.; Hart R. D.; Peterson B.; De Carlo E. H.; Drupp P. S.; Hammar T. R. Autonomous in Situ Measurements of Seawater Alkalinity. Environ. Sci. Technol. 2014, 48, 9573–9581. 10.1021/es501615x. [DOI] [PubMed] [Google Scholar]
- von Langen P. J.; Johnson K. S.; Coale K. H.; Elrod V. A. Oxidation Kinetics of Manganese (II) in Seawater at Nanomolar Concentrations. Geochim. Cosmochim. Acta 1997, 61, 4945–4954. 10.1016/s0016-7037(97)00355-4. [DOI] [Google Scholar]
- Zafiriou O. C.; Voelker B. M.; Sedlak D. L. Chemistry of the Superoxide Radical (O2-) in Seawater: Reactions with Inorganic Copper Complexes. J. Phys. Chem. A 1998, 102, 5693–5700. 10.1021/jp980709g. [DOI] [Google Scholar]
- Soli A. L.; Byrne R. H. CO2 System Hydration and Dehydration Kinetics and the Equilibrium CO2/H2CO3 Ratio in Aqueous NaCl Solution. Mar. Chem. 2002, 78, 65–73. 10.1016/s0304-4203(02)00010-5. [DOI] [Google Scholar]
- Byrne R. H.; Yao W.; Klochko K.; Tossell J. A.; Kaufman A. J. Experimental Evaluation of the Isotopic Exchange Equilibrium 10B(OH)3+11B(OH)4–=11B(OH)3+10B(OH)4– in Aqueous Solution. Deep Sea Res., Part I 2006, 53, 684–688. 10.1016/j.dsr.2006.01.005. [DOI] [Google Scholar]
- Klochko K.; Kaufman A. J.; Yao W.; Byrne R. H.; Tossell J. A. Experimental Measurement of Boron Isotope Fractionation in Seawater. Earth Planet. Sci. Lett. 2006, 248, 276–285. 10.1016/j.epsl.2006.05.034. [DOI] [Google Scholar]
- Kranz S. A.; Young J. N.; Hopkinson B. M.; Goldman J. A. L.; Tortell P. D.; Morel F. M. M. Low Temperature Reduces the Energetic Requirement for the CO2 Concentrating Mechanism in Diatoms. New Phytol. 2015, 205, 192–201. 10.1111/nph.12976. [DOI] [PubMed] [Google Scholar]
- Young J. N.; Kranz S.; Goldman J.; Tortell P.; Morel F. Antarctic Phytoplankton Down-Regulate Their Carbon-Concentrating Mechanisms under High CO2 with No Change in Growth Rates. Mar. Ecol.: Prog. Ser. 2015, 532, 13–28. 10.3354/meps11336. [DOI] [Google Scholar]
- Bargrizan S.; Smernik R. J.; Mosley L. M. Spectrophotometric Measurement of the PH of Soil Extracts Using a Multiple Indicator Dye Mixture. Eur. J. Soil Sci. 2019, 70, 411–420. 10.1111/ejss.12745. [DOI] [Google Scholar]
- Bargrizan S.; Smernik R. J.; Mosley L. M. Development of a Spectrophotometric Method for Determining PH of Soil Extracts and Comparison with Glass Electrode Measurements. Soil Sci. Soc. Am. J. 2017, 81, 1350–1358. 10.2136/sssaj2017.04.0119. [DOI] [Google Scholar]
- Byrne R. H.; Robert-Baldo G.; Thompson S. W.; Chen C. T. A. Seawater PH Measurements: An at-Sea Comparison of Spectrophotometric and Potentiometric Methods. Deep-Sea Res., Part A 1988, 35, 1405–1410. 10.1016/0198-0149(88)90091-x. [DOI] [Google Scholar]
- Dickson A. G. PH Scales and Proton-Transfer Reactions in Saline Media Such as Sea Water. Geochim. Cosmochim. Acta 1984, 48, 2299–2308. 10.1016/0016-7037(84)90225-4. [DOI] [Google Scholar]
- Orr J. C.; Epitalon J.-M.; Dickson A. G.; Gattuso J.-P. Routine Uncertainty Propagation for the Marine Carbon Dioxide System. Mar. Chem. 2018, 207, 84–107. 10.1016/j.marchem.2018.10.006. [DOI] [Google Scholar]
- DeGrandpre M. D.; Spaulding R. S.; Newton J. O.; Jaqueth E. J.; Hamblock S. E.; Umansky A. A.; Harris K. E. Considerations for the Measurement of Spectrophotometric PH for Ocean Acidification and Other Studies. Limnol. Oceanogr.: Methods 2014, 12, 830–839. 10.4319/lom.2014.12.830. [DOI] [Google Scholar]
- Yao W.; Liu X.; Byrne R. H. Impurities in Indicators Used for Spectrophotometric Seawater PH Measurements: Assessment and Remedies. Mar. Chem. 2007, 107, 167–172. 10.1016/j.marchem.2007.06.012. [DOI] [Google Scholar]
- Douglas N. K.; Byrne R. H. Achieving Accurate Spectrophotometric PH Measurements Using Unpurified Meta-Cresol Purple. Mar. Chem. 2017, 190, 66–72. 10.1016/j.marchem.2017.02.004. [DOI] [Google Scholar]
- Patsavas M. C.; Byrne R. H.; Liu X. Purification of meta-cresol purple and cresol red by flash chromatography: Procedures for ensuring accurate spectrophotometric seawater pH measurements. Mar. Chem. 2013a, 150, 19–24. 10.1016/j.marchem.2013.01.004. [DOI] [Google Scholar]
- Easley R. A.; Byrne R. H. Spectrophotometric Calibration of PH Electrodes in Seawater Using Purified M-Cresol Purple. Environ. Sci. Technol. 2012, 46, 5018–5024. 10.1021/es300491s. [DOI] [PMC free article] [PubMed] [Google Scholar]
- Martell-Bonet L.; Byrne R. H. Characterization of the Nonlinear Salinity Dependence of Glass PH Electrodes: A Simplified Spectrophotometric Calibration Procedure for Potentiometric Seawater PH Measurements at 25 °C in Marine and Brackish Waters: 0.5 ≤ S ≤ 36. Mar. Chem. 2020, 220, 103764. 10.1016/j.marchem.2020.103764. [DOI] [Google Scholar]
- DelValls T. A.; Dickson A. G. The PH of Buffers Based on 2-Amino-2-Hydroxymethyl-1,3-Propanediol (‘Tris’) in Synthetic Sea Water. Deep Sea Res., Part I 1998, 45, 1541–1554. 10.1016/s0967-0637(98)00019-3. [DOI] [Google Scholar]
- Dickson A. G.; Sabine C. L.; Christian J. R.. Guide to Best Practices for Ocean CO2 Measurements; North Pacific Marine Science Organization, 2007. [Google Scholar]
- Pierrot D.; Lewis E.; Wallace D. W. R.. CO2SYS DOS Program Developed for CO2 System Calculations. ORNL/CDIAC-105. Carbon Dioxide Information Analysis, 2006.
- R Core Team . R: A Language and Environment for Statistical Computing; R Foundation for Statistical Computing, URL https://www.R-Project.Org/; 2020.
Associated Data
This section collects any data citations, data availability statements, or supplementary materials included in this article.