Abstract
Aflatoxin B1 (AFB1) is a mutagen that has been categorized as a group 1 human carcinogen by the International Agency for Research on Cancer. It is produced as a secondary metabolite by soil fungi Aspergillus flavus and Aspergillus parasiticus. Here, in this study, the effect of AFB1 on the structure and conformation of bovine serum albumin (BSA) using multispectroscopic tools like fluorescence spectroscopy, ultraviolet–visible absorption spectroscopy, and circular dichroism spectropolarimetry has been ascertained. Ultraviolet absorption spectroscopy revealed hyperchromicity in the absorption spectra of BSA in the presence of AFB1. The binding constant was calculated in the range of 104 M–1, by fluorescence spectroscopy suggesting moderate binding of the toxin to BSA. The study also confirms the static nature of fluorescence quenching. The stoichiometry of binding sites was found to be unity. The competing capability of warfarin for AFB1 was higher than ibuprofen as calculated from site marker displacement assay. Förster resonance energy transfer confirmed the high efficiency of energy transfer from BSA to AFB1. Circular dichroism spectropolarimetry showed a decrease in the α-helix in BSA in the presence of AFB1. The melting temperature of BSA underwent an increment in the presence of a mycotoxin from 62.5 to 70.3 °C. Molecular docking confirmed the binding of AFB1 to subdomain IIA in BSA.
Highlights
In this study, binding dynamics of AFB1 with BSA were explored by UV absorption spectroscopy, fluorescence spectroscopy, and molecular docking.
The study revealed that AFB1 binds to BSA with a binding constant (Kb) of 4.20 × 10⁴ M–1 involving a static type of fluorescence quenching mechanism.
Site marker displacement assay suggests subdomain IIA as the binding site of AFB1 on BSA.
Thermodynamic parameters like negative ΔH and ΔS highlight hydrogen bonding and van der Waals interactions as significant players in stabilizing the BSA–AFB1 complex.
Circular dichroism investigation showed alteration in the secondary structure of native BSA in the presence of AFB1 followed by an increase in melting temperature (Tm).
Molecular docking analysis substantiated that Arg-217, Tyr-149, Arg-256, and Ala-260 residues stabilize the interacting complex via hydrogen bonding.
1. Introduction
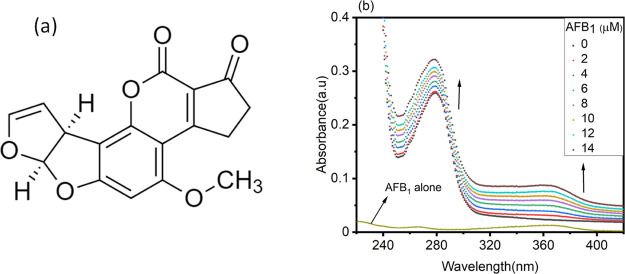
Aflatoxin B1 is an environmental hazard that has been enlisted as a group 1 human carcinogen by the International Agency for Research on Cancer.1,2 It is a potent mutagen produced by Aspergillus flavus and Aspergillus parasiticus as a secondary metabolite.3 It is known to contaminate various food crops and animal feeds, corresponding to one-fourth of globally produced feed ingredients.4 Aflatoxin-producing fungi are ubiquitously present in the environment and can also be detected in stored foods. Mycotoxins like AFB1, AFB2, AFG1, and AFG2 are produced exclusively by Aspergilli in crops, and among them, AFB1 is the most toxic and caracinogenic;5 their order of toxicity is AFB1 > AFG1 > AFB2 > AFG2.6 AFB1 is teratogenic, mutagenic, and hepatotoxic to farm animals and humans.7−9 The structure of AFB1 resembles coumarin with a fused difuran moiety as shown in Figure 1a, absorbs ultraviolet light with absorption maxima (λmax) at 365 nm, and has strong fluorescence emission in the wavelength range of 415–450 nm.10,11 AFB1 was discovered accidentally in the 1960s due to the massive destruction of about 100,000 domestic turkeys in England after the consumption of AFB1-contaminated groundnut meal.12
Figure 1.
(a) Chemical structure of AFB1. (b) UV absorption spectra of BSA (5 μM) in the absence and presence of increasing concentrations of AFB1 (0–14 μM). The concentration of AFB1 alone is 2 μM.
Bovine serum albumin (BSA) is the most abundant serum protein present in bovines containing 583 amino acid residues. It includes two tryptophan residues at 134 and 212 positions and 20 tyrosine residues.13,14 This globular protein has a molecular weight of 66.4 kDa with a predominant α-helix conformation.15 Due to approximately 80% sequence homology with human serum albumin (HSA), it is a highly explored and widely studied serum protein.13,16 BSA is known to contain two discrete drug binding sites known as Sudlow’s site I and Sudlow’s site II located in subdomains IIA and IIIA, respectively, where different groups of drugs bind.17 It has been a widely used model protein for interaction studies with drugs and is a critical element of drug pharmacokinetics.18
Serum albumin is the carrier protein in blood and has a critical role in the delivery and transportation of endogenous and exogenous molecules.19 Serum albumin is besieged with the entry of any ligand molecule in the body by virtue of its delivery and transportation ability to target location.20 The solubility, biodistribution, and interaction of any ligand molecule depend upon its affinity for serum albumin. As a result, the free drug concentration in plasma decreases with the strong binding affinity of the drug with albumin and vice versa.21 Therefore, it becomes crucial to understand the interaction pattern of AFB1 with BSA.
In this study, multispectroscopic analysis and molecular docking approaches have been used to examine the binding of hepatocarcinogen AFB1 with carrier protein BSA. UV absorption spectroscopy was performed to speculate the ground-state complex formation of this toxin with BSA. Fluorescence spectroscopy was performed to calculate the binding constant (Kb), the Stern–Volmer quenching constant (KSV), the number of binding sites, and various thermodynamic parameters like the Gibb’s free-energy change (ΔG), the enthalpy change (ΔH), and the entropy change (ΔS). Site marker displacement assay was performed with warfarin and ibuprofen site marker probes to elucidate the binding location of AFB1 on BSA. FRET was conducted to ascertain the efficiency of energy transfer between BSA and AFB1. A molecular docking approach was used to investigate and recognize the amino acid residues involved in forming the binding pocket for the AFB1–BSA complex.
2. Results and Discussion
2.1. UV Absorption Spectroscopic Studies
UV absorption spectroscopy, a versatile technique, was performed to explore the structural alterations in the protein in the presence of AFB1. Figure 1 shows the absorption spectra of BSA in the absence and presence of AFB1 (0–14 μM). BSA demonstrates a characteristic absorption peak at ∼280 nm due to π to π* transition of aromatic amino acids in the protein.22 The absorption spectrum of BSA is mainly due to the absorption of ultraviolet light by tryptophan, tyrosine, and phenylalanine residues.23 In the presence of AFB1 (0–14 μM), there is a concentration-dependent hyperchromic effect at 280 nm. Each concentration from 2 to 14 μM causes an increase in the absorbance at 280 nm, suggesting concentration-dependent hyperchromicity at 280 nm in BSA. The increase in absorbance indicates the ground-state complex formation between BSA and AFB1.24 AFB1 exhibits its characteristic absorption peak at around 365 nm due to UV light absorption in this region, as visible in Figure 1b. From the figure, it can be inferred that the nature of quenching is static rather than dynamic quenching.25 In static quenching, the absorption spectra of protein molecules change in the presence of a ligand, which is not valid in the case of dynamic quenching, where the absorption spectra do not alter in the presence of a ligand.26 The nature of quenching is discussed in detail in Section 2.2.
2.2. Fluorescence Spectroscopy-Based Studies
Fluorescence spectroscopic studies are highly reliable and the best method for locating small molecules’ binding fashion to proteins.27 The intrinsic fluorescence in the BSA molecule is mainly contributed by tryptophan (Trp), tyrosine (Tyr), and phenylalanine (Phe) residues.28 Tryptophan in BSA is highly sensitive to perturbation in the local environment due to denaturation or conformational alterations.29 The emission spectra of BSA (5 μM) in the absence and presence of AFB1 (0–14 μM) are shown in Figure 2a. Fluorescence quenching followed by 3 nm of a blueshift in the fluorescence emission spectrum of BSA was observed when titrated with the increasing concentration of AFB1 (0–14 μM). From Figure 2a, it is clear that the microenvironment around the fluorophores in BSA is altered. However, quenching in the emission spectra of BSA indicates the structural and conformational change in the native structure of BSA. Figure 2b shows the fluorescence emission spectra of AFB1 in the absence and presence of BSA (0–2.5 μM). AFB1 shows emission maxima at 440 nm when excited at 365 nm. When AFB1 was titrated with increasing concentrations of BSA, an increase in the fluorescence intensity coupled with 3 nm of a blueshift at the emission maximum of AFB1 was observed. This also confers the migration of AFB1 from a more polar to less polar environment in the presence of BSA.
Figure 2.
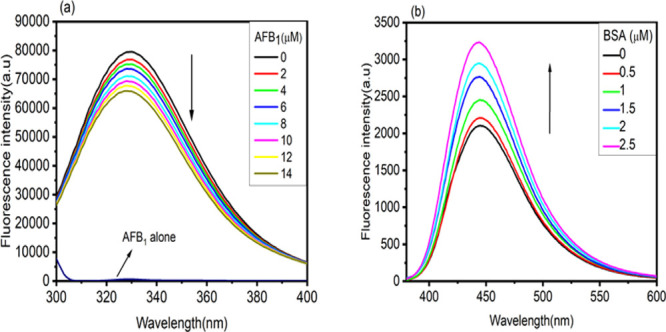
(a) Fluorescence emission spectra of BSA (5 μM) with increasing concentrations of AFB1 (0–14 μM). The concentration of AFB1 alone is 2 μM. (b) AFB1 spectra with increasing concentrations of BSA (0–2.5 μM).
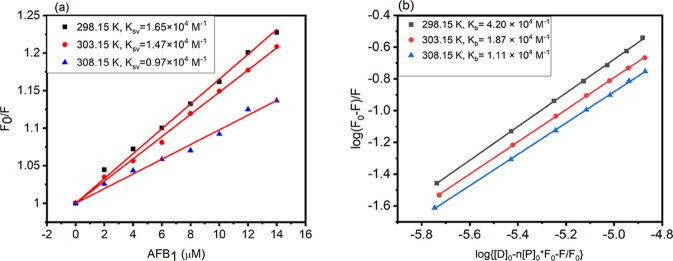
To further investigate the mode of quenching observed in BSA in the presence of AFB1, the Stern–Volmer quenching constant (KSV) was calculated from eq 9 of the Methods section.30 From Figure 3a, it was found that the F0/F versus Q (concentration of AFB1) plot is a straight line, and there is a linear dependency of the AFB1 concentration (Q) and ΔF. With the increase in the temperature, the slope of the Stern–Volmer plot decreases. The binding between AFB1 and BSA destabilizes, reducing the KSV value, which suggests that quenching is static, thereby justifying the static or dynamic nature of the quenching mechanism operating between the ligand and the protein molecules.31 The values of KSV obtained at 288.15, 303.15, and 308.15 K, in the order of decreasing magnitude as a function of temperature, are 1.65 × 10⁴, 1.47 × 10⁴, and 0.97 × 10⁴ M–1, respectively. The bimolecular quenching constant (Kq) was calculated by employing eq 11 mentioned in the Methods section.32 The values of Kq obtained at 298.15, 303.15, and 308.15 K are 1.65 × 10¹³, 1.47 × 10¹³, and 0.97 × 10¹³ M–1 s–1. Since the values of Kq obtained are higher than the maximum scattering collision constant (2 × 10¹⁰ M–1 s–1),33 this provides a clue that fluorescence quenching is governed by ground-state BSA–AFB1 complex formation and is static in nature. The values of KSV and Kq are listed in Table 1.
Figure 3.
(a) Stern–Volmer quenching constant (KSV) and (b) binding constant (Kb) obtained from the plot of log(F0 – F)/F versus log{[D]0 – n[P]0(F0 – F)/F0} for the BSA–AFB1 complex at three different temperatures (298.15, 303.15, and 308.15 K).
Table 1. Stern–Volmer Quenching Constant (KSV) and Bimolecular Quenching Constant (Kq) at Three Different Temperatures, 298.15, 303.15, and 308.15 K for the BSA–AFB1 Complex.
| temperature (K) | KSV (×104) (M–1) | Kq (×1013) (M–1 s–1) | R2 | SD |
|---|---|---|---|---|
| 298.15 | 1.65 | 1.65 | 0.999 | 0.0002 |
| 303.15 | 1.47 | 1.47 | 0.999 | 0.0001 |
| 308.15 | 0.97 | 0.97 | 0.999 | 0.0002 |
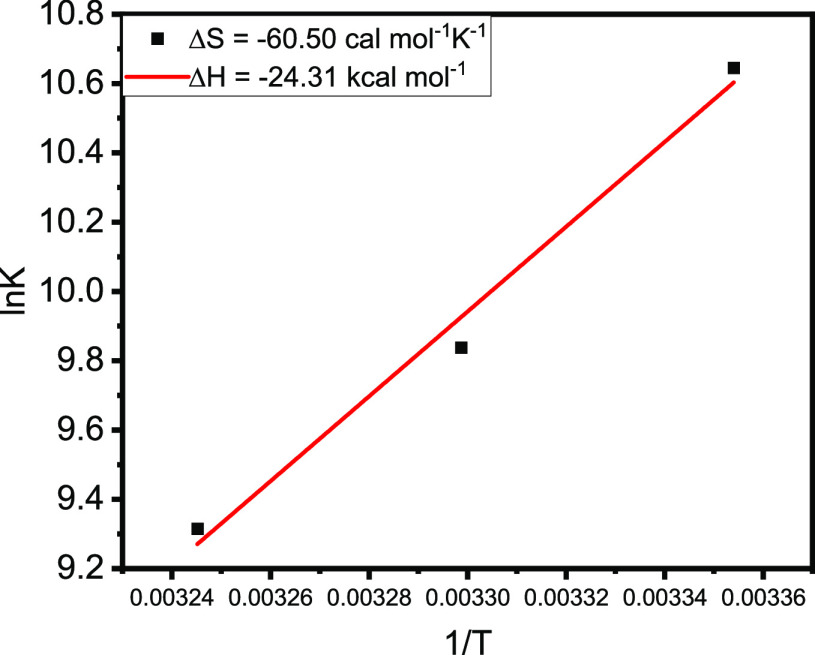
We also calculated the binding constant (Kb) and the number of binding sites (n) of AFB1 on BSA using eq 10 stated in the Methods section. Figure 3b shows the plot of log(F0 – F)/F versus log{[D]0 – n[P]0(F0 – F)/F0}. The value of Kb was found to be 4.20 × 10⁴ M–1, and the number of binding sites obtained is 1.05 at 298.15 K. Various binding parameters along with Gibb’s free energy (ΔG) are reported in Table 2. Figure 4 shows the plot of ln K versus 1/T, used to calculate various thermodynamic parameters like ΔS and ΔH. The values ΔS and ΔH are calculated to be −60.50 cal mol–1 and −24.31 kcal mol–1, respectively. When the values of ΔS and ΔH are less than unity (ΔS < 0 > ΔH), the predominant forces that stabilize the ligand and protein complex are hydrogen bonding and van der Waals interactions.34 Here, in our study, we obtained negative values of both the entropy change and the enthalpy change, suggesting that hydrogen bonding and van der Waals interactions are the major forces playing an essential role in stabilizing the AFB1–BSA complex. The other thermodynamic parameter playing a pivotal role in maintaining the stability of the protein–ligand complex is Gibbs free energy (ΔG). Also, the binding between the ligand and the receptor will be favorable only when the ΔG value is negative.35 For the BSA–AFB1 complex, the ΔG value was found to be −6.30 kcal mol–1 at 298.15 K, indicating the favorable and stable complex formation between AFB1 and BSA.
Table 2. Binding and Thermodynamic Parameters for Stable Complex Formation between AFB1 and BSA at Three Different Temperatures, 298.15, 303.15, and 308.15 K.
| temp. (K) | Kb (×104) | R2 | n | ΔG (kcal mol–1) | ΔH (kcal mol–1) | ΔS (cal mol–1 K–1) |
|---|---|---|---|---|---|---|
| 298.15 | 4.20 ± 0.03 | 0.999 | 1.05 ± 0.007 | –6.30 | –24.31 | –60.50 |
| 303.15 | 1.87 ± 0.02 | 0.999 | 1.01 ± 0.004 | –5.92 | ||
| 308.15 | 1.11 ± 0.02 | 0.999 | 0.98 ± 0.006 | –5.70 |
Figure 4.
Van’t Hoff plot for the calculation of thermodynamic parameters (ΔS and ΔH) at three different temperatures (298.15, 303.15, and 308.15 K) using the ln K vs 1/T plot. SDΔS ± 0.93 and SDΔH ± 0.28.
2.3. Three-Dimensional Fluorescence Studies
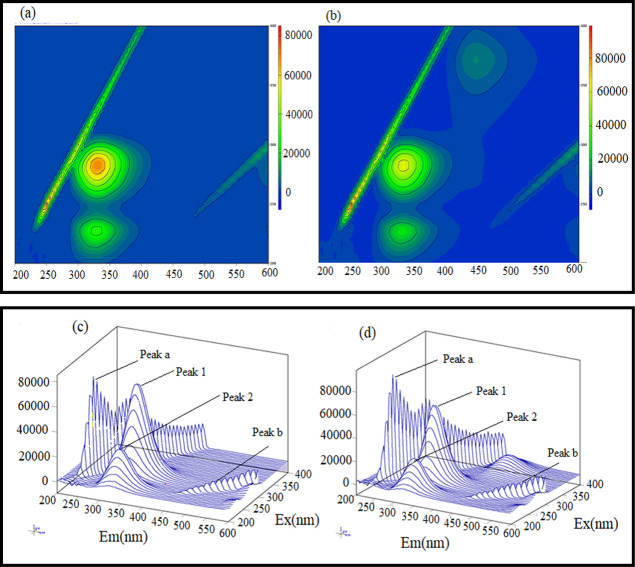
Three-dimensional (3D) fluorescence spectroscopy is a versatile tool to gather information about ligand-induced conformational and structural changes in proteins.36 This technique confers ligand-induced structural and microenvironment changes in the vicinity of fluorophores.37 The 3D fluorescence spectra of native BSA were recorded in the absence and presence of AFB1. The fluorescence intensity in a 3D form is obtained when the λ excitation and λ emission are changed simultaneously.38 The 3D contour maps of BSA alone and the BSA–AFB1 complex are shown in Figure 5a,b, respectively, and they provide a bird’s-eye view of fluorescence spectra. The 3D fluorescence spectra of BSA alone and the BSA–AFB1 complex are shown in Figure 5c,d, respectively. In Figure 5c,d, peak “a” is the Rayleigh scattering peak where λex = λem and is characterized by re-emission of radiation by the solvent containing the ligand and the protein. The re-emitted radiation causes the scattering of a minor part of absorbed radiation in every direction at a similar wavelength.39 Peak “b” corresponds to the second-order scattering peak where λem = 2λex. Peak “1” gives the emission spectra of tyrosine and tryptophan amino acids. Peak “2” is the emission spectra of the polypeptide backbone of BSA due to π–π* transition.40,37 In Figure 5b,d, emission at 440 nm corresponds to the emission contribution of AFB1 in the BSA–AFB1 complex, when excited at 365 nm, which is absent in BSA alone in Figure 5a,c. AFB1 induced quenching in the fluorescence intensity at peak 1 and peak 2 of BSA. While comparing the 3D fluorescence emission spectra of BSA in the presence and absence of AFB1, it may be noted that the fluorescence intensities of both peaks are quenched, anticipating the alteration in the microenvironment around fluorophores present in BSA after the addition of AFB1.41 This result confirms conformational changes in proteins and corroborates our UV absorbance spectroscopic and fluorescence spectroscopic findings. Our findings are consistent with the previous studies on the interaction of small molecules with BSA.42,43 The intensities and wavelengths corresponding to different fluorescence peaks are shown in Table 3.
Figure 5.
Three-dimensional fluorescence contour map of BSA alone (a) and BSA in the presence of AFB1. (b) Three-dimensional fluorescence spectra of BSA alone (c) and BSA in the presence of AFB1 (d). The ratio of BSA:AFB1 concentration is 1:1.
Table 3. Three-Dimensional Fluorescence Parameters of BSA Alone and the BSA–AFB1 Complex.
| BSA |
BSA–AFB1 |
|||
|---|---|---|---|---|
| fluorescence peaks | λex/λem (nm) | fluorescence intensities (a.u.) | λex/λem (nm) | fluorescence intensities (a.u.) |
| peak 1 | 280/335 | 68816.3 | 280/330 | 61384.5 |
| peak 2 | 230/340 | 24905.8 | 230/340 | 22500.8 |
2.4. Competitive Site Marker Displacement Assay
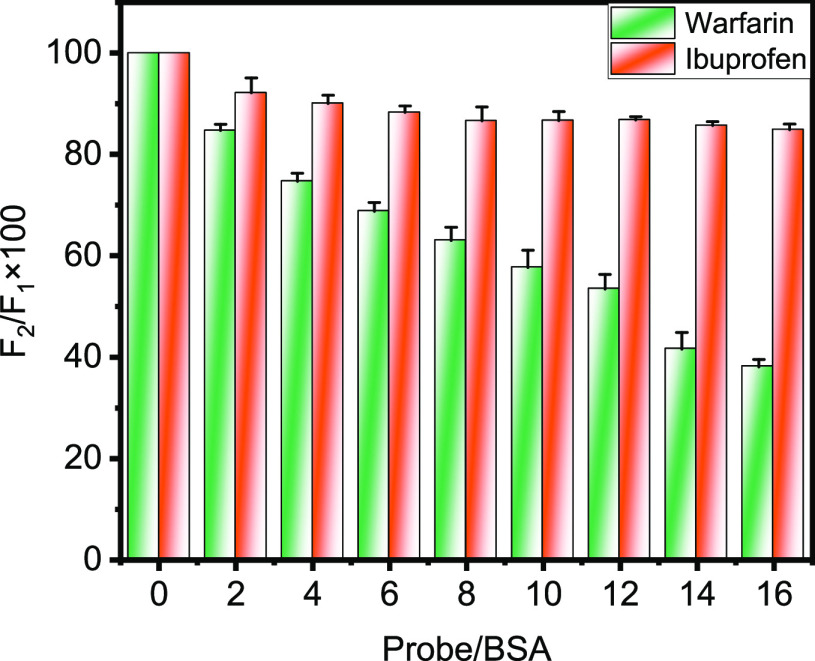
Most of the xenobiotics are known to bind site I and site II since their interactions with these loci are of utmost sensitivity to the proton-induced neutral base transition of albumins.44,45 Warfarin and ibuprofen were used as site marker probes to investigate the binding site of AFB1 on BSA with the help of fluorescence spectroscopy.46 Warfarin and ibuprofen are well-distinguished site marker probes for BSA that bind to site I (subdomain IIA) and site II (subdomain IIIA) of BSA. BSA (5 μM) and AFB1 (14 μM) were titrated with increasing site marker concentration. The percentage of AFB1 displaced by the respective site markers was calculated using eq 1 given by Sudlow et al.47
| 1 |
F1 and F2 represent the fluorescence intensities of BSA-bound AFB1 in the absence and presence of site markers (warfarin and ibuprofen). A significant change in the fluorescence intensity was found in warfarin compared to ibuprofen for the displacement of AFB1 from BSA, suggesting that the binding of AFB1 is located in subdomain IIA or Sudlow’s site 1 in BSA. Figure 6 depicts the bar graph showing the displacement of AFB1 from warfarin and ibuprofen, and it was found that maximum displacement of AFB1 is found in the case of warfarin. However, only a small amount of AFB1 displacement is noted for ibuprofen. Previous studies on the binding of ochratoxin A and zearalenone with serum albumins have also confirmed the involvement of subdomain IIA.48,49
Figure 6.
Bar graph showing displacement of AFB1 by site markers warfarin and ibuprofen at 298.15 K and pH 7.4. The concentrations of BSA and AFB1 are 5 and 14 μM, respectively, while site markers are titrated with increasing concentrations from 0 to 80 μM.
2.5. Energy Transfer between BSA and AFB1
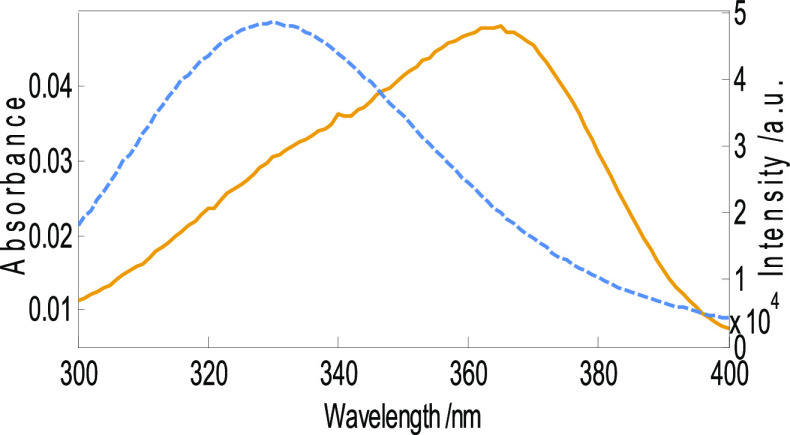
Förster resonance energy transfer (FRET) is a valuable and widely used tool to compute the energy transfer efficacy from donor to acceptor molecules and to measure the distance between ligands and fluorophores in serum albumin in an aqueous environment.50 The FRET principle states that the energy transfer between a donor and an acceptor is well-achieved when both are situated at a distance between 2 and 8 nm, the donor molecule is fluorescent, and overlapping is significant between the donor emission spectrum and the acceptor absorbance spectrum.51 The efficiency of energy transfer was calculated with the help of eq 2 where R06 is the critical distance between the donor and the acceptor when the energy transfer efficiency is equal to 50% and r6 represents the distance between the donor and the acceptor. The value of R0 was calculated from eq 3, where k2 is the orientation factor between donor and acceptor dipoles, N represents the refractive index of the medium, Ø signifies the fluorescence quantum yield of the donor (BSA), J is the spectral overlap integral, F(λ) denotes the corrected fluorescence intensity of the donor (BSA) at wavelength λ, and ε(λ) represents the molar absorption coefficient of the acceptor at wavelength λ as given in eq 4. Figure 7 shows the spectral overlap of the absorption and emission spectrum of AFB1 and BSA, respectively. The figure suggests the high efficiency of energy transfer since the overlap area is significant. The calculated values of J, R0, r, and E are found to be 9.80 × 10⁻¹⁵ cm6/mmol, 2.50 nm, 3.97 nm, and 0.057, respectively. The values of k2, N, and Ø have been taken to be 2/3, 0.15, and 1.36, respectively. Since the critical distance between AFB1 and BSA is less than 8 nm followed by “r” greater than R0, it suggests high efficiency of energy transfer between the two molecules and static mode of fluorescence quenching.39,52,53
| 2 |
| 3 |
| 4 |
Figure 7.
Spectral overlap of the absorbance spectrum of AFB1 and the emission spectrum of BSA for FRET analysis. Conditions: c(AFB1) = 5 μM, c(BSA) = 5 μM, and wavelength range = 300–400 nm.
2.6. Secondary Structure Analysis
CD spectroscopy is a valuable and technically decent tool for investigating the conformational changes in proteins.54,55 Native BSA has negative ellipticity at 222 and 208 nm due to n⃗π* and π⃗π* transition, which is the hallmark of the α-helical content of proteins.56,57 MRE208 and MRE222 values were calculated using eqs 5 and 6. The percentage of the α-helix in a protein was calculated with the help of eq 7.
| 5 |
| 6 |
| 7 |
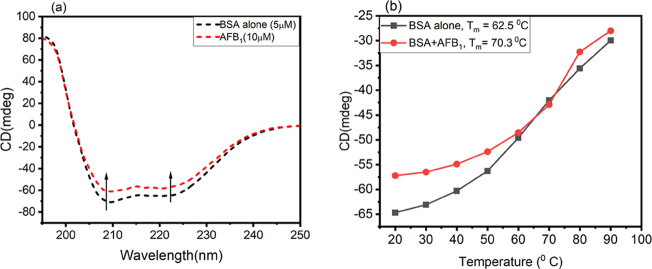
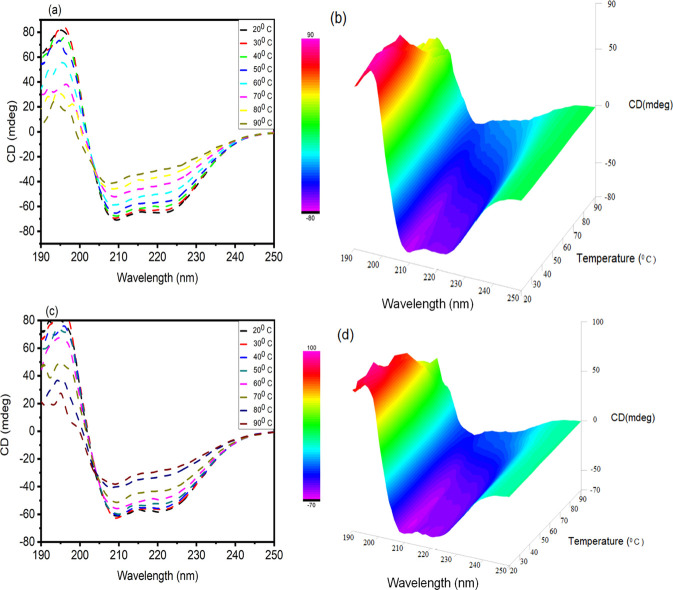
Here, in this experiment, the CD spectra of BSA in the absence and presence of AFB1 were obtained to check the conformational changes brought by AFB1 to the native BSA conformation. From Figure 8a, it is inferred that BSA shows 2 negative minima at 208 and 222 nm, signifying the α-helix as the predominant conformation in BSA. Upon the addition of AFB1 to BSA, the 2 negative ellipticities at 208 and 222 nm still exist; however, the intensity in CD (mdeg) was reduced, suggesting a decrease in the α-helical content. Native BSA exhibited a 67.39% α-helix that was reduced to 51.18% in the presence of AFB1. The percentage of the α-helix obtained for BSA is in accordance with previous work by Agrawal et al.58 Far-UV CD analysis was performed to investigate the thermal denaturation of BSA in the presence of AFB1 from 20 to 90 °C temperature scan at pH 7.4. The melting temperature (Tm) for BSA was calculated to be 62.5 °C, and it was increased to 70.3 °C in the presence of AFB1. The thermal denaturation graph is shown in Figure 8b. The thermal profile data elucidates that the thermal stability of BSA is increased in the presence of AFB1. Figure 9a,b shows the CD spectra of BSA alone as a function of temperature from 20 to 90 °C in a wavelength range of 190–250 nm. From Figure 9, it is inferred that with each increase in temperature, the peaks at 208 and 222 nm diminish, thereby reducing the helical content in BSA, and at the highest temperature (90 °C), the peak at 222 nm is completely lost, suggesting the complete loss of the α-helix; furthermore, in Figure 9c,d, the CD spectra as a function of temperature for the BSA–AFB1 system are shown, which also dictate step by step thermal denaturation of BSA in the presence of AFB1.
Figure 8.
(a) Far-UV CD spectra of BSA in the absence and presence of AFB1. (b) Thermal denaturation curves of BSA in the absence and presence of AFB1 for the calculation of melting temperature (Tm), in a temperature range from 20 to 90 °C.
Figure 9.
Thermal CD spectra (a) BSA alone and (c) BSA in the presence of AFB1 as a function of temperature ranging from 20 to 90 °C. 3D thermal CD curves of (b) BSA alone and (d) BSA in the presence of AFB1 as a function of temperature ranging from 20 to 90 °C.
2.7. Molecular Docking
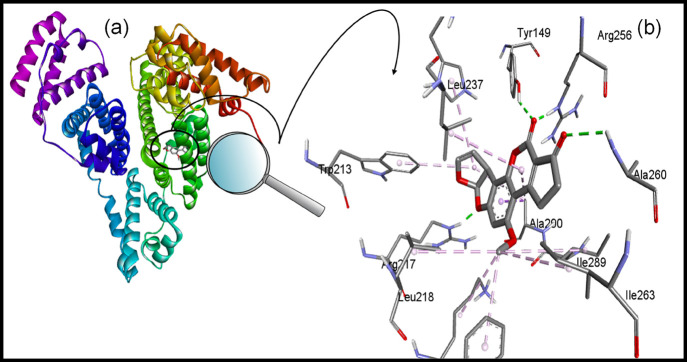
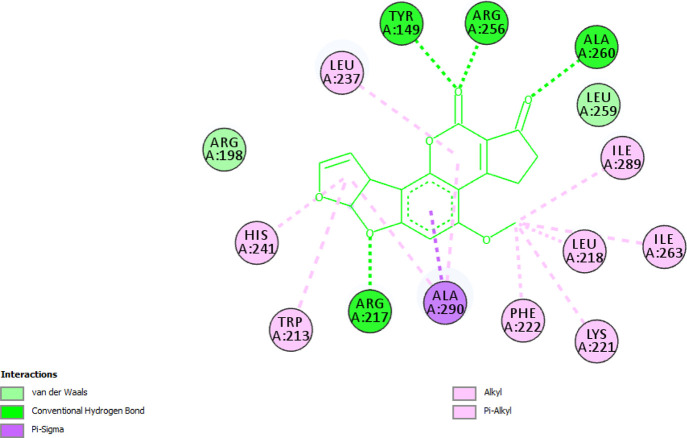
Molecular docking was performed to corroborate the findings of spectroscopic studies and to investigate the binding pocket of AFB1 on BSA. The main ligand binding sites are located in hydrophobic cavities in BSA, known as subdomain IIA (Sudlow’s site 1) and subdomain IIIA (Sudlow’s site II).40Figure 10a shows the best docked pose of binding of AFB1 to BSA in subdomain IIA, and Figure 10b gives a close-up view of the binding pocket of BSA and amino acid residues involved in binding of AFB1. From Figure 10, it is evident that AFB1 binds to Sudlow’s site 1, supporting the findings of our site marker displacement assay. The binding energy and other docking results are shown in Table 4. The amino acid residues surrounding AFB1 are Leu-237, Tyr-149, Arg-256, Ala-260, Leu-259, Ile-289, Leu-218, Ile-263, Lys-221, Phe-222, Ala-290, Arg-217, Trp-213, His-241, and Arg-198. The major forces stabilizing the BSA–AFB1 complex are hydrogen bonding and van der Waals interaction, where Arg-217, Tyr-149, Arg-256, and Ala-260 residues are involved in hydrogen bonding and Arg-198 and Leu-259 are linked to AFB1 via van der Waals interaction. The final intermolecular energy (hydrogen bond + van der Waals + desolvation energy) is much more negative than electrostatic energy suggesting hydrogen bonding and van der Waals interactions as underlying forces stabilizing the AFB1–BSA complex and supporting our findings of thermodynamic parameters.38Figure 11 demonstrates the nature of bonds and amino acid residues between AFB1 and BSA. It is important to note that the Trp-213 is the part of the binding pocket and its influence on the binding of AFB1 corresponds to quenching in the fluorescence spectra of BSA in the presence of AFB1 described in Section 2.2. The finding of the molecular docking study is well-correlated with the spectroscopic studies.
Figure 10.
(a) Best docked pose of the BSA–AFB1 complex depicting the binding pocket in BSA for AFB1. (b) Close-up view of the binding pocket of BSA showing the interaction between amino acid residues and AFB1.
Table 4. Docking Parameters like Binding Energy and Amino Acids Involved in BSA–AFB1 Interaction.
| protein–ligand system | amino acid residues involved in hydrogen bonding | binding energy of the complex |
|---|---|---|
| (a) BSA–AFB1 | Arg-217, Tyr-149, Arg-256, and Ala-260 | –7.57 kcal mol–1 |
Figure 11.
2D plot showing amino acid residues involved in bond formation with AFB1 molecules. Residues involved in conventional hydrogen bonding are Arg-217, Tyr-149, Arg-256, and Ala-260. Residues involved in van der Waals interaction are Arg-198 and Leu-259.
3. Conclusions
The study here describes the binding potential of mutagen AFB1 on BSA and discusses the conformational changes induced with numerous spectroscopic techniques, including circular dichroism. Earlier studies have not focused on conformational changes induced by AFB1 on BSA. Since AFB1 is an environmental hazard with carcinogenic properties, its exposure to animals and humans could lead to severe adverse effects, the most common being aflatoxicosis. The binding potential of AFB1 to BSA is moderate in terms of the obtained binding constant (Kb ∼ 104 M–1). UV absorption spectroscopic results reveal structural alteration in the native structure of BSA and ground-state complex formation between AFB1 and BSA. Quenching in the fluorescence emission maxima confirms structural and conformation changes brought by AFB1 to BSA. The mode of fluorescence quenching was obtained as static in nature. There was high efficiency of energy transfer between AFB1 and BSA, as confirmed from FRET analysis findings. Warfarin site marker displaces AFB1 more readily than ibuprofen, thus ensuring Sudlow’s site 1 as a potential binding location of AFB1 on BSA, further confirmed with an in silico approach using molecular docking. AFB1 induced conformational changes in BSA, leading to a loss in the α-helical content as confirmed from circular dichroism spectropolarimetry. Native BSA exhibited melting temperature (Tm) at around 62.5 °C, which was increased to 70.3 °C in the presence of AFB1. The study and its findings will help to understand the pharmacokinetics of mycotoxins. The spectroscopic findings of this study have provided us various binding parameters associated with the binding dynamics of the mycotoxin AFB1 with BSA. However, the major concern is the frequent dislodging of AFB1 from serum albumin followed by its metabolism leading to elimination from the body. The findings could be used to discover a potential agent that can compete with the AFB1 for its binding site and dislodge the hepatocarcinogen from the serum albumin for its metabolism and quick removal from the body. The prospect of the present research is the competitive displacement of AFB1 with potential agents sharing the same binding site but higher binding affinities toward serum albumin compared to AFB1.
4. Experimental Section
4.1. Materials
Aflatoxin B1, bovine serum albumin, warfarin, and ibuprofen were procured from Sigma Aldrich. All the chemicals were of high-grade analytical quality and used without any further purification.
4.2. Methods
4.2.1. Preparation of Stock Solutions
The stock solution of AFB1 was prepared in HPLC-grade methanol and further diluted with sodium phosphate buffer of 20 mM strength, pH 7.4, to be used as a working solution for interaction studies. The stock solution of BSA (200 μM) was prepared by dissolving 13.3 mg of BSA in sodium phosphate buffer, 20 mM, pH 7.4, and further dilutions of BSA were made in sodium phosphate buffer, pH 7.4. Stock solutions of site marker dyes, warfarin, and ibuprofen were prepared by dissolving the appropriate amount in sodium phosphate buffer.
4.2.2. UV–Visible Spectroscopic Studies
A Shimadzu dual-beam UV–visible spectrophotometer, UV-1800, was employed to record UV–visible absorbance spectra of BSA in the absence and presence of AFB1. The spectra were recorded using a quartz cuvette of 1 cm path length. BSA (5 μM) was titrated with an increasing concentration of AFB1 (0–14 μM), and absorbance spectra were recorded in the 200–300 nm wavelength range. Sodium phosphate buffer 20 mM, pH 7.4, was used to correct the baseline and used as a reference solution during the spectroscopic studies.
4.2.3. Fluorescence Spectroscopy-Based Studies
A Shimadzu RF-6000 spectrofluorometer, equipped with a xenon flash lamp, was used to perform the fluorescence-based experiment. Steady-state fluorescence emission spectra of BSA were recorded by titrating BSA (5 μM) with increasing concentrations of AFB1 (0–14 μM) to investigate the effect of AFB1 on the fluorescence spectra of BSA. BSA was excited at 280 nm, and emission was recorded in a 300–400 nm wavelength range. Both excitation and emission bandwidths were set at 5 nm each. The emission was corrected using eq 8 to nullify any inner filter effect, where Fcorr is the corrected fluorescence intensity and Fobs is the observed fluorescence intensity. Aex and Aem are the absorbances of the ligand at the excitation and emission wavelength of proteins. The quenching constant (KSV) was calculated with the help of the Stern–Volmer plot using eq 9.
| 8 |
| 9 |
During the process of interaction of small molecules with proteins, a state of equilibirium always exists between the ligand (D) and the protein molecule (P), which can be written as follows
where n is the number of binding sites for the ligand (D) on the protein (L) molecule. The binding constant (Kb) for the ligand and the protein can be calculated according to the following equation (eq 10).59
| 10 |
[P]0 and [D]0 in eq 10 represent the total protein (BSA) concentration and the total ligand (AFB1) concentration, respectively.
| 11 |
| 12 |
| 13 |
In eq 9, F0 and F represent the intrinsic fluorescence intensities of BSA in the absence and presence of AFB1, Kq denotes the rate constant or the bimolecular quenching constant for the fluorescence quenching reaction, τ0 represents an average integral lifetime of the tryptophan residue that is equal to ∼10–9 s. The numerical value of Kq was calculated using eq 11. Equation 12 was used to calculate Gibbs free energy where ΔG is the change in free energy, R (1.987 cal mol–1 K–1) is the universal gas constant, and T is the temperature (in Kelvin). However, eq 13 was used to obtain the entropy change (ΔS) and the enthalpy change (ΔH) for the BSA–AFB1 system.
In another set of experiments, the effect of BSA on the fluorescence emission spectra of AFB1 was also evaluated by titrating AFB1 (5 μM) with an increasing concentration of BSA (0–2.5 μM). AFB1 was excited at 365 nm, and fluorescence emission was recorded in the 380–500 nm wavelength range.
4.2.4. Three-Dimensional Fluorescence Studies
A Shimadzu spectrofluorometer RF-6000 was used to record the 3D fluorescence spectra of BSA (5 μM) in the absence and presence of AFB1 (5 μM). Excitation and emission wavelength ranges were 200–350 and 200–600 nm, respectively. The scanning speed was fixed to 6000 nm per minute. Excitation and emission bandwidths were fixed to 5 nm. All the other parameters were similar to fluorescence measurement studies.
4.2.5. Competitive Site Displacement Assay
A competitive site marker displacement assay was performed to get insight into the possible binding site for AFB1 in BSA. Two different site markers, warfarin (for Sudlow’s site I) and ibuprofen (for Sudlow’s site II), were used to locate the binding site of AFB1 on BSA. Five micromolar BSA and 14 μM AFB1 were titrated with increasing concentrations of site markers (0–80 μM). The BSA and AFB1 complex was excited at 280 nm, and fluorescence emission spectra were obtained in the wavelength range of 300–400 nm. Excitation and emission bandwidths were fixed to 5 nm.
4.2.6. Energy Transfer between BSA and AFB1 Using FRET
The energy transfer efficiency between BSA and AFB1 was evaluated by spectral overlapping of the absorption spectrum of AFB1 to the emission spectrum of BSA. The absorption spectrum was taken on a Shimadzu UV-1800 spectrophotometer at 298.15 K. The baseline was corrected using sodium phosphate buffer of 20 mM strength, pH 7.4. The fluorescence emission spectrum of BSA was taken on an RF-6000 spectrofluorometer having a xenon flash lamp, at 298.15 K. A quartz cuvette of 1 cm path length was used for both UV absorption and emission spectra. The concentration of both BSA and AFB1 was fixed to 5 μM.
4.2.7. Circular Dichroism (CD) Measurement
CD spectroscopy is a valuable tool to get insight into conformational changes in proteins in the presence of a ligand. A JASCO J1500 spectropolarimeter was used to record the far-UV circular dichroism spectra of BSA in the absence and presence of AFB1. The spectropolarimeter was equipped with a temperature control Peltier system to control the temperature supported with a circulating water bath maintained at 25 ± 0.1 °C. Far-UV CD spectra were recorded using a 0.1 cm path length quartz cuvette with a scanning speed of 200 nm/min. The concentration of BSA was fixed to 5 μM, and the ratio of BSA to AFB1 was taken to be 1:2. The spectra were recorded in the wavelength range of 200–250 nm and were the average of 3 scans. Ten millimolar sodium phosphate buffer, pH 7.4, was used to correct the baseline. The CD spectra were plotted as CD (mdeg) versus the wavelength using Origin 2020b software. The thermal stability of BSA in the absence and presence of AFB1 as a function of temperature (20 to 90 °C) was analyzed using variable temperature versus wavelength scan with 10 °C temperature intervals. In the first step, CD spectra as a function of the temperature of BSA (5 μM) alone were recorded over a given range of temperatures, and CD (mdeg) versus wavelength at different temperatures was plotted. In the second step, CD spectra of BSA (5 μM) in the presence of AFB1 (10 μM) at the given temperature range were recorded. Sodium phosphate buffer (10 mM) at pH 7 was used to maintain the appropriate concentration and to correct the baseline. The melting profile of BSA using CD spectra was also investigated using MRE222 values in the absence and presence of AFB1, at a temperature range of 20 to 90 °C.
4.2.8. Molecular Docking of AFB1 with BSA
Molecular docking was performed with the help of AutoDock 4.2 in order to locate the potential binding of AFB1 to BSA. The crystal structure of BSA was obtained from the Protein Data Bank having the PDB ID 4F5S, and the structure of AFB1 was obtained from PubChem having the CID 186907. Yasara and Avogadro software were used to minimize the energy of BSA and AFB1, respectively. Both the ligand and receptor files were saved in a .pdb format. Water molecules were removed from the protein structure using a Discovery Studio visualizer, and polar hydrogen atoms were included in the crystal structure of BSA using Autodock tools. For blind docking analysis, the grid dimensions were fixed to 126 × 126 × 126 in the xyz axis, while the central grid box was set with default values. The grid spacing was fixed to 0.375 Å. A total of 100 GA runs were set for the docking process. The Lamarckian genetic algorithm 4.2 was used to perform the docking calculations with a maximum of 2,500,000 energy evaluations. Partial Kollman charges were assigned to BSA. After the completion of the docking, the docked complex with minimum binding energy was saved in a .pdbqt format for visualizing using a Discovery Studio visualizer (Dassault Systèmes BIOVIA, San Diego) and PyMOL software.
Acknowledgments
The authors are thankful to the DST, UGC, and Aligarh Muslim University for providing necessary instrumentation support. M.A.Q. is grateful to the ICMR, New Delhi, India, for providing a Senior Research Fellowship.
The authors declare no competing financial interest.
References
- El Golli-Bennour E.; Kouidhi B.; Bouslimi A.; Abid-Essefi S.; Hassen W.; Bacha H. Cytotoxicity and Genotoxicity Induced by Aflatoxin B1, Ochratoxin A, and Their Combination in Cultured Vero Cells. J. Biochem. Mol. Toxicol. 2010, 24, 42–50. 10.1002/jbt.20310. [DOI] [PubMed] [Google Scholar]
- Tan H.; Chen L.; Ma L.; Liu S.; Zhou H.; Zhang Y.; Guo T.; Liu W.; Dai H.; Yu Y. Fluorescence Spectroscopic Investigation of Competitive Interactions between Quercetin and Aflatoxin B1 for Binding to Human Serum Albumin. Toxins (Basel). 2019, 11, 214. 10.3390/toxins11040214. [DOI] [PMC free article] [PubMed] [Google Scholar]
- Engin A. B.; Engin A.. DNA Damage Checkpoint Response to Aflatoxin B1. Environmental Toxicology and Pharmacology; 2019, pp. 90–96. 10.1016/j.etap.2018.12.006. [DOI] [PubMed] [Google Scholar]
- Hassan A. A.; Abu Hafsa S. H.; Elghandour M. M. M. Y.; Kanth Reddy P. R.; Monroy J. C.; Salem A. Z. M. Dietary Supplementation with Sodium Bentonite and Coumarin Alleviates the Toxicity of Aflatoxin B1 in Rabbits. Toxicon 2019, 171, 35–42. 10.1016/j.toxicon.2019.09.014. [DOI] [PubMed] [Google Scholar]
- Cotty P. J.; Mellon J. E. Ecology of Aflatoxin Producing Fungi and Biocontrol of Aflatoxin Contamination. Mycotoxin Res. 2006, 22, 110–117. 10.1007/BF02956774. [DOI] [PubMed] [Google Scholar]
- Coulombe R. A.; Shelton D. W.; Sinnhuber R. O.; Nixon J. E. Comparative Mutagenicity of Aflatoxins Using a Salmonella/Trout Hepatic Enzyme Activation System. Carcinogenesis 1982, 3, 1261–1264. 10.1093/carcin/3.11.1261. [DOI] [PubMed] [Google Scholar]
- Lutz W. K.; Jaggi W.; Lüthy J.; Sagelsdorff P.; Schlatter C. In Vivo Covalent Binding of Aflatoxin B1 and Aflatoxin M1 to Liver DNA of Rat, Mouse and Pig. Chem.-Biol. Interact. 1980, 32, 249–256. 10.1016/0009-2797(80)90092-7. [DOI] [PubMed] [Google Scholar]
- Kang’ethe E.; Lang’a K. Aflatoxin B1 and M1 Contamination of Animal Feeds and Milk from Urban Centers in Kenya. Afr. Health Sci. 2009, 9, 218–226. [PMC free article] [PubMed] [Google Scholar]
- Meissonnier G. M.; Pinton P.; Laffitte J.; Cossalter A. M.; Gong Y. Y.; Wild C. P.; Bertin G.; Galtier P.; Oswald I. P. Immunotoxicity of Aflatoxin B1: Impairment of the Cell-Mediated Response to Vaccine Antigen and Modulation of Cytokine Expression. Toxicol. Appl. Pharmacol. 2008, 231, 142–149. 10.1016/j.taap.2008.04.004. [DOI] [PubMed] [Google Scholar]
- Ma L.; Wang J.; Zhang Y. Probing the Characterization of the Interaction of Aflatoxins B1 and G1 with Calf Thymus DNA in Vitro. Toxins (Basel). 2017, 9, 209. 10.3390/toxins9070209. [DOI] [PMC free article] [PubMed] [Google Scholar]
- Moss M. O.AFLATOXINS. In Encyclopedia of Food Sciences and Nutrition; Elsevier, 2003; pp. 66–72. 10.1016/B0-12-227055-X/00016-X. [DOI] [Google Scholar]
- Iqbal S. Z.; Asi M. R.; Ariño A.. Aflatoxins. In Brenner’s Encyclopedia of Genetics :SecondEdition; Elsevier Inc., 2013; pp. 43–47. 10.1016/B978-0-12-374984-0.00022-X. [DOI] [Google Scholar]
- Pal S.; Saha C. A Review on Structure-Affinity Relationship of Dietary Flavonoids with Serum Albumins. J. Biomol. Struct. Dyn. 2014, 32, 1132–1147. 10.1080/07391102.2013.811700. [DOI] [PubMed] [Google Scholar]
- Tian J.; Liu J.; Hu Z.; Chen X. Binding of the Scutellarin to Albumin Using Tryptophan Fluorescence Quenching, CD and FT-IR Spectra. Am. J. Immunol. 2005, 1, 21–23. 10.3844/AJISP.2005.21.23. [DOI] [Google Scholar]
- Tang H.; Shi Z. H.; Li N. G.; Tang Y. P.; Shi Q. P.; Dong Z. X.; Zhang P. X.; Duan J. A. Investigation on the Interactions of Scutellarin and Scutellarein with Bovine Serum Albumin Using Spectroscopic and Molecular Docking Techniques. Arch. Pharmacal Res. 2015, 38, 1789–1801. 10.1007/s12272-014-0541-z. [DOI] [PubMed] [Google Scholar]
- Cao H.; Liu Q. Effects of Temperature and Common Ions on Binding of Puerarin to BSA. J. Solution Chem. 2009, 38, 1071–1077. 10.1007/s10953-009-9430-3. [DOI] [Google Scholar]
- Papadopoulou A.; Green R. J.; Frazier R. A. Interaction of Flavonoids with Bovine Serum Albumin: A Fluorescence Quenching Study. J. Agric. Food Chem. 2005, 53, 158–163. 10.1021/jf048693g. [DOI] [PubMed] [Google Scholar]
- Chinnathambi S. Underlying the Mechanism of 5-Fluorouracil and Human Serum Albumin Interaction: A Biophysical Study. J. Phys. Chem. Biophys. 2016, 6, 1–9. 10.4172/2161-0398.1000214. [DOI] [Google Scholar]
- Karthikeyan S.; Bharanidharan G.; Ragavan S.; Kandasamy S.; Chinnathambi S.; Udayakumar K.; Mangaiyarkarasi R.; Sundaramoorthy A.; Aruna P.; Ganesan S. Comparative Binding Analysis of N-Acetylneuraminic Acid in Bovine Serum Albumin and Human α-1 Acid Glycoprotein. J. Chem. Inf. Model. 2019, 59, 326–338. 10.1021/acs.jcim.8b00558. [DOI] [PubMed] [Google Scholar]
- Karthikeyan S.; Bharanidharan G.; Ragavan S.; Kandasamy S.; Chinnathambi S.; Udayakumar K.; Mangaiyarkarasi R.; Suganya R.; Aruna P.; Ganesan S. Exploring the Binding Interaction Mechanism of Taxol in β-Tubulin and Bovine Serum Albumin: A Biophysical Approach. Mol. Pharmaceutics 2019, 16, 669–681. 10.1021/acs.molpharmaceut.8b00948. [DOI] [PubMed] [Google Scholar]
- Chinnathambi S.; Velmurugan D.; Hanagata N.; Aruna P. R.; Ganesan S. Investigations on the Interactions of 5-Fluorouracil with Bovine Serum Albumin: Optical Spectroscopic and Molecular Modeling Studies. J. Lumin. 2014, 151, 1–10. 10.1016/j.jlumin.2014.01.063. [DOI] [Google Scholar]
- Pawar S. K.; Jaldappagari S. Interaction of Repaglinide with Bovine Serum Albumin: Spectroscopic and Molecular Docking Approaches. J. Pharm. Anal. 2019, 9, 274–283. 10.1016/j.jpha.2019.03.007. [DOI] [PMC free article] [PubMed] [Google Scholar]
- Gadallah M. I.; Ali H. R. H.; Askal H. F.; Saleh G. A. Towards Understanding of the Interaction of Certain Carbapenems with Protein via Combined Experimental and Theoretical Approach. Spectrochim. Acta Part A 2021, 246, 119005. 10.1016/j.saa.2020.119005. [DOI] [PubMed] [Google Scholar]
- Rasoulzadeh F.; Asgari D.; Naseri A.; Rashidi M. R. Spectroscopic Studies on the Interaction between Erlotinib Hydrochloride and Bovine Serum Albumin. DARU, J. Pharm. Sci. 2010, 18, 179–184. [PMC free article] [PubMed] [Google Scholar]
- Phopin K.; Ruankham W.; Prachayasittikul S.; Prachayasittikul V.; Tantimongcolwat T. Insight into the Molecular Interaction of Cloxyquin (5-Chloro-8-Hydroxyquinoline) with Bovine Serum Albumin: Biophysical Analysis and Computational Simulation. Int. J. Mol. Sci. 2020, 21, 249. 10.3390/ijms21010249. [DOI] [PMC free article] [PubMed] [Google Scholar]
- Siddiqui S.; Ameen F.; Kausar T.; Nayeem S. M.; Ur Rehman S.; Tabish M. Biophysical Insight into the Binding Mechanism of Doxofylline to Bovine Serum Albumin: An in Vitro and in Silico Approach. Spectrochim. Acta, Part A 2021, 249, 119296. 10.1016/j.saa.2020.119296. [DOI] [PubMed] [Google Scholar]
- Ikhlas S.; Usman A.; Ahmad M. Comparative Study of the Interactions between Bisphenol-A and Its Endocrine Disrupting Analogues with Bovine Serum Albumin Using Multi-Spectroscopic and Molecular Docking Studies. J. Biomol. Struct. Dyn. 2019, 37, 1427–1437. 10.1080/07391102.2018.1461136. [DOI] [PubMed] [Google Scholar]
- Arumugam V.; Rajamanikandan R.; Ilanchelian M.; Moodley K. G.; Redhi G. G. Elucidation of Interactions of BSA with [EPMpyr]+[Cl]– Using Spectroscopic Techniques with Reference to Theoretical Thermodynamic and Molecular Docking Studies. J. Mol. Liq. 2019, 273, 634–644. 10.1016/j.molliq.2018.09.001. [DOI] [Google Scholar]
- Ghisaidoobe A. B. T.; Chung S. J. Intrinsic Tryptophan Fluorescence in the Detection and Analysis of Proteins: A Focus on Förster Resonance Energy Transfer Techniques. Int. J. Mol. Sci. 2014, 15, 22518–22538. 10.3390/ijms151222518. [DOI] [PMC free article] [PubMed] [Google Scholar]
- Amir M.; Qureshi M. A.; Javed S. Biomolecular Interactions and Binding Dynamics of Tyrosine Kinase Inhibitor Erdafitinib, with Human Serum Albumin. J. Biomol. Struct. Dyn. 2020, 1. 10.1080/07391102.2020.1772880. [DOI] [PubMed] [Google Scholar]
- Kandagal P. B.; Ashoka S.; Seetharamappa J.; Shaikh S. M. T.; Jadegoud Y.; Ijare O. B. Study of the Interaction of an Anticancer Drug with Human and Bovine Serum Albumin: Spectroscopic Approach. J. Pharm. Biomed. Anal. 2006, 41, 393–399. 10.1016/j.jpba.2005.11.037. [DOI] [PubMed] [Google Scholar]
- Kameníková M.; Furtmüller P. G.; Klacsová M.; Lopez-Guzman A.; Toca-Herrera J. L.; Vitkovská A.; Devínsky F.; Mučaji P.; Nagy M. Influence of Quercetin on the Interaction of Gliclazide with Human Serum Albumin – Spectroscopic and Docking Approaches. Luminescence 2017, 32, 1203–1211. 10.1002/bio.3312. [DOI] [PubMed] [Google Scholar]
- Ishtikhar M.; Khan S.; Badr G.; Osama Mohamed A.; Khan R. H. Interaction of the 5-Fluorouracil Analog 5-Fluoro-2’-Deoxyuridine with “N” and “B” Isoforms of Human Serum Albumin: A Spectroscopic and Calorimetric Study. Mol. BioSyst. 2014, 10, 2954–2964. 10.1039/c4mb00306c. [DOI] [PubMed] [Google Scholar]
- Ross P. D.; Subramanian S. Thermodynamics of Protein Association Reactions: Forces Contributing to Stability. Biochemistry 1981, 20, 3096–3102. 10.1021/bi00514a017. [DOI] [PubMed] [Google Scholar]
- Du X.; Li Y.; Xia Y. L.; Ai S. M.; Liang J.; Sang P.; Ji X. L.; Liu S. Q. Insights into Protein–Ligand Interactions: Mechanisms, Models, and Methods. Int. J. Mol. Sci. 2016, 17 (2), 144. 10.3390/ijms17020144. [DOI] [PMC free article] [PubMed] [Google Scholar]
- Li D.; Yang Y.; Cao X.; Xu C.; Ji B. Investigation on the PH-Dependent Binding of Vitamin B12 and Lysozyme by Fluorescence and Absorbance. J. Mol. Struct. 2012, 1007, 102–112. 10.1016/j.molstruc.2011.10.028. [DOI] [Google Scholar]
- Selva Sharma A.; Anandakumar S.; Ilanchelian M. A Combined Spectroscopic and Molecular Docking Study on Site Selective Binding Interaction of Toluidine Blue O with Human and Bovine Serum Albumins. J. Lumin. 2014, 151, 206–218. 10.1016/J.JLUMIN.2014.02.009. [DOI] [Google Scholar]
- Lou Y.-Y.; Zhou K.-L.; Pan D.-Q.; Shen J.-L.; Shi J.-H. Spectroscopic and Molecular Docking Approaches for Investigating Conformation and Binding Characteristics of Clonazepam with Bovine Serum Albumin (BSA). J. Photochem. Photobiol. B Biol. 2017, 167, 158–167. 10.1016/j.jphotobiol.2016.12.029. [DOI] [PubMed] [Google Scholar]
- Lakowicz J. R.Principles of Fluorescence Spectroscopy; 3rd ed.; Springer: Boston, MA, 2006. 10.1007/978-0-387-46312-4. [DOI] [Google Scholar]
- Chaturvedi S. K.; Ahmad E.; Khan J. M.; Alam P.; Ishtikhar M.; Khan R. H. Elucidating the Interaction of Limonene with Bovine Serum Albumin: A Multi-Technique Approach. Mol. BioSyst. 2015, 11, 307–316. 10.1039/c4mb00548a. [DOI] [PubMed] [Google Scholar]
- Tian Z.; Tian L.; Shi M.; Zhao S.; Guo S.; Luo W.; Wang C.; Tian Z. Investigation of the Interaction of a Polyamine-Modified Flavonoid with Bovine Serum Albumin (BSA) by Spectroscopic Methods and Molecular Simulation. J. Photochem. Photobiol. B Biol. 2020, 209, 111917. 10.1016/j.jphotobiol.2020.111917. [DOI] [PubMed] [Google Scholar]
- Hashempour S.; Shahabadi N.; Adewoye A.; Murphy B.; Rouse C.; Salvatore B. A.; Stratton C.; Mahdavian E. Binding Studies of AICAR and Human Serum Albumin by Spectroscopic, Theoretical, and Computational Methodologies. Molecules 2020, 25, 5410. 10.3390/molecules25225410. [DOI] [PMC free article] [PubMed] [Google Scholar]
- Singha Roy A.; Pandey N. K.; Dasgupta S. Preferential Binding of Fisetin to the Native State of Bovine Serum Albumin: Spectroscopic and Docking Studies. Mol. Biol. Rep. 2013, 40, 3239–3253. 10.1007/s11033-012-2399-9. [DOI] [PubMed] [Google Scholar]
- Muller N.; Lapicue F.; Drelon E.; Netter P. Binding Sites of Fluorescent Probes on Human Serum Albumin. J. Pharm. Pharmacol. 2011, 46, 300–304. 10.1111/j.2042-7158.1994.tb03798.x. [DOI] [PubMed] [Google Scholar]
- Dirr H. W.; Schabort J. C. Characterization of the Aflatoxin Bl-Binding Site of Rat Albumin. Biochim. Biophys. Acta 1987, 913, 300–307. 10.1016/0167-4838(87)90139-7. [DOI] [PubMed] [Google Scholar]
- Su X.; Wang L.; Xu Y.; Dong L.; Lu H. Study on the Binding Mechanism of Thiamethoxam with Three Model Proteins:Spectroscopic Studies and Theoretical Simulations. Ecotoxicol. Environ. Saf. 2021, 207, 111280. 10.1016/j.ecoenv.2020.111280. [DOI] [PubMed] [Google Scholar]
- Sudlow G.; Birkett D. J.; Wade D. N. The Characterization of Two Specific Drug Binding Sites on Human Serum Albumin. Mol. Pharmacol. 1975, 11, 824–832. [PubMed] [Google Scholar]
- Poór M.; Kunsági-Máté S.; Bálint M.; Hetényi C.; Gerner Z.; Lemli B. Interaction of Mycotoxin Zearalenone with Human Serum Albumin. J. Photochem. Photobiol. B Biol. 2017, 170, 16–24. 10.1016/j.jphotobiol.2017.03.016. [DOI] [PubMed] [Google Scholar]
- Il’ichev Y. V.; Perry J. L.; Simon J. D. Interaction of Ochratoxin A with Human Serum Albumin. A Common Binding Site of Ochratoxin a and Warfarin in Subdomain IIA. J. Phys. Chem. B 2002, 106, 460–465. 10.1021/jp012315m. [DOI] [Google Scholar]
- Shen Y.; Zhu C.; Wang Y.; Xu J.; Xue R.; Ji F.; Wu Y.; Wu Z.; Zhang W.; Zheng Z.; Ye Y. Evaluation the Binding of Chelerythrine, a Potentially Harmful Toxin, with Bovine Serum Albumin. Food Chem. Toxicol. 2020, 135, 110933. 10.1016/j.fct.2019.110933. [DOI] [PubMed] [Google Scholar]
- Valeur B.; Brochon J.-C.. New Trends in Fluorescence Spectroscopy : Applications to Chemical and Life Sciences; Springer Berlin Heidelberg: 2001. 10.1007/978-3-642-56853-4. [DOI] [Google Scholar]
- Xu L.; Hu Y. X.; Li Y. C.; Liu Y. F.; Zhang L.; Ai H. X.; Liu H. S. Study on the Interaction of Paeoniflorin with Human Serum Albumin (HSA) by Spectroscopic and Molecular Docking Techniques. Chem. Cent. J. 2017, 11, 116. 10.1186/s13065-017-0348-3. [DOI] [PMC free article] [PubMed] [Google Scholar]
- Tabassum S.; Al-Asbahy W. M.; Afzal M.; Arjmand F. Synthesis, Characterization and Interaction Studies of Copper Based Drug with Human Serum Albumin (HSA): Spectroscopic and Molecular Docking Investigations. J. Photochem. Photobiol. B Biol. 2012, 114, 132–139. 10.1016/j.jphotobiol.2012.05.021. [DOI] [PubMed] [Google Scholar]
- Roy A.; Seal P.; Sikdar J.; Banerjee S.; Haldar R. Underlying Molecular Interaction of Bovine Serum Albumin and Linezolid: A Biophysical Outlook. J. Biomol. Struct. Dyn. 2018, 36, 387–397. 10.1080/07391102.2017.1278721. [DOI] [PubMed] [Google Scholar]
- Asl B. A.; Mogharizadeh L.; Khomjani N.; Rasti B.; Pishva S. P.; Akhtari K.; Attar F.; Falahati M. Probing the Interaction of Zero Valent Iron Nanoparticles with Blood System by Biophysical, Docking, Cellular, and Molecular Studies. Int. J. Biol. Macromol. 2018, 109, 639–650. 10.1016/j.ijbiomac.2017.12.085. [DOI] [PubMed] [Google Scholar]
- Bhogale A.; Patel N.; Mariam J.; Dongre P. M.; Miotello A.; Kothari D. C. Comprehensive Studies on the Interaction of Copper Nanoparticles with Bovine Serum Albumin Using Various Spectroscopies. Colloids Surf., B 2014, 113, 276–284. 10.1016/j.colsurfb.2013.09.021. [DOI] [PubMed] [Google Scholar]
- Miles A. J.; Wallace B. A. Circular Dichroism Spectroscopy of Membrane Proteins. Chem. Soc. Rev. 2016, 45, 4859–4872. 10.1039/c5cs00084j. [DOI] [PubMed] [Google Scholar]
- Agrawal R.; Siddiqi M. K.; Thakur Y.; Tripathi M.; Asatkar A. K.; Khan R. H.; Pande R. Explication of Bovine Serum Albumin Binding with Naphthyl Hydroxamic Acids Using a Multispectroscopic and Molecular Docking Approach along with Its Antioxidant Activity. Luminescence 2019, 34, 628–643. 10.1002/bio.3645. [DOI] [PubMed] [Google Scholar]
- Kou S. B.; Lin Z. Y.; Wang B. L.; Shi J. H.; Liu Y. X. Evaluation of the Binding Behavior of Olmutinib (HM61713) with Model Transport Protein: Insights from Spectroscopic and Molecular Docking Studies. J. Mol. Struct. 2021, 1224, 129024. 10.1016/j.molstruc.2020.129024. [DOI] [Google Scholar]


