

Abstract
Perfluoroalkyl acids (PFAAs) are persistent organic substances that have been widely detected in the global oceans. Previous laboratory experiments have demonstrated effective enrichment of PFAAs in nascent sea spray aerosols (SSA), suggesting that SSA are an important source of PFAAs to the atmosphere. In the present study, the effects of the water concentration of PFAAs on their size-resolved enrichment in SSA were examined using a sea spray simulation chamber. Aerosolization of the target compounds in almost all sizes of SSA revealed a strong linear relationship with their water concentrations (p < 0.05, r2 > 0.9). The enrichment factors (EF) of the target compounds showed no correlation with their concentrations in the chamber water, despite the concentrations varying by a factor of 500 (∼0.3 to ∼150 ng L–1). The particle surface-area-to-volume ratio appeared to be a key predictor of the enrichment of perfluoroalkyl carboxylic acids (PFCAs) with ≥7 perfluorinated carbons and perfluoroalkanesulfonic acids (PFSAs) with ≥6 perfluorinated carbons in supermicron particles (p < 0.05, r2 > 0.8), but not in submicron particles. The different enrichment behaviors of PFAAs in submicron and supermicron particles might be a result of the different production mechanisms of film droplets and jet droplets. The results suggest that the variability in seawater concentrations of PFAAs has little influence on EFs and that modeling studies designed to quantify the source of PFAAs via SSA emissions do not need to consider this factor.
Introduction
Perfluoroalkyl acids (PFAAs) are a subgroup of per- and polyfluoroalkyl substances (PFAS) that have been widely used in numerous industrial and commercial applications since the 1950s.1−4 Their productions and emissions has been reviewed by Wang et al.2,4 PFAAs are also the terminal degradation products of a wide range of polyfluoroalkyl substances (so-called precursor substances).1,2 They have been detected in environmental media, biota, and humans worldwide,5−10 even in remote areas such as the Arctic11,12 and Antarctic.13 Long-range atmospheric transport is considered to substantially contribute to the ubiquitous presence of PFAAs,7,14 yet their sources to the atmosphere are still not well-understood.
Direct emission to air from manufacturing sites and formation through the degradation of gaseous precursors are proposed as two possible sources of PFAAs to the atmosphere.14−16 Besides these two sources, several laboratory studies have demonstrated water-to-air transfer of PFAAs in sea spray aerosol (SSA) simulation experiments, suggesting the possibility of SSA as an important source of PFAAs to the atmosphere.17−21 A recent field study suggested that SSA might be an additional source of PFOA to atmosphere at the two Norwegian High Arctic stations of Zeppelin and Andøya, Norway.22 Johansson et al.17 observed that PFAA concentrations in laboratory-generated SSA < 1.6 μm can be up to ∼62000 times higher than that in the bulk water. On the basis of these laboratory-derived size-resolved enrichment factors (EFs) and reported median concentrations in seawater, the estimated fluxes of perfluorooctanoic acid (PFOA) and perfluorooctanesulfonic acid (PFOS) from SSA to the atmosphere were comparable with the two sources of atmospheric PFAAs mentioned above.17
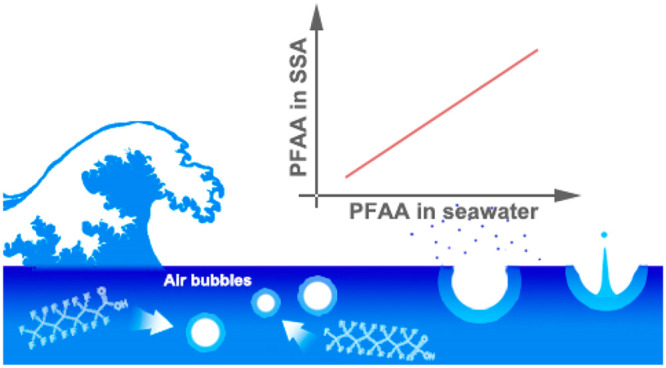
SSA consists of particles ranging from about 10 nm to a few millimeters in diameter, with atmospheric residence times varying from days to seconds.23 The composition of SSA is complex and depends on the particle size. At sizes >1 μm, sea salt usually comprises the majority of the mass while at smaller sizes, the contribution of dissolved and particulate organic matter to the mass increases as the particle size decreases.23 SSA is emitted into the atmosphere by bubble bursting at the sea surface. Breaking waves entrain air into seawater, and while these air bubbles rise toward the sea surface, surface active substances can be scavenged by the air–water interface.24 When bubbles burst, the rupture of the bubble film cap releases numerous fine film droplets, and when the cavity left by the bubble is filled with surrounding seawater, a water jet can rise from the cavity and disintegrate into a few jet droplets.23,25 Film droplets are thought to comprise the majority of submicron SSA, while jet droplets comprise the majority of supermicron SSA.23
SSA is known to be highly enriched with surface active organic substances, especially for the submicron droplets,26,27 indicating the importance of particle size in the enrichment process of surface active substances.24,28,29 Film droplets are more enriched with hydrophobic organic substances, while jet droplets contain a larger portion of water-soluble organic substances.28,30,31 Such distinct differences in chemical composition are likely due to the generation mechanisms of film droplets and jet droplets.31 PFAA homologues vary greatly in physical and chemical properties such as water solubility and critical micelle concentrations (CMC) etc.;20,32 therefore, the different formation mechanisms of film and jet droplets may also affect the enrichment behavior of different PFAAs.
The enrichment factor (EF) of a substance in SSA is defined as the ratio of the concentration of substance X in SSA to its concentration in bulk water, normalized to the Na+ concentration in the corresponding medium.33
| 1 |
where EFX, SSA is the unitless enrichment factor of substance X in SSA sample relative to the bulk water; [X]SSA, [Na+]SSA and [X]water, [Na+]water are the concentrations of X and Na+ in SSA and the bulk water, respectively. In the laboratory study by Johansson et al.,17 the EFs revealed a general trend of increasing PFAA EFs with decreasing particle size. However, this previous study was limited by the fact that only one size bin (0.029–0.99 μm) was included in the submicron range. As such, how PFAA EFs behave as a function of particle size below sizes of 1 μm is still unclear.
The concentrations of PFAAs in seawater can span over several orders of magnitude from the highly polluted coastal areas to the open ocean.34−40 For example, the concentrations of ∑PFAAs can be as high as 1.6–118 ng L–1 in the Chinese Bohai Sea39 while only being <5–343 pg L–1 in the Arctic Ocean.40 PFAA concentrations in the open ocean were reviewed in the previous study by Johansson et al.17 Despite the large variation in water concentrations, the influence of PFAA water concentration on the EFs is unknown. According to Brusseau,41 the ratio of surface excess of a PFAA (i.e., the amount adsorbed at the interface, mol cm–2) to its aqueous concentration (mol cm–3) is constant at environmentally relevant levels. Thus, theoretically, when air is entrained in seawater, the amount of PFAAs adsorbed on the bubbles’ air–water interface and aerosolized should be proportional to the concentrations of PFAAs in seawater. In other words, PFAA EFs should be independent of their concentrations in seawater if the properties of the interface (e.g., surface tension) remain largely unchanged by these surface active substances.
In addition to taking into account the work of Johansson et al.,17 the aim of this study was to conduct further experiments using a sea spray simulation chamber connected to a 14-stage cascade low pressure impactor to investigate the enrichment behavior of PFAAs in SSA, using different PFAA concentrations in water and with improved size-resolution (i.e., below 1 μm). A series of experiments were conducted with concentrations of individual PFAAs in the bulk water ranging from ∼0.3 to 150 ng L–1. In addition, relatively high size-resolution aerosol samples with 5 bin sizes in the submicron range and 5 bin sizes in the supermicron range were collected to investigate PFAA EFs across the full particle size-range relevant for SSA. It is envisioned that the results of this study will help to reduce uncertainties when evaluating the importance of SSA as a source of PFAAs to the atmosphere.
2. Method
2.1. Target Compounds
In total, 17 PFAS were investigated in this study, including 8 perfluoroalkyl carboxylic acids (PFCAs, including perfluoropentanoic acid (PFPeA), perfluorohexanoic acid (PFHxA), perfluoroheptanoic acid (PFHpA), PFOA, perfluorononanoic acid (PFNA), perfluorodecanoic acid (PFDA), perfluoroundecanoic acid (PFUnDA), and perfluorododecanoic acid (PFDoDA)), 3 perfluoroalkanesulfonic acids (PFSAs, including perfluorobutanesulfonic acid (PFBS), perfluorohexanesulfonic acid (PFHxS), and PFOS), 3 x-perfluorooctane sulfonamidoacetic acids (xFOSAAs, including perfluorooctane sulfonamidoacetic acid (FOSAA), N-methyl perfluorooctane sulfonamidoacetic acid (MeFOSAA), and N-ethyl perfluorooctane sulfonamidoacetic acid (EtFOSAA)), and 3 fluoroether acids (4,8-dioxa-3H-perfluorononanoic acid (DONA), 9-chlorohexadecafluoro-3-oxanone-1-sulfonic acid (9Cl-PF3ONS), and 11-chloroeicosafluoro-3-oxaundecane-1-sulfonic acid (11Cl-PF3OUdS)). The technical standards of PFOA (T-PFOA) and PFOS (T-PFOS) were used to study the enrichment behavior of both linear and branched isomers. Details of the target compounds, analytical standards, and reagents used can be found in Tables S1 and S2 in the Supporting Information (SI).
2.2. Sea Spray Simulation Chamber
All experiments were conducted using a sea spray simulation chamber developed by Salter et al.42 as depicted in Figure S1 in the SI. The chamber is made of stainless steel and is 47 cm in diameter and 100 cm in height. All surfaces below the water level on the inside are coated with polytetrafluoroethylene (PTFE). A discussion on the effect of sorption to chamber walls is provided in the SI (section S5). When in use, the chamber is filled with ∼100 L water, leaving ∼40 cm headspace above the water surface. A peristaltic pump (Watson-Marlow, 620S) continuously circulates water from the bottom of the chamber through silicon tubing to a stainless steel nozzle (inner diameter 4.3 mm) at the center of the lid at 3.2 L min–1 to create a plunging jet. The jet hits the water surface and entrains air into the bulk water. When the air bubbles rise to the air–water interface and burst, aerosols are released to the headspace. The size distribution of bubbles created by this plunging jet type of SSA chamber is similar to the size distribution of oceanic bubble plumes.42
Nascent sea spray aerosols (SSA) generated in the chamber are directed to a 14-stage cascade impactor (DLPI+, Dekati). Due to their different inertia, SSA with different sizes are separated on polycarbonate membranes (Nuclepore Track-Etch Membrane, Whatman) on the impactor stages. The cutoff sizes (d50) of the stages, which were calibrated by the provider (Dekati) of the impactor based on Järvinen et al.,43 ranged from 0.015 to 9.91 μm (section S5 and Table S3 in the SI). The sampling line is heated to keep the relative humidity at the impactor inlet below 40% so that SSA are completely dried before entering the impactor. Particle-free sweep air is introduced to the chamber at a slightly higher flow rate than the flow directed to the impactor in order to prevent possible contamination from indoor air.
2.3. Experiments
The experiments were conducted using the sea spray chamber filled with low-organic-carbon standard deionized water (Milli-Q, >18.2 MΩ cm). The salinity of the water in the chamber was adjusted to ∼35 g kg–1 using sodium chloride. Five sets of experiments (10 individual experiments in total) were carried out, with concentrations of the target compounds ranging from 0.3 to 150 ng L–1 (Table 1). The interior of the chamber was cleaned and rinsed with ethanol before use. Target compounds were spiked as a mixture at the beginning of each set of experiments. Considering that the quantity of target compounds added into the chamber water were at least 6–10 times higher than the preceding concentration, the residual from the previous experiment should have only a minor influence. Therefore, to avoid producing large quantities of PFAS contaminated water, the chamber water was not changed between experiments and the concentrations required for the next experiment were achieved by adding further quantities of PFAS mixture. After being spiked, the plunging jet was run overnight to allow the compounds to fully mix with the chamber water. During each experiment, the water temperature was maintained at 15 °C and the air in the headspace was sampled for ∼30 h at a flow rate of 9.6 L min–1 with the plunging jet switched on. The air volume sampled was calculated from the duration of the experiments multiplied by the flow rate. An aliquot of 1 L of chamber water was collected both at the beginning and at the end of each experiment through a tap on the side of the chamber, located approximately halfway between the water surface and the bottom of the chamber. Between experiments, the water level and salinity (∼35 g kg–1) were carefully adjusted using Milli-Q water and sodium chloride so that all experiments were started at the same conditions.
Table 1. Conditions of the SSA Chamber Experiments.
| No. | Experiment code | Duration (h) | Spiked Level (ng L–1) | Salinity (psu) | Temp (°C) | Note | |
|---|---|---|---|---|---|---|---|
| No Spike | 1 | Exp0 | 30.0 | 0 | 34.93 ± 0.06 | 15.09 ± 0.05 | |
| Low concentration | 2 | Exp-L1 | 30.0 | 0.3 | 34.95 ± 0.12 | 15.06 ± 0.02 | |
| 3 | Exp-L2 | 30.0 | 0.3 | 34.99 ± 0.08 | 15.04 ± 0.02 | ||
| Medium concentration | 4 | Exp-M1 | 30.0 | 3 | 35.34 ± 0.14 | 15.08 ± 0.01 | SML was sampled after each experiment in Exp3 |
| 5 | Exp-M2 | 30.1 | 3 | 34.90 ± 0.12 | 15.07 ± 0.03 | ||
| 6 | Exp-M3 | 30.6 | 3 | 35.52 ± 0.27 | 15.11 ± 0.09 | ||
| High concentration | 7 | Exp-H1 | 30.3 | 20 | 34.75 ± 0.11 | 15.08 ± 0.03 | Isomer patterns were analyzed. SML was sampled after each experiment in Exp-H. |
| 8 | Exp-H2 | 30.3 | 20 | 34.94 ± 0.09 | 15.08 ± 0.04 | ||
| 9 | Exp-H3 | 30.0 | 20 | 34.91 ± 0.08 | 15.09 ± 0.04 | ||
| Ultrahigh concentration | 10 | Exp-U | 30.8 | 150 | 35.10 ± 0.05 | 15.04 ± 0.11 |
For the medium-concentration (Exp-M) and high-concentration experiments (Exp-H), the surface microlayer (SML) of the chamber water was sampled in triplicate using a glass plate as per the method of Harvey44 (section S1 in the SI). The SSA samples, chamber water samples, and SML samples from Exp-H were analyzed for PFOA and PFOS structural isomer patterns.
Enrichment factors (EF) were calculated for each experiment using 1 to evaluate the enrichment of PFAAs on different sizes of SSA and in the SML relative to bulk seawater.
2.4. Instrumental Analysis
The polycarbonate membranes containing SSA were carefully unloaded from the impactor and sonicated individually in 10 mL Milli-Q water for 30 min. After a 0.5 mL subsample was taken for sodium analysis, the chamber water samples, SML samples, and remaining aliquots of the SSA samples were spiked with a mixture of mass-labeled internal standards (IS) and concentrated on Oasis weak-anion exchange (WAX) solid-phase extraction (SPE) cartridges (6 cm3, 150 mg, 30 mm) using a previously published method (described in the SI).45
The target compounds were analyzed on an Acquity ultraperformance liquid chromatography system coupled to a Xevo TQ-S tandem mass spectrometer (UPLC/MS/MS; Waters Corp.) based on a previously published method (described in the SI).46 Sodium concentrations in the samples were determined using ion chromatography. Details regarding the extraction and analysis of PFAAs and sodium can be found in the SI.
2.5. QA/QC
Prior to the experiments, tests were carried out to determine an appropriate duration for sampling of SSA. In the current study, 30 h was considered the optimal duration to achieve quantifiable amount of PFAAs on the submicron impactor stages while avoiding blockage inside the impactor caused by excess SSA loading (Section S4 and Figure S2 in SI).
Handling of the SSA samples was carried out in a glovebox in order to avoid any contamination from indoor particles. Handling blanks for the SSA samples were prepared before each set of experiments. To assess the accuracy and precision of the analysis, native target compounds were spiked into 1 L of salted Milli-Q water (500 pg/L individual PFAS, NaCl ∼ 35 g/L, n = 3) as well as on unused membranes (75 pg/membrane, n = 3) and analyzed with the samples. All statistical analyses were performed using R (v3.5.3). Details regarding the blanks, MQLs, IS recoveries, the results of spike-recovery tests, and statistical analyses are presented in in the SI.
3. Results
3.1. Na+ and the Target Compounds Mass-Size Distribution in SSA Samples
The sodium concentrations on stages 02–05 (d50 = 0.0150 to 0.0944 μm) were below the MQL and were therefore excluded from the following analysis. SSA with diameters ≥0.951 μm accounted for approximately 98% of the total sodium mass. Mass mode (dM) was defined as the stage with the highest MNa/d logd50, where MNa was the sodium mass on the stages. dM was found on the stage with d50 = 3.67 μm for all experiments. The mass-size distribution showed no significant difference between the experiments, indicating the addition of PFAAs in the water had little impact on SSA production (Figure S4 in the SI).
The mass of the target compounds on the impactor stages correlated strongly with sodium (Pearson’s r > 0.7, p < 0.001). Similar to sodium, the major portion (∼96%) was found on stages with d50 > 0.951 μm. However, unlike the sodium mass-size distribution, dM of the target compounds either appeared at d50 = 2.48 or 3.67 μm (Figure S5 shows Exp-H1 as an example).
3.2. Concentrations of the Target Compounds in the Chamber Water
Concentrations of the target compounds in the chamber water and SML samples were shown in Figure S3 and Tables S5 and S6 in the SI. The mass balance of the target compounds in the chamber was calculated based on the concentrations measured in the SSA samples and the water samples from the beginning (after equilibration) and the end of the experiments. After each experiment, concentrations of PFPeA, PFHxA, and PFBS in chamber water only decreased by <5% while the other compounds decreased by 25–45% on average. The decrease was chain length dependent, with a larger decrease observed with increasing length of the perluorinated carbon chain (Figure S6 in the SI). Aerosolization was estimated to be the main cause of the concentration decrease for PFAAs with number of perfluorinated carbons (NPC) ≥ 7, with 10–30% of the initial mass accounted for in the SSA samples (e.g., 21.8 ± 3.1% for PFDA, average of all spiked experiments, Figure S7 in the SI). The decrease in concentrations of PFAAs with NPC ≥ 7 (25–45% after each experiment) was larger than that observed by Johansson et al.,17 which was 10–40% after three experiments using the same equipment. The difference might be explained by the increased SSA production due to longer sampling duration and higher plunging jet flow rate used in this study.
3.3. Enrichment Factors of the Target Compounds in SML and SSA Samples
The EFSML of the target compounds are presented in Figure S8 and Table S6 in the SI. The EFSML of PFBS and PFHxA were not significantly different from 1 (p > 0.05), indicating no enrichment of these two compounds in the SML. Other compounds with NPC < 8 only showed slight enrichment (1.2–3.2). The EFSML increased markedly for compounds with NPC > 8 and ranged from 13 ± 3.8 for PFNA to 77 ± 20 for PFDoDA. The EFSML increased with increasing NPC and revealed an S-shape trend (see PFCAs in Figure S8). In contrast, some other parameters that characterize the surface activity of PFCAs, for example, the CMCs, the surface/bulk water distribution coefficient (Csurface/Cwater – 1) reported by Reth et al.,20 as well as the interfacial adsorption coefficient (the ratio of surface excess (mol/cm2) to Cwater) reported by Brusseau,41 all demonstrated log–linear relationships with the number of perfluorinated carbons. Bias in the glass plate sampling method used in the present study may be one of the causes for the discrepancy, since highly surface-active substances such as PFDoDA may be adsorbed to the glass plate resulting in an underestimation of the EFSML.
All target compounds, including those not enriched (PFBS and PFHxA) or only slightly enriched (e.g., DONA) in the SML, were found to be highly enriched in SSA of all sizes (Figure 1 and Figure S9). The calculated values of EFSSA for the target compounds on different impactor stages spanned over 5 orders of magnitude, ranging from 19 (PFPeA, Exp-M1, d50 = 2.48 μm) to 4.6 × 10⁵ (PFDoDA, Exp-U, d50 = 0.154 μm).
Figure 1.
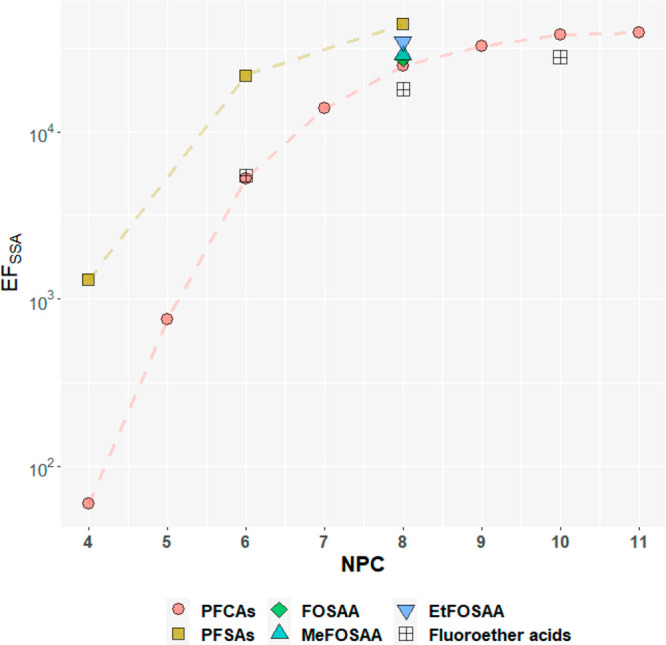
Relationship between enrichment factors (EFSSA) and NPC. Markers represent geometric mean EFs of individual compounds on SSA of all sizes from the spiked experiments. Dashed lines are added to aid visualization. The Y-axis is a logarithmic scale. For the three fluoroether acids, NPC includes polyfluorinated carbons.
Samples from the high-concentration experiments (Exp-H) were used to investigate the behaviors of PFOA and PFOS structural isomers, and the result was generally similar to those from Johansson et al.17 (details in the SI). The percentages of branched PFOA and POFS were found to be significantly lower in SSA samples than in the chamber water samples (t test, p < 0.01), which might be a consequence of preferential aerosolization of linear PFOA and linear PFOS.
4. Discussion
4.1. Enrichment Behavior of Different Target Compounds in SSA
The EFSSA of the target compounds was dependent on the NPC and revealed a curvilinear relationship with NPC (Figures 1 and S9). For PFCAs with NPC ≤ 6, each additional −CF2-moiety corresponded to approximately a 10-fold increase in the EFSSA on all stages. For PFCAs with NPC ≥ 7, however, the increase in EFSSA with increasing NPC was greatly reduced and eventually reached a plateau with comparable EFSSA of PFDA, PFUnDA, and PFDoDA (Figure 1). Lunkenheimer et al.47 pointed out that at low concentrations (<10–4 M), PFCAs with NPC ≥ 7 may require minutes to hours to establish adsorption equilibrium at the water–air interface. Since the air bubble only traveled a short distance (∼30 cm) to rise to the surface in the SSA chamber, the time for the long-chain PFAAs to reach equilibrium at the bubble interface might be insufficient, which may be the cause for the leveling off of the log10EFSSA. However, the behavior of surfactants can be influenced by many factors and could be more complex for surfactant mixtures.48 As such, further investigation is needed to understand the possible causes for this curvilinear relationship between EFSSA and perfluorinated carbon chain length.
Distinct differences among the EFs for different classes of PFAS were observed. The headgroup can affect the molecular geometry, hydrophile, etc. and therefore influence the surface activity of the surfactants.49,50 For example, the EFSSA of PFSAs on each stage were generally comparable to that of PFCAs with one more −CF2- moiety (PFBS and PFHxA, PFHxS and PFOA, PFOS and PFDA, Figures 1 and S9). However, the surface activity appears to be predominantly determined by the NPC when the head groups are similar. For example, PFOS and xFOSAAs have the same NPC while their EFSSA only varied slightly. The fluoroether acids such as DONA (CF3O(CF2)3OCFHCF2COONa) and 9Cl-PF3ONS (Cl(CF2)6O(CF2)2SO3K) demonstrated comparable EFSSA as those PFAAs with the same NPC, namely PFHpA and PFOS. Consequently, it might be possible to estimate the EFSSA of anionic PFAS from molecular structure applying simple rules based on the number of perfluorinated carbons and the type of headgroup.
4.2. Effects of the Concentrations in the Chamber Water on the Enrichment Process
Theoretically, at environmentally relevant concentrations (generally <0.1 mg L–1) the ratio of surface excess (mol cm–2) to aqueous concentration (mol cm–3) of a fluorinated surfactant should be constant.41 Consequently, the amounts of chemical substance scavenged on the air–water interface of air bubbles as well as the amounts aerosolized after bubbles burst should be proportional to their concentrations in the water. Tseng et al.51 found that the amount of surface active organic compounds transferred to air by bubble bursting was linearly proportional to the amount in the SML. Similarly, in the present study, the masses of the target compounds in the SSA of all sizes demonstrated strong positive linear relationships (p < 0.05, r2 > 0.9) with their concentrations in the chamber water (Figure 2). Such strong linearity was observed on each of the impactor stages (Table S7 in the SI). Therefore, for a given particle size, the amount of the target compounds aerosolized with SSA during the experiments was proportional to their concentrations in water (i.e., [PFAAs]SSA/[PFAAs]water = constant). According to 1, the EFSSA for the target compounds would not change with PFAA concentrations as long as the aerosol production process is unaffected ([Na+]SSA/[Na+]water). As a result, the EFSSA showed no significant correlation with the concentration in water for almost all particle sizes except for DONA and 11Cl-PF3OUdS (Spearman’s rho >0.70, p < 0.05). However, the EFSSA in the ultrahigh-concentration experiment were found to be higher than those in the other experiments. The total concentrations of all target compounds added up to 1.1 μg L–1 in Exp-U. Possibly the high level of surfactants changed the properties of the bubble film cap (e.g., film pressure52), which could in turn have impacted the SSA production process. If Exp-U was excluded, correlations between EFSSA and concentration in water were only found for DONA and 11Cl-PF3OUdS on stages with d50 ≥ 1.64 μm but not for all the other target compounds. Since concentrations of PFAAs in seawater is unlikely to reach μg L–1 levels, it should be reasonable to assume that variations in concentrations are unlikely to affect the EFSSA of the target compounds at environmentally relevant levels. However, variations of EFSSA were indeed observed across the experiments, especially for the fraction of SSA with smaller diameters (<1.64 μm). This uncertainty may be due to the handling of the SSA samples and sodium analysis. Particles were dried before they entered the impactor and substrates on the stages were not greased, so particle bouncing inside the impactor was likely to occur during sampling. Additionally, the amount of sodium collected on the lower stages (<1.64 μm) can be close to the detection limit, which could also raise uncertainty in the measured sodium mass.
Figure 2.

Correlation between the target compound concentrations in water and the total mass in SSA (normalized to air volume). Both x- and y-axis are in logarithm scale. PFAAs concentration in SSA can be expressed as log10[PFAA]SSA= k × log10[PFAA]water + b, for example, log10[PFOA]SSA = 1.03 × log10[PFAA]water – 0.16. Each marker represents the sum of the mass in the SSA of all sizes from one experiment. The dashed color lines indicate linear fits. The dashed gray vertical lines indicate the expected concentration in the spiked experiments. The slope and r2 value for each of the impactor stages is provided in Table S7 in the SI.
For most of the target compounds, the EFSML from Exp-H were significantly higher than those from Exp-M (t test, p < 0.001) as shown in Figure S8 in the SI. However, no correlation was found between the compounds’ concentration in the SML samples and their EFSML (p > 0.05). The discrepancy may be due to the uncertainty of the glass plate method for SML sampling as mentioned by Johansson et al.17 Although all samples were collected by dipping the glass plate 50 times, the SML samples from Exp-M have larger volumes, implying a thicker sampling depth. As a result, these samples were likely influenced by increased dilution with bulk water compared to samples from Exp-H, resulting in lower EF than those for SML samples from Exp-H.
4.3. Size-Resolved Enrichment Behavior of the Target Compounds
In general, the EFSSA demonstrated increasing trends with decreasing particle size, but the patterns were found to be different for different target compounds as shown in Figure 3. Significant negative correlations (Spearman’s rho ←0.65, p < 0.05) were observed between EFSSA and particle size for PFCAs with NPC ≥ 8, PFSAs, and derivatives, 9Cl-PF3ONS and 11Cl-PF3OUdS, in almost all experiments but not for PFCAs with NPC ≤ 7 and DONA. Interestingly, the increasing trends of EFSSA with decreasing particle size were not continuous. The EFSSA on stage 11 (d50 = 1.64 μm) were found to be significantly higher (t test, p < 0.05) than those on stage 10 (d50 = 0.951 μm) for most of the compounds except PFUnDA, PFDoDA, PFBS, PFHxS, 9Cl-PF3ONS, and 11Cl-PF3OUdS. Accordingly, the EFSSA size profiles in Figure 3 could be divided into two parts: (1) d50 ≥ 1.64 μm and (2) 0.154 μm ≤ d50 < 1.64 μm.
Figure 3.

Changes of the geometric mean EFSSA of the target compounds with particle size (d50). Markers represent geometric mean of EFSSA for all spiked experiments (low-, medium-, high-, and ultrahigh-concentration experiments) and the dashed lines are added to guide the eye.
The spray drop adsorption
model (SDAM) proposed by Oppo et al.24 suggested
that the surface-area-to-volume ratio
is a key factor to understand the transfer of surfactants from seawater
to the atmosphere via SSA of various sizes. However, the target compounds
in the current study behaved differently in the above-mentioned two
size ranges. Assuming that SSA has a spherical shape, the surface-area-to-volume
ratio of SSA ( ) can be simply represented by 1/d50.
In the size range of d50 ≥ 1.64 μm, 1/d50 and the logarithm of EFSSA (log10EFSSA) revealed a linear relationship (p <
0.001, r2 > 0.9) for PFHxS and other PFAAs with NPC
≥
8 (e.g., r2 = 0.94 for PFNA, Table S8). Such a strong linear relationship indicates that the enrichment
behavior of PFAAs with NPC ≥ 8 in this particle size range
can be well explained by the particle’s surface-area-to-volume
ratio. However, the linearity between log10EFSSA and 1/d50 was found to be weaker and less prominent as
the NPC decreased (e.g., r2 = 0.84, slope = 1.2 and r2 = 0.40, slope = 0.59 for PFOA and PFHpA, respectively). The
enrichment of 9Cl-PF3ONS (r2 = 0.84) and 11Cl-PF3OUdS (r2 = 0.72) also showed relatively good linearity comparable
to PFOA in this size range. However, such linearity was not observed
for PFPeA and PFHxA (p > 0.05), and although the
log10EFSSA of DONA was significantly correlated
with 1/d50, the linearity was very weak (r2 =
0.01). The decrease in linearity with decreasing NPC in this size
range suggests that the surface-area-to-volume ratio was the dominant
factor affecting the enrichment process for PFAAs with NPC ≥
8 but that it was less influential for PFAAs with NPC ≤ 7.
) can be simply represented by 1/d50.
In the size range of d50 ≥ 1.64 μm, 1/d50 and the logarithm of EFSSA (log10EFSSA) revealed a linear relationship (p <
0.001, r2 > 0.9) for PFHxS and other PFAAs with NPC
≥
8 (e.g., r2 = 0.94 for PFNA, Table S8). Such a strong linear relationship indicates that the enrichment
behavior of PFAAs with NPC ≥ 8 in this particle size range
can be well explained by the particle’s surface-area-to-volume
ratio. However, the linearity between log10EFSSA and 1/d50 was found to be weaker and less prominent as
the NPC decreased (e.g., r2 = 0.84, slope = 1.2 and r2 = 0.40, slope = 0.59 for PFOA and PFHpA, respectively). The
enrichment of 9Cl-PF3ONS (r2 = 0.84) and 11Cl-PF3OUdS (r2 = 0.72) also showed relatively good linearity comparable
to PFOA in this size range. However, such linearity was not observed
for PFPeA and PFHxA (p > 0.05), and although the
log10EFSSA of DONA was significantly correlated
with 1/d50, the linearity was very weak (r2 =
0.01). The decrease in linearity with decreasing NPC in this size
range suggests that the surface-area-to-volume ratio was the dominant
factor affecting the enrichment process for PFAAs with NPC ≥
8 but that it was less influential for PFAAs with NPC ≤ 7.
In the size range between 0.154 and 1.64 μm, the surface-area-to-volume ratio appeared to play a minor role in the enrichment process. Only very weak linearity between log10EFSSA and 1/d50 (p < 0.05, slope <0.15 and r2 < 0.55) was found for PFCAs with NPC ≤ 9, PFBS, PFHxS, MeFOSAA, and DONA, while no correlation was found for the other compounds. Therefore, there were likely factors other than the surface-area-to-volume ratio that governed or limited the enrichment of the target compounds. Additionally, the EFSSA in this size range were significantly higher (t test, p < 0.05) than those in the size range d50 ≥ 1.64 μm, except for PFPeA, PFHxA, and DONA. Such distinct behaviors of the target compounds in the two size ranges suggest the enrichment process might be affected by two different mechanisms.
The majority of the supermicron particles are comprised of jet droplets, which are formed by the directly ejected water from the base of the bubble following the collapse of the bubble cavity.23,25,31 The strong linearity between log10EFSSA and 1/d50 in the supermicron range might be partly explained by the generation process of jet droplets. As strong surfactants, PFAAs should have higher concentrations at the surface of the water jet (air–water interface) than inside the jet (bulk water). When the ejected water is disintegrated to form jet droplets, small droplets with higher surface-area-to-volume ratio might be less diluted by the bulk water from inside the water jet than large droplets. In this case, EFSSA may have strong correlation with 1/d50, and the effect may be more prominent for long-chain PFAAs relative to short-chain PFAAs due to higher surface activity.
Submicron particles are dominated by film droplets which are emitted by the rupture of bubble caps. The comparable EFSSA and weak linear relationship with 1/d50 in the size range 0.154 μm ≤ d50 < 1.64 μm implies the surface-area-to-volume ratio has minor influence and the enrichment process is limited by one or more factors. After an air bubble reaches the water surface, the film cap is continuously thinning out until puncture occurs close to the base of the film cap,53 so the enrichment of the target compounds in the film droplets might be limited by the total amount on the bubbles’ film cap at the onset of burst. Factors that can influence the size and number of film droplets produced, such as bubble size, film cap thickness, the rupture mechanisms, and bubble groups,52,53 might also affect EFSSA. In addition, a recent study by Wang et al.31 showed jet droplets emitted by sub 100-μm bubbles could contribute a large portion of the submicron droplets. The variance of EFSSA in the submicron range could be further increased considering the different production mechanism of film droplets and jet droplets. For a mixture of surfactants, different compounds are thought to compete for surface area and the behavior of surfactant mixture is likely to be dominated by the component with the greatest surface activity.54,55 Because of the higher surface-area-to-volume ratio of finer film droplets, there would be a relatively larger total surface area for PFAAs on the film cap to partition to during the droplets formation, which may explain the correlations between EF and 1/d50 observed for compounds with NPC ≤ 9. However, the mechanism by which submicron film droplets are formed upon bubble bursting remains unclear.52 Further research is necessary to improve understanding of PFAA enrichment behavior in this size range.
The EFSSA in particles with d50 ≥ 1.64 μm in the present study were approximately 1 order of magnitude higher than the reported values for a similar size range (≥1.60 μm) by Johansson et al.17 The EFSSA in the submicron range were higher than the values of 0.029–0.99 μm in Johansson et al.17 as well but within the same order of magnitude. Moreover, the EFSML for PFCAs with NPC ≥ 7 and PFOS were about two times higher than the values reported by Johansson et al.17 though the experimental setup was the same and concentrations of the compounds were comparable. The differences might be due to the higher plunging jet flow rate (3.0 L min–1) and longer experiment duration (30 h) in this study compared to Johansson et al.,17 which was 1.7 L min–1 and 6 h, respectively. A higher plunging jet flow would increase air entrainment56 so it might be more efficient in transferring PFAAs from the bulk water to the SML, leading to higher local concentration near the bubble bursting region.57 Therefore, if the water samples were collected from the upper part of the chamber water (e.g., 10–20 cm below the surface) instead of from the middle, the influence of jet rate on EFSSA might be reduced. In addition, due to the higher speed of the plunging jet, the air bubbles likely penetrate deeper in this study resulting in a longer path to the water surface. Previous studies using frits to generate air bubbles have demonstrated that higher airflow rate51 and longer bubble path58 could increase the transport of surface active organic matter to SML and to air. However, the effect of the plunging jet rate needs to be considered when extrapolating laboratory studies to the real conditions.
The results of the present study suggest that the variability in seawater concentrations of PFAAs has little influence on laboratory-derived EFs, and thus the findings of Johansson et al.17 remain valid, even for lower environmentally realistic PFAA seawater concentrations. Uncertainties remain, however, and further laboratory experiments and field evidences are required before the importance of this process on the global fate and transport of PFAAs and other substances can be confirmed and the process is well-parametrized for inclusion in global models. For example, the influence of the plunging jet rate and the interaction between PFAAs and organic matters in seawater should be investigated in future studies.
Acknowledgments
This study was financially supported by the Swedish research council FORMAS (grant number 2016-00644).
Supporting Information Available
The Supporting Information is available free of charge at https://pubs.acs.org/doi/10.1021/acs.est.0c03804.
Surface microlayer (SML) sampling, sample extraction, instrumental analysis, determination of sampling duration, QA&QC, statistical analysis, PFOA and PFOS isomer patterns in the chamber water, SML and SSA samples (PDF)
The authors declare no competing financial interest.
Supplementary Material
References
- Buck R. C; Franklin J.; Berger U.; Conder J. M; Cousins I. T; de Voogt P.; Jensen A. A.; Kannan K.; Mabury S. A; van Leeuwen S. P. Perfluoroalkyl and Polyfluoroalkyl Substances in the Environment: Terminology, Classification, and Origins. Integr. Environ. Assess. Manage. 2011, 7 (4), 513–541. 10.1002/ieam.258. [DOI] [PMC free article] [PubMed] [Google Scholar]
- Wang Z.; Cousins I. T.; Scheringer M.; Buck R. C.; Hungerbühler K. Global Emission Inventories for C4–C14 Perfluoroalkyl Carboxylic Acid (PFCA) Homologues from 1951 to 2030, Part I: Production and Emissions from Quantifiable Sources. Environ. Int. 2014, 70, 62–75. 10.1016/j.envint.2014.04.013. [DOI] [PubMed] [Google Scholar]
- Cousins I. T.; Goldenman G.; Herzke D.; Lohmann R.; Miller M.; Ng C. A.; Patton S.; Scheringer M.; Trier X.; Vierke L.; Wang Z.; DeWitt J. C. The Concept of Essential Use for Determining When Uses of PFASs Can Be Phased Out. Environ. Sci. Process. Impacts 2019, 21 (11), 1803–1815. 10.1039/C9EM00163H. [DOI] [PMC free article] [PubMed] [Google Scholar]
- Wang Z.; Boucher J. M.; Scheringer M.; Cousins I. T.; Hungerbühler K. Toward a Comprehensive Global Emission Inventory of C4–C10 Perfluoroalkanesulfonic Acids (PFSAs) and Related Precursors: Focus on the Life Cycle of C8-Based Products and Ongoing Industrial Transition. Environ. Sci. Technol. 2017, 51 (8), 4482–4493. 10.1021/acs.est.6b06191. [DOI] [PubMed] [Google Scholar]
- Ahrens L. Polyfluoroalkyl Compounds in the Aquatic Environment: A Review of Their Occurrence and Fate. J. Environ. Monit. 2011, 13 (1), 20–31. 10.1039/C0EM00373E. [DOI] [PubMed] [Google Scholar]
- Ahrens L.; Gerwinski W.; Theobald N.; Ebinghaus R. Sources of Polyfluoroalkyl Compounds in the North Sea, Baltic Sea and Norwegian Sea: Evidence from Their Spatial Distribution in Surface Water. Mar. Pollut. Bull. 2010, 60 (2), 255–260. 10.1016/j.marpolbul.2009.09.013. [DOI] [PubMed] [Google Scholar]
- Dreyer A.; Weinberg I.; Temme C.; Ebinghaus R. Polyfluorinated Compounds in the Atmosphere of the Atlantic and Southern Oceans: Evidence for a Global Distribution. Environ. Sci. Technol. 2009, 43 (17), 6507–6514. 10.1021/es9010465. [DOI] [PubMed] [Google Scholar]
- Giesy J. P.; Kannan K. Global Distribution of Perfluorooctane Sulfonate in Wildlife. Environ. Sci. Technol. 2001, 35 (7), 1339–1342. 10.1021/es001834k. [DOI] [PubMed] [Google Scholar]
- Haug L. S.; Thomsen C.; Becher G. Time Trends and the Influence of Age and Gender on Serum Concentrations of Perfluorinated Compounds in Archived Human Samples. Environ. Sci. Technol. 2009, 43 (6), 2131–2136. 10.1021/es802827u. [DOI] [PubMed] [Google Scholar]
- Yamashita N.; Kannan K.; Taniyasu S.; Horii Y.; Petrick G.; Gamo T. A Global Survey of Perfluorinated Acids in Oceans. Mar. Pollut. Bull. 2005, 51 (8), 658–668. 10.1016/j.marpolbul.2005.04.026. [DOI] [PubMed] [Google Scholar]
- Pickard H. M.; Criscitiello A. S.; Spencer C.; Sharp M. J.; Muir D. C. G.; Silva A. O. D.; Young C. J. Continuous Non-Marine Inputs of per- and Polyfluoroalkyl Substances to the High Arctic: A Multi-Decadal Temporal Record. Atmos. Chem. Phys. 2018, 18 (7), 5045–5058. 10.5194/acp-18-5045-2018. [DOI] [Google Scholar]
- Yeung L. W. Y.; Dassuncao C.; Mabury S.; Sunderland E. M.; Zhang X.; Lohmann R. Vertical Profiles, Sources, and Transport of PFASs in the Arctic Ocean. Environ. Sci. Technol. 2017, 51 (12), 6735–6744. 10.1021/acs.est.7b00788. [DOI] [PubMed] [Google Scholar]
- Cai M.; Yang H.; Xie Z.; Zhao Z.; Wang F.; Lu Z.; Sturm R.; Ebinghaus R. Per- and Polyfluoroalkyl Substances in Snow, Lake, Surface Runoff Water and Coastal Seawater in Fildes Peninsula, King George Island, Antarctica. J. Hazard. Mater. 2012, 209–210, 335–342. 10.1016/j.jhazmat.2012.01.030. [DOI] [PubMed] [Google Scholar]
- Prevedouros K.; Cousins I. T.; Buck R. C.; Korzeniowski S. H. Sources, Fate and Transport of Perfluorocarboxylates. Environ. Sci. Technol. 2006, 40 (1), 32–44. 10.1021/es0512475. [DOI] [PubMed] [Google Scholar]
- Armitage J.; Cousins I. T.; Buck R. C.; Prevedouros K.; Russell M. H.; MacLeod M.; Korzeniowski S. H. Modeling Global-Scale Fate and Transport of Perfluorooctanoate Emitted from Direct Sources. Environ. Sci. Technol. 2006, 40 (22), 6969–6975. 10.1021/es0614870. [DOI] [PubMed] [Google Scholar]
- Armitage J. M.; MacLeod M.; Cousins I. T. Modeling the Global Fate and Transport of Perfluorooctanoic Acid (PFOA) and Perfluorooctanoate (PFO) Emitted from Direct Sources Using a Multispecies Mass Balance Model. Environ. Sci. Technol. 2009, 43 (4), 1134–1140. 10.1021/es802900n. [DOI] [PubMed] [Google Scholar]
- Johansson J. H.; Salter M. E.; Navarro J. C. A.; Leck C.; Nilsson D. E.; Cousins I. T. Global Transport of Perfluoroalkyl Acids via Sea Spray Aerosol. Environ. Sci. Process. Impacts 2019, 21 (4), 635–649. 10.1039/C8EM00525G. [DOI] [PubMed] [Google Scholar]
- McMurdo C. J.; Ellis D. A.; Webster E.; Butler J.; Christensen R. D.; Reid L. K. Aerosol Enrichment of the Surfactant PFO and Mediation of the Water–Air Transport of Gaseous PFOA. Environ. Sci. Technol. 2008, 42 (11), 3969–3974. 10.1021/es7032026. [DOI] [PubMed] [Google Scholar]
- Psillakis E.; Cheng J.; Hoffmann M. R.; Colussi A. J. Additions/Corrections to Enrichment Factors of Perfluoroalkyl Oxoanions at the Air/Water Interface. J. Phys. Chem. A 2009, 113 (31), 9050–9050. 10.1021/jp9058559. [DOI] [PubMed] [Google Scholar]
- Reth M.; Berger U.; Broman D.; Cousins I. T.; Nilsson E. D.; McLachlan M. S. Water-to-Air Transfer of Perfluorinated Carboxylates and Sulfonates in a Sea Spray Simulator. Environ. Chem. 2011, 8 (4), 381–388. 10.1071/EN11007. [DOI] [Google Scholar]
- Webster E.; Ellis D. A. Potential Role of Sea Spray Generation in the Atmospheric Transport of Perfluorocarboxylic Acids. Environ. Toxicol. Chem. 2010, 29 (8), 1703–1708. 10.1002/etc.228. [DOI] [PubMed] [Google Scholar]
- Wong F.; Shoeib M.; Katsoyiannis A.; Eckhardt S.; Stohl A.; Bohlin-Nizzetto P.; Li H.; Fellin P.; Su Y.; Hung H. Assessing Temporal Trends and Source Regions of Per- and Polyfluoroalkyl Substances (PFASs) in Air under the Arctic Monitoring and Assessment Programme (AMAP). Atmos. Environ. 2018, 172, 65–73. 10.1016/j.atmosenv.2017.10.028. [DOI] [Google Scholar]
- de Leeuw G.; Andreas E. L; Anguelova M. D.; Fairall C. W.; Lewis E. R.; Schulz M.; Schwartz S. E. Production Flux of Sea Spray Aerosol. Rev. Geophys. 2011, 49 (2), RG2001. 10.1029/2010RG000349. [DOI] [Google Scholar]
- Oppo C.; Bellandi S.; Degli Innocenti N.; Stortini A. M.; Loglio G.; Schiavuta E.; Cini R. Surfactant Components of Marine Organic Matter as Agents for Biogeochemical Fractionation and Pollutant Transport via Marine Aerosols. Mar. Chem. 1999, 63 (3), 235–253. 10.1016/S0304-4203(98)00065-6. [DOI] [Google Scholar]
- Lewis E. R.; Schwartz S. E.. Sea Salt Aerosol Production: Mechanisms, Methods, Measurements and Models; Geophysical Monograph Series; AGU: Washington D.C., 2004; Vol. 152. [Google Scholar]
- Bertram T. H.; Cochran R. E.; Grassian V. H.; Stone E. A. Sea Spray Aerosol Chemical Composition: Elemental and Molecular Mimics for Laboratory Studies of Heterogeneous and Multiphase Reactions. Chem. Soc. Rev. 2018, 47 (7), 2374–2400. 10.1039/C7CS00008A. [DOI] [PubMed] [Google Scholar]
- Jayarathne T.; Sultana C. M.; Lee C.; Malfatti F.; Cox J. L.; Pendergraft M. A.; Moore K. A.; Azam F.; Tivanski A. V.; Cappa C. D.; Bertram T. H.; Grassian V. H.; Prather K. A.; Stone E. A. Enrichment of Saccharides and Divalent Cations in Sea Spray Aerosol During Two Phytoplankton Blooms. Environ. Sci. Technol. 2016, 50 (21), 11511–11520. 10.1021/acs.est.6b02988. [DOI] [PubMed] [Google Scholar]
- Burrows S. M.; Ogunro O.; Frossard A. A.; Russell L. M.; Rasch P. J.; Elliott S. M. A Physically Based Framework for Modeling the Organic Fractionation of Sea Spray Aerosol from Bubble Film Langmuir Equilibria. Atmos. Chem. Phys. 2014, 14 (24), 13601–13629. 10.5194/acp-14-13601-2014. [DOI] [Google Scholar]
- Quinn P. K.; Collins D. B.; Grassian V. H.; Prather K. A.; Bates T. S. Chemistry and Related Properties of Freshly Emitted Sea Spray Aerosol. Chem. Rev. 2015, 115 (10), 4383–4399. 10.1021/cr500713g. [DOI] [PubMed] [Google Scholar]
- Cochran R. E.; Laskina O.; Jayarathne T.; Laskin A.; Laskin J.; Lin P.; Sultana C.; Lee C.; Moore K. A.; Cappa C. D.; Bertram T. H.; Prather K. A.; Grassian V. H.; Stone E. A. Analysis of Organic Anionic Surfactants in Fine and Coarse Fractions of Freshly Emitted Sea Spray Aerosol. Environ. Sci. Technol. 2016, 50 (5), 2477–2486. 10.1021/acs.est.5b04053. [DOI] [PubMed] [Google Scholar]
- Wang X.; Deane G. B.; Moore K. A.; Ryder O. S.; Stokes M. D.; Beall C. M.; Collins D. B.; Santander M. V.; Burrows S. M.; Sultana C. M.; Prather K. A. The Role of Jet and Film Drops in Controlling the Mixing State of Submicron Sea Spray Aerosol Particles. Proc. Natl. Acad. Sci. U. S. A. 2017, 114 (27), 6978–6983. 10.1073/pnas.1702420114. [DOI] [PMC free article] [PubMed] [Google Scholar]
- Wang Z.; MacLeod M.; Cousins I. T.; Scheringer M.; Hungerbühler K. Using COSMOtherm to Predict Physicochemical Properties of Poly- and Perfluorinated Alkyl Substances (PFASs). Environ. Chem. 2011, 8 (4), 389–398. 10.1071/EN10143. [DOI] [Google Scholar]
- Duce R. A.; Stumm W.; Prospero J. M. Working Symposium on Sea-Air Chemistry: Summary and Recommendations. J. Geophys. Res. 1972, 77 (27), 5059–5061. 10.1029/JC077i027p05059. [DOI] [Google Scholar]
- Benskin J. P.; Muir D. C. G.; Scott B. F.; Spencer C.; De Silva A. O.; Kylin H.; Martin J. W.; Morris A.; Lohmann R.; Tomy G.; Rosenberg B.; Taniyasu S.; Yamashita N. Perfluoroalkyl Acids in the Atlantic and Canadian Arctic Oceans. Environ. Sci. Technol. 2012, 46 (11), 5815–5823. 10.1021/es300578x. [DOI] [PubMed] [Google Scholar]
- González-Gaya B.; Dachs J.; Roscales J. L.; Caballero G.; Jiménez B. Perfluoroalkylated Substances in the Global Tropical and Subtropical Surface Oceans. Environ. Sci. Technol. 2014, 48 (22), 13076–13084. 10.1021/es503490z. [DOI] [PubMed] [Google Scholar]
- Kwok K. Y.; Wang X.-H.; Ya M.; Li Y.; Zhang X.-H.; Yamashita N.; Lam J. C. W.; Lam P. K. S. Occurrence and Distribution of Conventional and New Classes of Per- and Polyfluoroalkyl Substances (PFASs) in the South China Sea. J. Hazard. Mater. 2015, 285, 389–397. 10.1016/j.jhazmat.2014.10.065. [DOI] [PubMed] [Google Scholar]
- Yamazaki E.; Taniyasu S.; Ruan Y.; Wang Q.; Petrick G.; Tanhua T.; Gamo T.; Wang X.; Lam P. K. S.; Yamashita N. Vertical Distribution of Perfluoroalkyl Substances in Water Columns around the Japan Sea and the Mediterranean Sea. Chemosphere 2019, 231, 487–494. 10.1016/j.chemosphere.2019.05.132. [DOI] [PubMed] [Google Scholar]
- Zheng H.; Wang F.; Zhao Z.; Ma Y.; Yang H.; Lu Z.; Cai M.; Cai M. Distribution Profiles of Per- and Poly Fluoroalkyl Substances (PFASs) and Their Re-Regulation by Ocean Currents in the East and South China Sea. Mar. Pollut. Bull. 2017, 125 (1), 481–486. 10.1016/j.marpolbul.2017.08.009. [DOI] [PubMed] [Google Scholar]
- Zhao Z.; Tang J.; Mi L.; Tian C.; Zhong G.; Zhang G.; Wang S.; Li Q.; Ebinghaus R.; Xie Z.; Sun H. Perfluoroalkyl and Polyfluoroalkyl Substances in the Lower Atmosphere and Surface Waters of the Chinese Bohai Sea, Yellow Sea, and Yangtze River Estuary. Sci. Total Environ. 2017, 599–600, 114–123. 10.1016/j.scitotenv.2017.04.147. [DOI] [PubMed] [Google Scholar]
- Li L.; Zheng H.; Wang T.; Cai M.; Wang P. Perfluoroalkyl Acids in Surface Seawater from the North Pacific to the Arctic Ocean: Contamination, Distribution and Transportation. Environ. Pollut. 2018, 238, 168–176. 10.1016/j.envpol.2018.03.018. [DOI] [PubMed] [Google Scholar]
- Brusseau M. L. The Influence of Molecular Structure on the Adsorption of PFAS to Fluid-Fluid Interfaces: Using QSPR to Predict Interfacial Adsorption Coefficients. Water Res. 2019, 152, 148–158. 10.1016/j.watres.2018.12.057. [DOI] [PMC free article] [PubMed] [Google Scholar]
- Salter M. E.; Nilsson E. D.; Butcher A.; Bilde M. On the Seawater Temperature Dependence of the Sea Spray Aerosol Generated by a Continuous Plunging Jet. J. Geophys. Res. Atmospheres 2014, 119 (14), 9052–9072. 10.1002/2013JD021376. [DOI] [Google Scholar]
- Järvinen A.; Aitomaa M.; Rostedt A.; Keskinen J.; Yli-Ojanperä J. Calibration of the New Electrical Low Pressure Impactor (ELPI+). J. Aerosol Sci. 2014, 69, 150–159. 10.1016/j.jaerosci.2013.12.006. [DOI] [Google Scholar]
- Harvey G. W. Microlayer Collection from the Sea Surface: A New Method and Initial Results1. Limnol. Oceanogr. 1966, 11 (4), 608–613. 10.4319/lo.1966.11.4.0608. [DOI] [Google Scholar]
- Löfstedt Gilljam J.; Leonel J.; Cousins I. T.; Benskin J. P. Is Ongoing Sulfluramid Use in South America a Significant Source of Perfluorooctanesulfonate (PFOS)? Production Inventories, Environmental Fate, and Local Occurrence. Environ. Sci. Technol. 2016, 50 (2), 653–659. 10.1021/acs.est.5b04544. [DOI] [PubMed] [Google Scholar]
- Benskin J. P.; Ikonomou M. G.; Woudneh M. B.; Cosgrove J. R. Rapid Characterization of Perfluoralkyl Carboxylate, Sulfonate, and Sulfonamide Isomers by High-Performance Liquid Chromatography–Tandem Mass Spectrometry. J. Chromatogr. A 2012, 1247, 165–170. 10.1016/j.chroma.2012.05.077. [DOI] [PubMed] [Google Scholar]
- Lunkenheimer K.; Prescher D.; Hirte R.; Geggel K. Adsorption Properties of Surface Chemically Pure Sodium Perfluoro-n-Alkanoates at the Air/Water Interface: Counterion Effects within Homologous Series of 1:1 Ionic Surfactants. Langmuir 2015, 31 (3), 970–981. 10.1021/la503450k. [DOI] [PubMed] [Google Scholar]
- Fainerman V. B.; Lucassen-Reynders E. H. Adsorption of Single and Mixed Ionic Surfactants at Fluid Interfaces. Adv. Colloid Interface Sci. 2002, 96 (1), 295–323. 10.1016/S0001-8686(01)00086-0. [DOI] [PubMed] [Google Scholar]
- Higgins C. P.; Luthy R. G. Modeling Sorption of Anionic Surfactants onto Sediment Materials: An a Priori Approach for Perfluoroalkyl Surfactants and Linear Alkylbenzene Sulfonates. Environ. Sci. Technol. 2007, 41 (9), 3254–3261. 10.1021/es062449j. [DOI] [PubMed] [Google Scholar]
- Kumpulainen A. J.; Persson C. M.; Eriksson J. C. Headgroup and Hydrocarbon Tail Effects on the Surface Tension of Sugar-Based Surfactant Solutions. Langmuir 2004, 20 (25), 10935–10942. 10.1021/la048815z. [DOI] [PubMed] [Google Scholar]
- Tseng R.-S.; Viechnicki J. T.; Skop R. A.; Brown J. W. Sea-to-Air Transfer of Surface-Active Organic Compounds by Bursting Bubbles. J. Geophys. Res. 1992, 97 (C4), 5201–5206. 10.1029/91JC00954. [DOI] [Google Scholar]
- Modini R. L.; Russell L. M.; Deane G. B.; Stokes M. D. Effect of Soluble Surfactant on Bubble Persistence and Bubble-Produced Aerosol Particles. J. Geophys. Res. Atmospheres 2013, 118 (3), 1388–1400. 10.1002/jgrd.50186. [DOI] [Google Scholar]
- Lhuissier H.; Villermaux E. Bursting Bubble Aerosols. J. Fluid Mech. 2012, 696, 5–44. 10.1017/jfm.2011.418. [DOI] [Google Scholar]
- Brusseau M. L.; Van Glubt S. The Influence of Surfactant and Solution Composition on PFAS Adsorption at Fluid-Fluid Interfaces. Water Res. 2019, 161, 17–26. 10.1016/j.watres.2019.05.095. [DOI] [PMC free article] [PubMed] [Google Scholar]
- Ghosh N.; Roy S.; Mondal J. A. On the Behavior of Perfluorinated Persistent Organic Pollutants (POPs) at Environmentally Relevant Aqueous Interfaces: An Interplay of Hydrophobicity and Hydrogen Bonding. Langmuir 2020, 36 (14), 3720–3729. 10.1021/acs.langmuir.0c00189. [DOI] [PubMed] [Google Scholar]
- Christiansen S.; Salter M. E.; Gorokhova E.; Nguyen Q. T.; Bilde M. Sea Spray Aerosol Formation: Laboratory Results on the Role of Air Entrainment, Water Temperature, and Phytoplankton Biomass. Environ. Sci. Technol. 2019, 53 (22), 13107–13116. 10.1021/acs.est.9b04078. [DOI] [PubMed] [Google Scholar]
- Fuentes E.; Coe H.; Green D.; Leeuw G. de; McFiggans G. Laboratory-Generated Primary Marine Aerosol via Bubble-Bursting and Atomization. Atmos. Meas. Tech. 2010, 3 (1), 141–162. 10.5194/amt-3-141-2010. [DOI] [Google Scholar]
- Hoffman E. J.; Duce R. A. Factors Influencing the Organic Carbon Content of Marine Aerosols: A Laboratory Study. J. Geophys. Res. 1976, 81 (21), 3667–3670. 10.1029/JC081i021p03667. [DOI] [Google Scholar]
Associated Data
This section collects any data citations, data availability statements, or supplementary materials included in this article.