

Abstract
Sleep disturbances, such as short sleep duration and insomnia, are core features of depression. However, it is unclear if sleep duration and insomnia have an interactive effect on depression severity or individual symptoms. Data were drawn from a community sample (N = 1007) containing responses on the Insomnia Severity Index, Patient Health Questionnaire–9 (PHQ-9), and average sleep duration. Regression analyses determined the prevalence risks (PR) of symptoms of depression based on insomnia severity and sleep duration. Depression severity was related to insomnia severity (PR 1.09, p < 0.001) and short sleep duration (PR 1.52, p < 0.001), but the interaction between the two was negative (PR 0.97, p < 0.001). Insomnia severity increased the prevalence risk of all individual depression symptoms between 8 and 15%, while sleep duration increased the prevalence risk of appetite dysregulation (PR 1.86, p < 0.001), fatigue (PR 1.51, p < 0.001), difficulty concentrating (PR 1.61, p = 0.003), feelings of failure (PR 1.58, p = 0.002), and suicidal behavior (PR 2.54, p = 0.01). The interaction of sleep duration and insomnia was negative and ranged between 3 and 6%. In clinically significant depression (PHQ >=10), only insomnia severity increased the prevalence risk of depression severity (PR 1.02, p = 0.001). Insomnia and short sleep predict prevalent depression, but their interactive effect was negative. Thus, while insomnia had a greater association with depression severity and symptoms, this association was dependent on habitual sleep duration.
Keywords: Insomni, Short sleep, Depression, Sleep duration
Introduction
Sleep disturbance is a core symptom of depression [1], and as many as 90% of depressed patients struggle with insomnia, hypersomnia, and/or short sleep duration (6 h or fewer) [2, 3]. Current research now supports sleep as a causal or predictive factor in incident depression. Meta-analyses of prospective studies show that insomnia increases the risk of incident depression twofold [4, 5]. Similarly, a meta-analysis of sleep duration found that short sleep increased the incidence risk of depression by 31% [6]. In short, both insomnia and short sleep are risk factors for depression.
What remains unclear is how these factors compare or interact with each other. Prospective studies support a connection among insomnia, short sleep, and depression in adults [7–10]. However, none of these studies used clinically validated assessments for insomnia. Moreover, subjects were often grouped by the presence or absence of insomnia symptoms and sleep duration status, thus precluding analyses of interactive effects. This is important, because many individuals with insomnia have short sleep duration and understanding whether there is an interaction would be relevant for this sizeable group.
There is also reason to believe that sleep may have a differential effect on various depression symptoms. A polysomnography study in major depression demonstrated that specific EEG variables, particularly delta activity, were strongly associated with a subset of depression symptoms [11]. Moreover, various forms of disturbed sleep have been associated with depression symptoms such as suicidality [12], appetite [13], and anhedonia [14, 15]. However, the associations among insomnia, sleep duration, and specific depression symptoms have not been systematically evaluated.
Therefore, the present study had two goals. The first was to determine the main and interactive effects of insomnia and sleep duration on overall depression severity. The second was to determine the main and interactive effects of insomnia and sleep duration on individual depression symptoms. Data were drawn from validated questionnaires of depression, insomnia, and sleep duration collected in a community sample. Additional analyses split the sample into individuals with clinically significant and non-significant depression severity to determine if the associations between sleep duration, insomnia, and depression were unduly influenced by individuals with severe depression. Based on previous evidence [7–10], the primary hypothesis was that insomnia and short sleep would have a positive interactive effect on overall depression and individual symptoms.
Materials and methods
Participants
Data were acquired from the Sleep and Healthy Activity, Diet, Environment, and Socialization (SHADES) study, an internet-based questionnaire study of 1007 adults aged 22–60 in the Philadelphia area. Subjects were recruited through advertisements and community centers without regard to medical or psychiatric comorbidity. Subjects were required to complete all elements of the questionnaire to receive compensation, and only completed data were collected for analysis. The Institutional Review Board at the University of Pennsylvania approved this study, and informed consent was obtained from each subject through electronic signatures.
Measures
Depression symptoms and severity were measured with the Patient Health Questionnaire-9 (PHQ-9) [16]. The questionnaire assesses the frequency of symptoms in the last 2 weeks, including anhedonia, depressed mood, sleep disturbance, fatigue, appetite dysregulation, feelings of failure, difficulty concentrating, psychomotor symptoms, and suicidal ideation. Each item is rated as “Not at all,” “Several days,” “More than half the days,” and “Nearly every day.” The total score on the PHQ-9 ranges from 0 to 27, with higher scores reflecting increased depression severity.
Sleep duration was measured using a question from the National Health and Nutrition Examination Survey, which has been used in previous studies [17, 18]. Respondents were asked “How much sleep do you usually get at night on weekdays or workdays?” and were required to provide a whole number estimate of sleep duration. Sleep duration was categorized as “Short” (fewer than 7 h), “Recommended” (7–8 h), or “Long” (9 h or more). These categories were based on existing guidelines [19, 20] and previous studies [17, 21] which demonstrate that the prevalence and health impact of sleep duration is nonlinear. Insomnia severity was assessed with the Insomnia Severity Index (ISI) [22], a validated clinical measure that asks about symptoms of insomnia in the last 2 weeks. Higher scores on the ISI are associated with increasing insomnia severity.
Statistical analyses
All analyses were performed with R (v. 3.5.1). Subjects were categorized by sleep duration and compared by ISI scores and PHQ-9 total score and item responses. To reduce col-linearity, the PHQ-9 sleep item (question 3) was removed from analyses and subtracted from the total PHQ-9 score, creating an adjusted total PHQ-9 score. Age, sex, education level, race/ethnicity, and BMI (calculated as kg/m2) were treated as covariates. One-way ANOVA and Chi-squared tests compared ISI scores, covariates, and PHQ-9 scores across groups.
PHQ-9 total scores and item responses were treated as counts and modeled using quasi-Poisson (QP) regression. QP is an extension of Poisson regression which relaxes the assumption that the variance of the response is equivalent to the mean response, thus allowing for overdispersion of data. Additionally, unlike logistic regression, Poisson regression calculates risk, not odds, which allows more direct interpretation of the results. In the case of cross-sectional data (as presented here), the QP model calculates prevalence risk, defined as the risk of increased PHQ-9 symptom frequency for a change in any of the model predictors. Unadjusted analyses modeled PHQ-9 total scores and item responses using sleep duration as a categorical predictor and ISI score as a linear predictor. Interaction terms were also included. Adjusted analyses included the covariates listed above. An additional subgroup analysis was conducted that splits the sample into individuals with PHQ-9 total scores greater than 10 (clinically significant depression), and those with PHQ-9 scores of 10 or less (sub-clinical depression). The goal of this analysis was twofold: to determine if associations between sleep and depression were unduly influenced by individuals with severe depression; and to explore these associations in individuals with subclinical depression (e.g., premorbid or remitted depression).
Results
Characteristics of the sample
Characteristics of the sample are reported in Table 1, either as mean ± standard deviation or column percentages. The average age was 34.0 ± 9.4 years, with 61% women, 56% college graduates, 60% non-Hispanic Whites and 25% African-Americans. The mean BMI was 26.6 ± 7.9. A total of 26.61% of subjects reported moderate or severe insomnia, and 38.7% of subjects reported clinically significant depression symptoms. Average sleep duration was 6.46 ± 1.57 h. There were 477 (47.4%) subjects with Short Sleep, 480 (47.7%) with Recommended Sleep, and 50 (5.0%) with Long Sleep. All covariates differed significantly across sleep duration except for sex.
Table 1.
Demographic characteristics and ISI/PHQ-9 score distributions of the sample
| Variable | Total | Stratified by sleep duration | |||
|---|---|---|---|---|---|
| Short sleep | Recommended sleep | Long sleep | p-value | ||
| N | 1007 | 477 | 480 | 50 | – |
| Age (years) | 34 ± 9.4 | 35.6 ± 9.5 | 32.8 ± 9.3 | 30.2 ± 6.5 | < 0.0001 |
| BMI (kg/m2) | 26.6 ± 7.9 | 27.9 ± 9.2 | 25.3 ± 5.6 | 27.4 ± 10 | < 0.0001 |
| Sex | |||||
| Female | 61.47% | 57.86% | 64.79% | 64.00% | 0.0824 |
| Male | 38.53% | 42.14% | 35.21% | 36.00% | – |
| Education | |||||
| College | 55.91% | 42.98% | 67.29% | 70.00% | < 0.0001 |
| Some college | 30.98% | 37.95% | 24.58% | 26.00% | – |
| High school | 10.53% | 15.30% | 6.46% | 4.00% | – |
| Less than high school | 2.58% | 3.77% | 1.67% | 0.00% | – |
| Race | |||||
| White | 59.29% | 50.73% | 67.50% | 62.00% | <0.0001 |
| African-American | 24.93% | 33.96% | 17.29% | 12.00% | – |
| Asian | 5.46% | 4.82% | 6.67% | 0.00% | – |
| Hispanic | 4.57% | 4.82% | 3.54% | 12.00% | – |
| Native | 0.30% | 0.42% | 0.21% | 0.00% | – |
| Other | 5.06% | 5.03% | 4.17% | 14.00% | – |
| ISI scorea | |||||
| No insomnia | 34.76% | 16.35% | 52.50% | 40.00% | < 0.0001 |
| Subthreshold insomnia | 38.63% | 41.72% | 35.62% | 38.00% | – |
| Moderate insomnia | 21.05% | 30.61% | 11.46% | 22.00% | – |
| Severe insomnia | 5.56% | 11.32% | 0.42% | 0.00% | – |
| PHQ-9 scoreb | |||||
| Minimal depression (0–4) | 30.60% | 19.70% | 41.90% | 26.00% | < 0.0001 |
| Mild depression (5–9) | 30.70% | 28.90% | 32.10% | 34.00% | – |
| Moderate depression (10–14) | 20.80% | 25.80% | 16.20% | 16.00% | – |
| Moderately severe depression (15–19) | 10.70% | 15.50% | 5.80% | 12.00% | – |
| Severe depression (20–27) | 7.20% | 10.10% | 4.00% | 12.00% | – |
Insomnia Severity Index scores range from 0 to 28 and measure the severity of insomnia symptoms. The categories presented here represent validated cut-points provided by the measure
PHQ-9 scores range from 0 to 27 and measure the severity of depression symptoms. The categories presented here represent validated cut-points provided by the measure
Sleep duration, insomnia severity, and depression in the whole sample
Overall depression severity was significantly associated with short sleep duration, insomnia severity, and the interaction between insomnia and short sleep. Short sleep duration increased the prevalence risk of a worsened PHQ-9 score by 56% (PR 1.56, p < 0.001), while each point increase in ISI score increased the adjusted total PHQ-9 score by 10% (PR 1.10, p < 0.001). However, the interaction between ISI score and short sleep was negative (PR 0.97, p < 0.001). Insomnia severity and short sleep duration remained significant predictors even after adjusting for demographic covariates (ISI p < 0.001; Short Sleep p < 0.001; Interaction p < 0.001). Taken together, both insomnia and short sleep duration are positively associated with depression, but the presence of short sleep accounts for part of the relationship between insomnia and depression.
Subsequent analyses explored how insomnia and sleep duration predicted the frequency of individual depression symptoms. In unadjusted analyses, each additional point on the ISI increased the prevalence risk of all symptoms between 8 and 16% (all p < 0.001). Short sleep was associated with an increased risk of depressed mood (PR 1.32, p = 0.043), appetite dysregulation (PR 1.86, p < 0.001), fatigue (PR 1.51, p < 0.001), difficulty concentrating (PR 1.61, p = 0.003), feelings of failure (PR 1.58, p = 0.002), psychomotor disturbance (PR 1.74, p = 0.029), and suicidal ideation (PR 2.54, p = 0.007). Long sleep was significantly associated with increased risk of appetite dysregulation (PR 1.89, p = 0.029). The interaction between short sleep and insomnia severity was significant and negative for all symptoms except anhedonia, and ranged from 3 to 6%. Thus, short sleepers saw a smaller increased risk with increasing insomnia severity. In adjusted analyses, insomnia severity increased the prevalence risk of all symptoms by 8–15% (all p < 0.001). Short sleep duration was a significant predictor of appetite dysregulation (PR 1.82, p < 0.001), fatigue (PR 1.49, p < 0.001), difficulty concentrating (PR 1.58, p = 0.005), feelings of failure (PR 1.54, p < 0.004), and suicidal behavior (PR 2.38, p = 0.01). Long sleep no longer predicted any symptom frequency. Moreover, the short sleep and insomnia interaction remained significant for depressed mood (PR 0.97, p = 0.01), appetite dysregulation (PR 0.97, p < 0.001), fatigue (PR 0.97, p < 0.001), difficulty concentrating (PR 0.97, p = 0.006), feelings of failure (PR 0.97, p = 0.005), and suicidal behavior (PR 0.94, p = 0.005). These results are presented in Table 2 and in Fig. 1.
Table 2.
Prevalence risks of increased depression severity and symptom frequency in the complete sample
| Model 1: unadjusted | Model 2: adjusted for covariates | |||||||
|---|---|---|---|---|---|---|---|---|
| PR | SE | 95% CI | p-value | PR | SE | 95% CI | p-value | |
| Adjusted PHQ-9 score | ||||||||
| ISI | 1.09 | 0.01 | [1.08, 1.11] | <0.0001 | 1.09 | 0.01 | [1.08, 1.1] | <0.0001 |
| Short sleep | 1.52 | 0.16 | [1.21, 1.83] | 0.0001 | 1.48 | 0.15 | [1.18, 1.78] | 0.0002 |
| Long sleep | 1.40 | 0.31 | [0.8, 2] | 0.1247 | 1.35 | 0.30 | [0.77, 1.93] | 0.1708 |
| ISI: short sleep | 0.97 | 0.01 | [0.95, 0.98] | <0.0001 | 0.97 | 0.01 | [0.96, 0.99] | 0.0001 |
| ISI: long sleep | 0.99 | 0.02 | [0.95, 1.02] | 0.4114 | 0.99 | 0.02 | [0.95, 1.02] | 0.4774 |
| Anhedonia | ||||||||
| ISI | 1.08 | 0.01 | [1.06, 1.1] | <0.0001 | 1.08 | 0.01 | [1.06, 1.1] | <0.0001 |
| Short sleep | 1.08 | 0.17 | [0.76, 1.41] | 0.6076 | 1.07 | 0.17 | [0.74, 1.39] | 0.6766 |
| Long sleep | 1.16 | 0.37 | [0.44, 1.88] | 0.6347 | 1.15 | 0.37 | [0.43, 1.86] | 0.6710 |
| ISI: short sleep | 0.99 | 0.01 | [0.97, 1.01] | 0.2291 | 0.99 | 0.01 | [0.97, 1.01] | 0.2924 |
| ISI: long sleep | 1.01 | 0.02 | [0.96, 1.06] | 0.6572 | 1.01 | 0.02 | [0.96, 1.06] | 0.6143 |
| Depressed mood | ||||||||
| ISI | 1.09 | 0.01 | [1.07, 1.1] | <0.0001 | 1.08 | 0.01 | [1.07, 1.1] | <0.0001 |
| Short sleep | 1.32 | 0.18 | [0.96, 1.68] | 0.0430 | 1.29 | 0.18 | [0.94, 1.64] | 0.0699 |
| Long sleep | 1.32 | 0.38 | [0.57, 2.07] | 0.3342 | 1.31 | 0.38 | [0.56, 2.06] | 0.3546 |
| ISI: short sleep | 0.97 | 0.01 | [0.95, 0.99] | 0.0033 | 0.97 | 0.01 | [0.95, 0.99] | 0.0096 |
| ISI: long sleep | 0.99 | 0.02 | [0.95, 1.03] | 0.6561 | 0.99 | 0.02 | [0.95, 1.03] | 0.6471 |
| Appetite dysregulation | ||||||||
| ISI | 1.09 | 0.01 | [1.07, 1.11] | <0.0001 | 1.09 | 0.01 | [1.07, 1.1] | <0.0001 |
| Short sleep | 1.86 | 0.26 | [1.34, 2.38] | <0.0001 | 1.82 | 0.26 | [1.31, 2.33] | <0.0001 |
| Long sleep | 1.89 | 0.55 | [0.81, 2.97] | 0.0291 | 1.76 | 0.51 | [0.76, 2.76] | 0.0508 |
| ISI: short sleep | 0.96 | 0.01 | [0.94, 0.98] | 0.0004 | 0.97 | 0.01 | [0.95, 0.99] | 0.0009 |
| ISI: long sleep | 0.96 | 0.02 | [0.92, 1.01] | 0.1135 | 0.97 | 0.02 | [0.92, 1.01] | 0.1486 |
| Fatigue | ||||||||
| ISI | 1.08 | 0.01 | [1.07, 1.09] | <0.0001 | 1.08 | 0.01 | [1.07, 1.09] | <0.0001 |
| Short sleep | 1.51 | 0.14 | [1.22, 1.79] | <0.0001 | 1.49 | 0.14 | [1.21, 1.77] | <0.0001 |
| Long sleep | 1.16 | 0.25 | [0.68, 1.65] | 0.4775 | 1.13 | 0.24 | [0.66, 1.6] | 0.5616 |
| ISI: short sleep | 0.97 | 0.01 | [0.95, 0.98] | <0.0001 | 0.97 | 0.01 | [0.96, 0.99] | 0.0001 |
| ISI: long sleep | 0.99 | 0.02 | [0.96, 1.03] | 0.6999 | 0.99 | 0.02 | [0.96, 1.03] | 0.7458 |
| Difficulty concentrating | ||||||||
| ISI | 1.10 | 0.01 | [1.08, 1.12] | <0.0001 | 1.09 | 0.01 | [1.07, 1.11] | <0.0001 |
| Short sleep | 1.61 | 0.26 | [1.1, 2.12] | 0.0031 | 1.58 | 0.26 | [1.08, 2.09] | 0.0049 |
| Long sleep | 1.23 | 0.45 | [0.34, 2.12] | 0.5797 | 1.13 | 0.42 | [0.31, 1.94] | 0.7432 |
| ISI: short sleep | 0.96 | 0.01 | [0.94, 0.99] | 0.0013 | 0.97 | 0.01 | [0.95, 0.99] | 0.0064 |
| ISI: long sleep | 0.98 | 0.03 | [0.93, 1.04] | 0.5120 | 0.98 | 0.03 | [0.93, 1.04] | 0.5859 |
| Feelings of failure | ||||||||
| ISI | 1.08 | 0.01 | [1.07, 1.1] | <0.0001 | 1.08 | 0.01 | [1.06, 1.1] | <0.0001 |
| Short sleep | 1.58 | 0.23 | [1.12, 2.04] | 0.0020 | 1.54 | 0.23 | [1.09, 1.99] | 0.0040 |
| Long sleep | 1.45 | 0.44 | [0.58, 2.32] | 0.2256 | 1.43 | 0.44 | [0.57, 2.3] | 0.2404 |
| ISI: short sleep | 0.97 | 0.01 | [0.95, 0.99] | 0.0018 | 0.97 | 0.01 | [0.95, 0.99] | 0.0047 |
| ISI: long sleep | 0.99 | 0.02 | [0.94, 1.04] | 0.6448 | 0.99 | 0.02 | [0.94, 1.04] | 0.6494 |
| Psychomotor disturbance | ||||||||
| ISI | 1.13 | 0.02 | [1.1, 1.17] | <0.0001 | 1.12 | 0.02 | [1.09, 1.15] | <0.0001 |
| Short sleep | 1.74 | 0.44 | [0.87, 2.61] | 0.0298 | 1.50 | 0.38 | [0.76, 2.24] | 0.1078 |
| Long sleep | 1.65 | 0.94 | [− 0.2, 3.5] | 0.3821 | 1.46 | 0.83 | [− 0.16, 3.08] | 0.5075 |
| ISI: short sleep | 0.96 | 0.02 | [0.93, 0.99] | 0.0176 | 0.97 | 0.02 | [0.94, 1] | 0.0761 |
| ISI: long sleep | 0.96 | 0.04 | [0.88, 1.04] | 0.3819 | 0.97 | 0.04 | [0.89, 1.06] | 0.5552 |
| Suicidal behavior | ||||||||
| ISI | 1.16 | 0.02 | [1.12, 1.2] | <0.0001 | 1.15 | 0.02 | [1.11, 1.19] | <0.0001 |
| Short sleep | 2.54 | 0.87 | [0.83, 4.26] | 0.0068 | 2.38 | 0.81 | [0.79, 3.96] | 0.0112 |
| Long sleep | 2.75 | 1.78 | [− 0.74, 6.24] | 0.1193 | 2.75 | 1.80 | [− 0.77, 6.27] | 0.1213 |
| ISI: short sleep | 0.94 | 0.02 | [0.89, 0.98] | 0.0041 | 0.94 | 0.02 | [0.89, 0.98] | 0.0046 |
| ISI: long sleep | 0.96 | 0.05 | [0.87, 1.05] | 0.4221 | 0.97 | 0.05 | [0.87, 1.06] | 0.4555 |
Adjusted analyses include Age, Race/Ethnicity, Sex, BMI, and Education level as covariates. For Sleep Duration, Recommended Sleep is the reference category
Fig. 1.
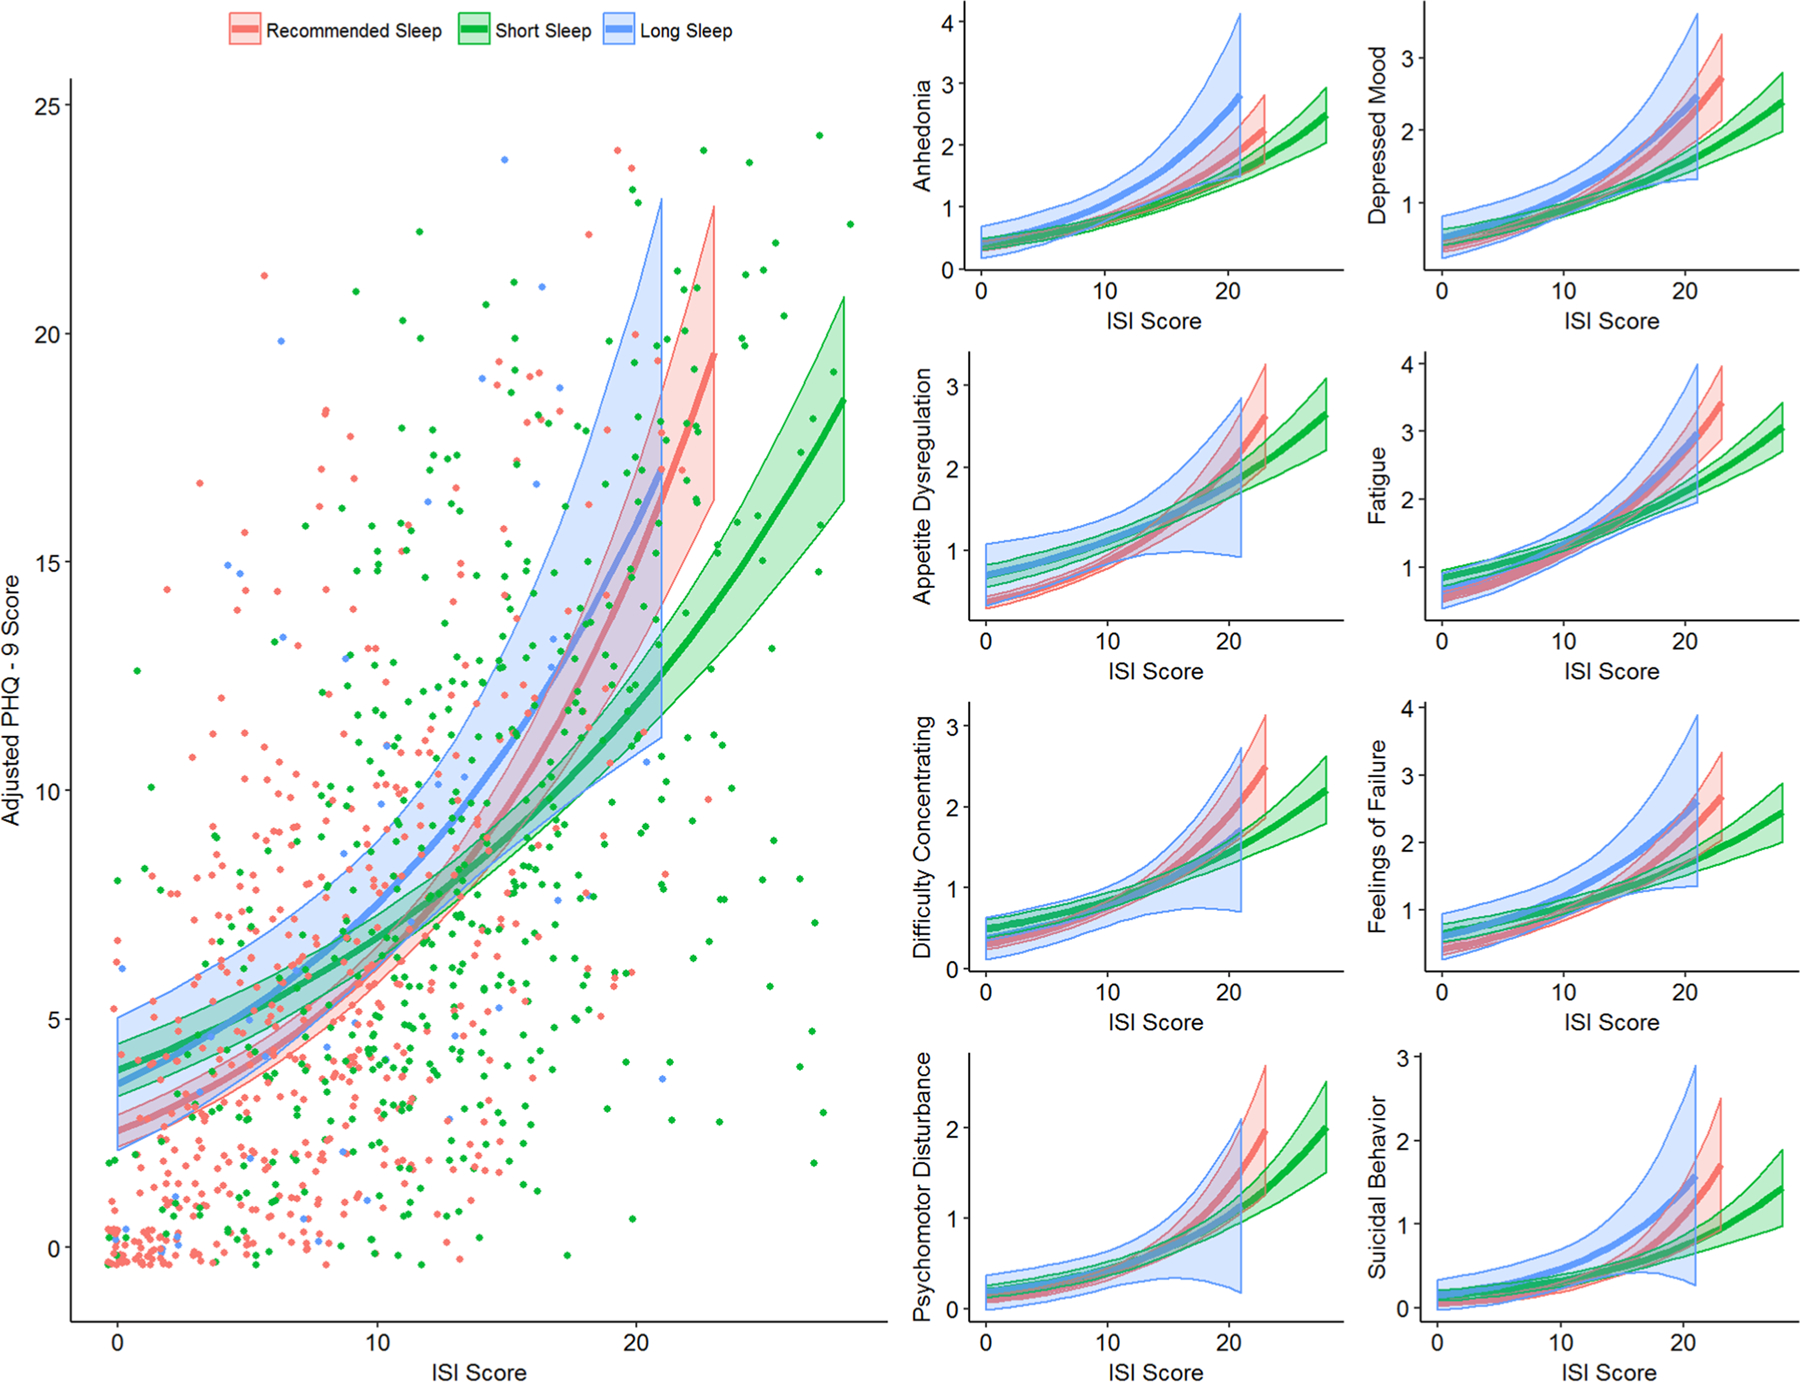
Regression models of PHQ-9 scores in the complete sample. Observed total PHQ-9 scores are shown as a scatterplot with regression models overlaid (left). Individual symptom frequencies are shown on the right. Each line represents the predicted PHQ-9 total score for a given ISI score for each group (Recommended Sleep, red; Short Sleep, green; Long Sleep, blue). Total PHQ-9 scores have the sleep item removed, thus yielding a maximum score of 24. Shaded areas represent 95% confidence intervals. Notice how short sleepers generally start at a higher total score than recommended sleepers, but that total score increases more slowly with increasing insomnia severity
Sleep duration, insomnia severity, and depression in depressed subjects
It is possible that the results described above were primarily driven by subjects with severe depression severity or symptoms, represented on the PHQ-9 as a total score of 10 or more [23, 24]. Therefore, N = 390 individuals with an unadjusted PHQ-9 total score greater than 10 were selected from the total sample. Insomnia severity was the only predictor of adjusted total PHQ-9 scores (the sleep item removed) (PR 1.02, 0.001). In assessing individual items, increasing insomnia severity increased the prevalence risk of depressed mood (PR 1.02, p = 0.024), appetite dysregulation (PR 1.02, p= 0.02) and fatigue (PR 1.02, p = 0.01). However, short sleep reduced the risk of increased anhedonia frequency (PR 0.62, p = 0.005), while the interactive effect with insomnia was significant and positive (PR 1.03, p = 0.017). Long sleep was not associated with any depression symptoms. Adjustment for covariates did not alter these effects. These results are presented in Table 3.
Table 3.
Prevalence risks of depression severity and individual symptoms in depressed subjects
| N = 390 | Model 1: unadjusted | Model 2: adjusted for covariates | ||||||
|---|---|---|---|---|---|---|---|---|
| PR | SE | 95% CI | p-value | PR | SE | 95% CI | p-value | |
| Adjusted PHQ-9 score | ||||||||
| ISI | 1.02 | 0.01 | [1.01, 1.03] | 0.0013 | 1.02 | 0.01 | [1.01, 1.03] | 0.0038 |
| Short sleep | 0.94 | 0.09 | [0.77, 1.12] | 0.5225 | 0.93 | 0.09 | [0.76, 1.1] | 0.4512 |
| Long sleep | 1.28 | 0.25 | [0.79, 1.77] | 0.2002 | 1.28 | 0.25 | [0.79, 1.78] | 0.2062 |
| ISI: short sleep | 1.00 | 0.01 | [0.99, 1.02] | 0.7119 | 1.00 | 0.01 | [0.99, 1.02] | 0.5588 |
| ISI: long sleep | 0.99 | 0.01 | [0.96, 1.02] | 0.5808 | 0.99 | 0.02 | [0.96, 1.02] | 0.5895 |
| Anhedonia | ||||||||
| ISI | 1.00 | 0.01 | [0.98, 1.02] | 0.7128 | 1.00 | 0.01 | [0.99, 1.02] | 0.6453 |
| Short sleep | 0.62 | 0.10 | [0.42, 0.83] | 0.0046 | 0.64 | 0.11 | [0.43, 0.85] | 0.0090 |
| Long sleep | 1.03 | 0.34 | [0.36, 1.7] | 0.9209 | 1.06 | 0.36 | [0.36, 1.76] | 0.8680 |
| ISI: short sleep | 1.03 | 0.01 | [1, 1.05] | 0.0169 | 1.03 | 0.01 | [1, 1.05] | 0.0269 |
| ISI: long sleep | 1.02 | 0.03 | [0.97, 1.07] | 0.4791 | 1.02 | 0.03 | [0.97, 1.07] | 0.5023 |
| Depressed mood | PR | SE | 95% CI | p-value | PR | SE | 95% CI | p-value |
| ISI | 1.02 | 0.01 | [1, 1.04] | 0.0243 | 1.02 | 0.01 | [1, 1.04] | 0.0244 |
| Short sleep | 0.84 | 0.13 | [0.57, 1.1] | 0.2707 | 0.83 | 0.14 | [0.56, 1.1] | 0.2669 |
| Long sleep | 1.50 | 0.48 | [0.56, 2.44] | 0.2049 | 1.60 | 0.53 | [0.57, 2.63] | 0.1553 |
| ISI: short sleep | 1.00 | 0.01 | [0.98, 1.02] | 0.8383 | 1.00 | 0.01 | [0.98, 1.02] | 0.8038 |
| ISI: long sleep | 0.98 | 0.02 | [0.93, 1.03] | 0.3841 | 0.97 | 0.02 | [0.92, 1.02] | 0.2992 |
| Appetite dysregulation | ||||||||
| ISI | 1.02 | 0.01 | [1, 1.04] | 0.0203 | 1.02 | 0.01 | [1, 1.04] | 0.0400 |
| Short sleep | 1.18 | 0.20 | [0.78, 1.58] | 0.3388 | 1.10 | 0.19 | [0.72, 1.48] | 0.5811 |
| Long sleep | 1.96 | 0.68 | [0.63, 3.3] | 0.0529 | 1.85 | 0.65 | [0.59, 3.12] | 0.0773 |
| ISI: short sleep | 0.99 | 0.01 | [0.97, 1.02] | 0.5825 | 1.00 | 0.01 | [0.97, 1.02] | 0.7921 |
| ISI: long sleep | 0.96 | 0.03 | [0.9, 1.01] | 0.1111 | 0.96 | 0.03 | [0.9, 1.01] | 0.1121 |
| Fatigue | ||||||||
| ISI | 1.02 | 0.01 | [1, 1.03] | 0.0103 | 1.02 | 0.01 | [1.01, 1.03] | 0.0051 |
| Short sleep | 1.01 | 0.12 | [0.78, 1.25] | 0.9056 | 0.99 | 0.12 | [0.75, 1.22] | 0.9105 |
| Long sleep | 0.99 | 0.26 | [0.49, 1.5] | 0.9765 | 1.00 | 0.26 | [0.49, 1.5] | 0.9846 |
| ISI: short sleep | 1.00 | 0.01 | [0.98, 1.02] | 0.9608 | 1.00 | 0.01 | [0.99, 1.02] | 0.7834 |
| ISI: long sleep | 1.01 | 0.02 | [0.97, 1.05] | 0.6328 | 1.01 | 0.02 | [0.97, 1.04] | 0.7520 |
| Difficulty concentrating | ||||||||
| ISI | 1.01 | 0.01 | [0.99, 1.03] | 0.3482 | 1.01 | 0.01 | [0.99, 1.03] | 0.3993 |
| Short sleep | 0.93 | 0.18 | [0.58, 1.27] | 0.6917 | 0.88 | 0.17 | [0.55, 1.21] | 0.5035 |
| Long sleep | 1.20 | 0.50 | [0.23, 2.18] | 0.6522 | 1.07 | 0.44 | [0.21, 1.93] | 0.8656 |
| ISI: short sleep | 1.00 | 0.01 | [0.98, 1.03] | 0.7108 | 1.01 | 0.01 | [0.98, 1.04] | 0.4747 |
| ISI: long sleep | 0.98 | 0.03 | [0.92, 1.05] | 0.6023 | 0.99 | 0.03 | [0.93, 1.05] | 0.7312 |
| Feelings of failure | ||||||||
| ISI | 1.01 | 0.01 | [0.99, 1.03] | 0.2936 | 1.01 | 0.01 | [0.99, 1.03] | 0.3495 |
| Short sleep | 1.03 | 0.16 | [0.72, 1.33] | 0.8588 | 1.03 | 0.16 | [0.72, 1.34] | 0.8502 |
| Long sleep | 1.30 | 0.40 | [0.52, 2.09] | 0.3896 | 1.35 | 0.42 | [0.52, 2.18] | 0.3440 |
| ISI: short sleep | 1.00 | 0.01 | [0.98, 1.02] | 0.7051 | 1.00 | 0.01 | [0.97, 1.02] | 0.6764 |
| ISI: long sleep | 0.99 | 0.02 | [0.95, 1.04] | 0.7957 | 0.99 | 0.02 | [0.94, 1.04] | 0.6930 |
| Psychomotor disturbance | ||||||||
| ISI | 1.03 | 0.02 | [1, 1.07] | 0.0694 | 1.02 | 0.02 | [0.99, 1.06] | 0.2448 |
| Short sleep | 0.96 | 0.30 | [0.36, 1.55] | 0.8909 | 0.92 | 0.29 | [0.35, 1.5] | 0.8016 |
| Long sleep | 1.49 | 1.02 | [− 0.52, 3.49] | 0.5650 | 1.38 | 0.95 | [− 0.47, 3.23] | 0.6377 |
| ISI: short sleep | 1.00 | 0.02 | [0.96, 1.05] | 0.8663 | 1.01 | 0.02 | [0.97, 1.05] | 0.6121 |
| ISI: long sleep | 0.97 | 0.05 | [0.87, 1.07] | 0.5359 | 0.98 | 0.05 | [0.88, 1.08] | 0.7396 |
| Suicidal behavior | ||||||||
| ISI | 1.05 | 0.02 | [1, 1.09] | 0.0540 | 1.04 | 0.02 | [0.99, 1.08] | 0.1286 |
| Short sleep | 1.22 | 0.49 | [0.25, 2.19] | 0.6262 | 1.36 | 0.55 | [0.28, 2.45] | 0.4428 |
| Long sleep | 1.08 | 0.89 | [− 0.66, 2.82] | 0.9266 | 1.28 | 1.08 | [− 0.83, 3.4] | 0.7656 |
| ISI: short sleep | 0.98 | 0.03 | [0.93, 1.04] | 0.5538 | 0.98 | 0.03 | [0.93, 1.03] | 0.4527 |
| ISI: long sleep | 1.02 | 0.06 | [0.91, 1.14] | 0.6807 | 1.02 | 0.06 | [0.9, 1.15] | 0.6866 |
Adjusted analyses include Age, Race/Ethnicity, Sex, BMI, and Education level as covariates. For Sleep Duration, Recommended Sleep is the reference category
Sleep duration, insomnia severity, and depression in non‑depressed subjects
Given the limited associations between insomnia, short sleep, and depressive symptoms in subjects with clinical levels of depression, the next analysis investigated these relationships in individuals who did not report significant depression (unadjusted PHQ-9 total scores less than 10). Adjusted total PHQ-9 scores (with the sleep item removed) were significantly associated with insomnia severity (PR 1.07, p < 0.0001) and short sleep (PR 1.43, p = 0.003), and there was a negative interaction between the two conditions (PR 0.96, p < 0.001). Individually, increasing insomnia severity was associated with a 4–13% increased risk of all 8 symptoms, while short sleep duration was only associated with appetite dysregulation (PR 1.74, p = 0.01) and fatigue (PR 1.43, p = 0.01). The interaction of short sleep and insomnia was significant and negative for depressed mood (PR 0.96, p = 0.024), fatigue (PR 0.96, p = 0.001), and difficulty concentrating (PR 0.94, p = 0.011). Long sleep was not associated with any symptom. Adjustment for covariates did not significantly attenuate these effects. These results are presented in Table 4.
Table 4.
Prevalence risks of depression severity and individual symptoms in non-depressed subjects
| N = 617 | Model 1: unadjusted | Model 2: adjusted for covariates | ||||||
|---|---|---|---|---|---|---|---|---|
| PR | SE | 95% CI | p-value | PR | SE | 95% CI | p-value | |
| Adjusted PHQ-9 total score | ||||||||
| ISI | 1.07 | 0.01 | [1.05, 1.09] | < 0.0001 | 1.07 | 0.01 | [1.05, 1.09] | < 0.0001 |
| Short sleep | 1.43 | 0.17 | [1.09, 1.77] | 0.0034 | 1.47 | 0.18 | [1.11, 1.84] | 0.0020 |
| Long sleep | 0.86 | 0.23 | [0.42, 1.31] | 0.5721 | 0.83 | 0.22 | [0.4, 1.26] | 0.4827 |
| ISI: short sleep | 0.96 | 0.01 | [0.94, 0.98] | 0.0006 | 0.96 | 0.01 | [0.94, 0.99] | 0.0020 |
| ISI: long sleep | 1 | 0.02 | [0.96, 1.05] | 0.8424 | 1.01 | 0.02 | [0.96, 1.05] | 0.7691 |
| Anhedonia | ||||||||
| ISI | 1.05 | 0.02 | [1.02, 1.08] | 0.0016 | 1.06 | 0.02 | [1.02, 1.09] | 0.0010 |
| Short sleep | 1.19 | 0.3 | [0.61, 1.77] | 0.4899 | 1.23 | 0.31 | [0.61, 1.84] | 0.4262 |
| Long sleep | 0.59 | 0.31 | [− 0.02, 1.21] | 0.3248 | 0.62 | 0.33 | [− 0.03, 1.27] | 0.3754 |
| ISI: short sleep | 0.96 | 0.02 | [0.92, 1.01] | 0.0940 | 0.96 | 0.02 | [0.91, 1] | 0.0767 |
| ISI: long sleep | 1.05 | 0.05 | [0.96, 1.14] | 0.2710 | 1.05 | 0.05 | [0.96, 1.14] | 0.3118 |
| Depressed mood | ||||||||
| ISI | 1.05 | 0.01 | [1.02, 1.07] | 0.0005 | 1.05 | 0.01 | [1.02, 1.08] | 0.0003 |
| Short sleep | 1.4 | 0.28 | [0.85, 1.95] | 0.0925 | 1.48 | 0.3 | [0.89, 2.08] | 0.0542 |
| Long sleep | 0.63 | 0.28 | [0.08, 1.17] | 0.2949 | 0.61 | 0.27 | [0.08, 1.14] | 0.2631 |
| ISI: short sleep | 0.96 | 0.02 | [0.92, 0.99] | 0.0241 | 0.95 | 0.02 | [0.92, 0.99] | 0.0189 |
| ISI: long sleep | 1.04 | 0.04 | [0.96, 1.12] | 0.3405 | 1.04 | 0.04 | [0.96, 1.12] | 0.3085 |
| Appetite dysregulation | ||||||||
| ISI | 1.06 | 0.02 | [1.03, 1.09] | 0.0002 | 1.06 | 0.02 | [1.03, 1.09] | 0.0003 |
| Short sleep | 1.74 | 0.38 | [1.01, 2.48] | 0.0102 | 1.86 | 0.41 | [1.06, 2.67] | 0.0050 |
| Long sleep | 1.25 | 0.56 | [0.16, 2.34] | 0.6114 | 1.17 | 0.52 | [0.15, 2.19] | 0.7228 |
| ISI: short sleep | 0.97 | 0.02 | [0.93, 1.01] | 0.1030 | 0.97 | 0.02 | [0.93, 1.01] | 0.0941 |
| ISI: long sleep | 0.98 | 0.04 | [0.9, 1.07] | 0.6977 | 0.99 | 0.04 | [0.91, 1.08] | 0.8616 |
| Fatigue | ||||||||
| ISI | 1.09 | 0.01 | [1.07, 1.1] | < 0.0001 | 1.08 | 0.01 | [1.06, 1.1] | < 0.0001 |
| Short sleep | 1.43 | 0.2 | [1.05, 1.82] | 0.0093 | 1.43 | 0.2 | [1.03, 1.82] | 0.0117 |
| Long sleep | 1.01 | 0.3 | [0.43, 1.59] | 0.9730 | 0.96 | 0.28 | [0.41, 1.52] | 0.9011 |
| ISI: short sleep | 0.96 | 0.01 | [0.94, 0.98] | 0.0010 | 0.97 | 0.01 | [0.95, 0.99] | 0.0152 |
| ISI: long sleep | 0.98 | 0.03 | [0.93, 1.04] | 0.5455 | 0.99 | 0.03 | [0.94, 1.04] | 0.7261 |
| Difficulty concentrating | ||||||||
| ISI | 1.08 | 0.02 | [1.05, 1.12] | < 0.0001 | 1.08 | 0.02 | [1.05, 1.12] | < 0.0001 |
| Short sleep | 1.65 | 0.42 | [0.82, 2.48] | 0.0524 | 1.68 | 0.45 | [0.8, 2.56] | 0.0512 |
| Long sleep | 0.64 | 0.41 | [− 0.17, 1.45] | 0.4888 | 0.57 | 0.38 | [− 0.17, 1.31] | 0.3951 |
| ISI: short sleep | 0.94 | 0.02 | [0.9, 0.99] | 0.0113 | 0.95 | 0.02 | [0.91, 1] | 0.0430 |
| ISI: long sleep | 1 | 0.05 | [0.9, 1.11] | 0.9556 | 1.01 | 0.06 | [0.9, 1.11] | 0.9275 |
| Feelings of failure | ||||||||
| ISI | 1.04 | 0.02 | [1.01, 1.07] | 0.0165 | 1.04 | 0.02 | [1.01, 1.08] | 0.0114 |
| Short sleep | 1.28 | 0.3 | [0.69, 1.86] | 0.2920 | 1.34 | 0.32 | [0.7, 1.98] | 0.2273 |
| Long sleep | 0.8 | 0.4 | [0.02, 1.58] | 0.6557 | 0.79 | 0.4 | [0.01, 1.58] | 0.6470 |
| ISI: short sleep | 0.98 | 0.02 | [0.94, 1.02] | 0.3594 | 0.98 | 0.02 | [0.94, 1.03] | 0.3994 |
| ISI: long sleep | 1.02 | 0.05 | [0.93, 1.11] | 0.6447 | 1.02 | 0.05 | [0.93, 1.11] | 0.6226 |
| Psychomotor disturbance | ||||||||
| ISI | 1.13 | 0.03 | [1.07, 1.19] | <0.0001 | 1.13 | 0.03 | [1.07, 1.19] | <0.0001 |
| Short sleep | 1.33 | 0.57 | [0.21, 2.46] | 0.5020 | 1.22 | 0.55 | [0.15, 2.3] | 0.6520 |
| Long sleep | 0.62 | 0.68 | [− 0.71, 1.96] | 0.6644 | 0.53 | 0.61 | [− 0.67, 1.72] | 0.5805 |
| ISI: short sleep | 0.96 | 0.03 | [0.89, 1.02] | 0.1887 | 0.96 | 0.04 | [0.89, 1.03] | 0.2581 |
| ISI: long sleep | 1.01 | 0.08 | [0.84, 1.17] | 0.9414 | 1 | 0.09 | [0.83, 1.18] | 0.9578 |
| Suicidal behavior | ||||||||
| ISI | 1.13 | 0.05 | [1.03, 1.23] | 0.0060 | 1.13 | 0.05 | [1.03, 1.23] | 0.0090 |
| Short sleep | 2.11 | 1.49 | [− 0.8, 5.03] | 0.2884 | 2.78 | 2.02 | [− 1.19, 6.74] | 0.1612 |
| Long sleep | 3.81 | 4.29 | [− 4.6, 12.23] | 0.2352 | 4.13 | 4.57 | [− 4.83, 13.1] | 0.2001 |
| ISI: short sleep | 0.93 | 0.06 | [0.82, 1.04] | 0.2376 | 0.91 | 0.06 | [0.79, 1.03] | 0.1502 |
| ISI: long sleep | 0.9 | 0.1 | [0.7, 1.1] | 0.3489 | 0.89 | 0.1 | [0.69, 1.08] | 0.2709 |
Adjusted analyses include Age, Race/Ethnicity, Sex, BMI, and Education level as covariates. For Sleep Duration, Recommended Sleep is the reference category
Discussion
In this study, short sleep and insomnia were independently associated with increased depression severity and frequency of individual symptoms. However, the interaction between short sleep and insomnia severity was negative. Compared to those sleeping 7–8 h, short sleepers had a higher depression risk at low insomnia severity and their risk increased at a slower rate with increasing insomnia severity. This suggests that the association between depression and insomnia is dependent on sleep duration.
The first analysis explored how insomnia severity and sleep duration were associated with overall depression severity in this sample. Even after adjusting for covariates, both short sleep and insomnia severity were associated with increased depression, thus reaffirming the individual roles of sleep duration and insomnia on the presence of depression. Short sleep conferred a 52% increased risk of depression, which is higher than the 31% risk reported in a 2015 meta-analysis [6]. Part of this may be because the sample over-represented depressed individuals, who are known to subjectively under-report sleep duration compared to objective measures [25]. Thus, short sleepers may represent depressed individuals who sleep the recommended amount but underestimate their own sleep duration. With regard to insomnia, each additional point on the ISI was robustly associated with a 9% risk of worsened depression. In other words, an ISI score of 15 more than doubled the risk of depression in the sample, which is well in line with previous estimates [4, 5].
Interestingly, the interaction between short sleep and insomnia severity was negative. This does not mean that the two conditions together decrease the risk of depression symptoms or severity. Rather, it means that short sleepers show a slower rise in the risk of depression symptoms than healthy sleepers as insomnia severity scores increase. This suggests that short sleep accounts for part of the effect of insomnia on depression severity, probably because insomnia often involves reduced sleep duration. It is unlikely that this finding is affected by subjective sleep duration measurement, since objective and subjective sleep duration are well correlated in insomnia [26, 27]. These findings suggest that while insomnia with short sleep may confer the highest risk of concurrent depression [7–10], the effects of these conditions are additive, not synergistic.
Analyses then explored how insomnia severity and sleep duration were associated with individual depression symptoms. Insomnia was robustly associated with each of the 8 symptoms (excluding the sleep symptom), while short sleep duration was associated with only a subset: appetite dysregulation, fatigue, difficulty concentrating, feelings of failure, and suicidal ideation. Several of these associations are well established; insufficient sleep is strongly related to metabolic activity and diet control [18, 28, 29], daytime functioning and cognitive capacity [30], and suicidal behavior [31]. It is interesting that short sleep was associated with feelings of failure, but not associated with anhedonia and only marginally associated with depressed mood, the core affective symptoms of depression [1]. Finally, the initial finding that short sleep and insomnia had a negative interactive effect was replicated for nearly every symptom, and was significant for depressed mood even when short sleep alone did not have an independent effect.
Secondary analyses explored whether the associations between depression, insomnia, and sleep duration differed between those with and without clinical depression symptoms (defined as an unadjusted PHQ-9 score of 10 or more) [23, 24]. Surprisingly, only insomnia was significantly related to adjusted total PHQ-9 score in depressed subjects, and this relationship was much weaker than in non-depressed individuals (a 2% increased prevalence risk per point on the ISI). Moreover, insomnia severity was associated with a smaller set of symptoms (depressed mood, appetite dysregulation, and fatigue) in depressed subjects. Similarly, short sleep was only positively associated with appetite dysregulation, and negatively associated with anhedonia (e.g., short sleep reduced the risk of anhedonia). Meanwhile, individuals without clinically significant depression showed a pattern of depression severity and symptom risk that matched the whole sample. Although cross-sectional data limits inferences on depression incidence, it is possible that sleep plays a greater role in premorbid depression. Ultimately, more work is needed to clarify how sleep duration and insomnia influence depression incidence, and these results suggest that both disturbances need to be treated effectively to minimize depression risk.
There are also several important caveats to these findings. First, the sample was younger (mean age 34), mostly female (61.5%), and majority college educated (56%), which limits generalizability to other populations. However, most studies on this topic focus on middle-aged adults (mean ages: 44–46 [7, 32]), such that the present findings are simply focused on a different age group. Moreover, five sociodemographic factors were included as covariates in analyses to reduce the risk of confounding. While adjusting for medical, psychiatric, or other comorbidities could have increased the robustness of these findings, this would have limited our statistical power to address the primary question, and allows these findings to remain agnostic about potential causes of sleep disturbances and/or depression.
Second, the sample displayed a high degree of clinically significant depression symptoms (38.7% with a PHQ-9 score of 10 or more), which is much higher than the estimated 13% prevalence of depression in communities across the globe [33]. However, the frequency of depression symptoms in this study is comparable to the estimated 30.6% prevalence of depression among university students [34], and, thus, may be driven by the age and gender characteristics of the sample. Moreover, despite the elevated depression symptoms in the whole sample, the subgroup analysis indicates that the non-depressed subjects drove the associations between sleep and PHQ-9 responses. Ultimately, elevated scores on the PHQ-9 do not constitute a formal diagnosis of major depressive disorder, and so these results only apply to self-reported depressive symptoms.
Third, this study was an internet-based cross-sectional survey, and thus the associations reported cannot be assessed for directionality. However, since the interaction between insomnia and short sleep has not been explored in depression severity or for individual symptoms, this approach provides a reasonable first evaluation. Another limitation is the self-report nature of the data. While the ISI and PHQ-9 have excellent validity in detecting insomnia and depression, respectively, this study cannot state with certainty that poor sleep is associated with depression as a disorder, but rather subjects’ perceptions of depression-related symptoms. Similarly, sleep duration was measured using retrospective self-report, not sleep diaries or actigraphy. Thus, the sleep duration estimates used in this study are subjective and may involve subject error. For example, it is possible that subjects reported their average time in bed, not total sleep time, which could complicate interpretation of these results. Nevertheless, this question is part of a national annual survey in the United States and has been used previously in published studies involving sleep duration [17, 18]. Given these limitations, future research should focus on longitudinal evaluation of depression symptoms in individuals with insomnia and short sleep duration, thus allowing causative inferences. Moreover, use of actigraphy, sleep diaries, or other prospective measures of sleep duration may improve measurement accuracy and reduce sleep-state misperceptions.
Conclusion
Depression has a 12-month US prevalence of 7% and a lifetime prevalence of 17% [1, 35]. This study explored how sleep duration and insomnia symptoms related to individual symptoms of depression. While insomnia and short sleep were independently associated with depression severity and symptoms, the interaction between these conditions was negative. This suggests that insomnia and short sleep duration overlap in their contribution to depression symptomatology, and that the effect of insomnia on depression depends on sleep duration.
Funding
This work was supported by the National Institutes of Health (R21ES022931: K23HL110216).
Footnotes
Conflict of interest On behalf of all authors, the corresponding author states that there is no conflict of interest.
Ethical approval This study was approved by the IRB at the University of Pennsylvania.
References
- 1.American Psychiatric Association. and American Psychiatric Association. DSM-5 Task Force., Diagnostic and statistical manual of mental disorders: DSM-5. 5th ed. 2013, Washington, American Psychiatric Association. xliv, p. 947 [Google Scholar]
- 2.Franzen PL, Buysse DJ. Sleep disturbances and depression: risk relationships for subsequent depression and therapeutic implications. Dialogues Clin Neurosci. 2008;10(4):473–81. [DOI] [PMC free article] [PubMed] [Google Scholar]
- 3.Alvaro PK, Roberts RM, Harris JK. A systematic review assessing bidirectionality between sleep disturbances, anxiety, and depression. Sleep. 2013;36(7):1059–68. [DOI] [PMC free article] [PubMed] [Google Scholar]
- 4.Li L, et al. Insomnia and the risk of depression: a meta-analysis of prospective cohort studies. BMC Psychiatry. 2016;16(1):375. [DOI] [PMC free article] [PubMed] [Google Scholar]
- 5.Baglioni C, et al. Insomnia as a predictor of depression: a meta-analytic evaluation of longitudinal epidemiological studies. J Affect Disord. 2011;135(1–3):10–9. [DOI] [PubMed] [Google Scholar]
- 6.Zhai L, Zhang H, Zhang D. Sleep duration and depression among adults: a meta-analysis of prospective studies. Depress Anxiety. 2015;32(9):664–70. [DOI] [PubMed] [Google Scholar]
- 7.Biddle DJ, et al. Insomnia symptoms and short sleep duration predict trajectory of mental health symptoms. Sleep Med. 2019;54:53–61. [DOI] [PubMed] [Google Scholar]
- 8.Jackowska M, Poole L. Sleep problems, short sleep and a combination of both increase the risk of depressive symptoms in older people: a 6-year follow-up investigation from the english longitudinal study of ageing. Sleep Med. 2017;37:60–5. [DOI] [PubMed] [Google Scholar]
- 9.Szklo-Coxe M, et al. Prospective associations of insomnia markers and symptoms with depression. Am J Epidemiol. 2010;171(6):709–20. [DOI] [PMC free article] [PubMed] [Google Scholar]
- 10.Fernandez-Mendoza J, et al. Insomnia and incident depression: role of objective sleep duration and natural history. J Sleep Res. 2015;24(4):390–8. [DOI] [PMC free article] [PubMed] [Google Scholar]
- 11.Perlis ML, et al. Which depressive symptoms are related to which sleep electroencephalographic variables? Biol Psychiatry. 1997;42(10):904–13. [DOI] [PubMed] [Google Scholar]
- 12.Bernert RA, et al. Sleep disturbances as an evidence-based suicide risk factor. Curr Psychiatry Rep. 2015;17(3):554. [DOI] [PMC free article] [PubMed] [Google Scholar]
- 13.Knutson KL. Impact of sleep and sleep loss on glucose homeostasis and appetite regulation. Sleep Med Clin. 2007;2(2):187–97. [DOI] [PMC free article] [PubMed] [Google Scholar]
- 14.Kalmbach DA, et al. Reciprocal dynamics between self-rated sleep and symptoms of depression and anxiety in young adult women: a 14-day diary study. Sleep Med. 2017;33:6–12. [DOI] [PubMed] [Google Scholar]
- 15.Bouwmans ME, et al. Bidirectionality between sleep symptoms and core depressive symptoms and their long-term course in major depression. Psychosom Med. 2017;79(3):336–44. [DOI] [PubMed] [Google Scholar]
- 16.Spitzer RL, Kroenke K, Williams JB. Validation and utility of a self-report version of PRIME-MD the PHQ primary care study. Primary care evaluation of mental disorders. Patient health questionnaire. JAMA. 1999;282(18):1737–44. [DOI] [PubMed] [Google Scholar]
- 17.Cepeda MS, et al. Clinical relevance of sleep duration: results from a cross-sectional analysis using NHANES. J Clin Sleep Med. 2016;12(6):813–9. [DOI] [PMC free article] [PubMed] [Google Scholar]
- 18.Grandner MA, et al. Dietary nutrients associated with short and long sleep duration. Data from a nationally representative sample. Appetite. 2013;64:71–80. [DOI] [PMC free article] [PubMed] [Google Scholar]
- 19.Watson NF, et al. Recommended amount of sleep for a healthy adult: a joint consensus statement of the American academy of sleep medicine and sleep research society. Sleep. 2015;38(6):843–4. [DOI] [PMC free article] [PubMed] [Google Scholar]
- 20.Hirshkowitz M, et al. National sleep foundation’s updated sleep duration recommendations: final report. Sleep Health. 2015;1(4):233–43. [DOI] [PubMed] [Google Scholar]
- 21.Aurora RN, et al. Habitual sleep duration and all-cause mortality in a general community sample. Sleep. 2016;39(11):1903–9. [DOI] [PMC free article] [PubMed] [Google Scholar]
- 22.Bastien CH, Vallieres A, Morin CM. Validation of the insomnia severity index as an outcome measure for insomnia research. Sleep Med. 2001;2(4):297–307. [DOI] [PubMed] [Google Scholar]
- 23.Gilbody S, et al. Screening for depression in medical settings with the patient health questionnaire (PHQ): a diagnostic meta-analysis. J Gen Intern Med. 2007;22(11):1596–602. [DOI] [PMC free article] [PubMed] [Google Scholar]
- 24.Manea L, Gilbody S, McMillan D. A diagnostic meta-analysis of the patient health questionnaire-9 (PHQ-9) algorithm scoring method as a screen for depression. Gen Hosp Psychiatry. 2015;37(1):67–75. [DOI] [PubMed] [Google Scholar]
- 25.Biddle DJ, et al. Accuracy of self-reported sleep parameters compared with actigraphy in young people with mental ill-health. Sleep Health. 2015;1(3):214–20. [DOI] [PubMed] [Google Scholar]
- 26.Lichstein KL, et al. Actigraphy validation with insomnia. Sleep. 2006;29(2):232–9. [PubMed] [Google Scholar]
- 27.Williams JM, et al. Validity of actigraphy in young adults with insomnia. Behav Sleep Med. 2018;18(1):91–106. 10.1080/15402002.2018.1545653. [DOI] [PubMed] [Google Scholar]
- 28.Dashti HS, et al. Short sleep duration and dietary intake: epidemiologic evidence, mechanisms, and health implications. Adv Nutr. 2015;6(6):648–59. [DOI] [PMC free article] [PubMed] [Google Scholar]
- 29.Shechter A, Grandner MA, St-Onge MP. The role of sleep in the control of food intake. Am J Lifestyle Med. 2014;8(6):371–4. [DOI] [PMC free article] [PubMed] [Google Scholar]
- 30.Ferrie JE, et al. Change in sleep duration and cognitive function: findings from the Whitehall II study. Sleep. 2011;34(5):565–73. [DOI] [PMC free article] [PubMed] [Google Scholar]
- 31.Perlis ML, et al. Nocturnal wakefulness as a previously unrecognized risk factor for suicide. J Clin Psychiatry. 2016;77(6):e726–33. [DOI] [PMC free article] [PubMed] [Google Scholar]
- 32.Salo P, et al. Insomnia symptoms as a predictor of incident treatment for depression: prospective cohort study of 40,791 men and women. Sleep Med. 2012;13(3):278–84. [DOI] [PubMed] [Google Scholar]
- 33.Lim GY, et al. Prevalence of depression in the community from 30 countries between 1994 and 2014. Sci Rep. 2018;8(1):2861. [DOI] [PMC free article] [PubMed] [Google Scholar]
- 34.Ibrahim AK, et al. A systematic review of studies of depression prevalence in university students. J Psychiatr Res. 2013;47(3):391–400. [DOI] [PubMed] [Google Scholar]
- 35.Murphy MJ, Peterson MJ. Sleep disturbances in depression. Sleep Med Clin. 2015;10(1):17–23. [DOI] [PMC free article] [PubMed] [Google Scholar]