

Abstract
Autism Spectrum Disorder (ASD) is a neurological disorder which might have a lifelong impact on the language learning, speech, cognitive, and social skills of an individual. Its symptoms usually show up in the developmental stages, i.e., within the first two years after birth, and it impacts around 1% of the population globally [https://www.autism-society.org/whatis/facts-and-statistics/. Accessed 25 Dec 2019]. ASD is mainly caused by genetics or by environmental factors; however, its conditions can be improved by detecting and treating it at earlier stages. In the current times, clinical standardized tests are the only methods which are being used, to diagnose ASD. This not only requires prolonged diagnostic time but also faces a steep increase in medical costs. To improve the precision and time required for diagnosis, machine learning techniques are being used to complement the conventional methods. We have applied models such as Support Vector Machines (SVM), Random Forest Classifier (RFC), Naïve Bayes (NB), Logistic Regression (LR), and KNN to our dataset and constructed predictive models based on the outcome. The main objective of our paper is to thus determine if the child is susceptible to ASD in its nascent stages, which would help streamline the diagnosis process. Based on our results, Logistic Regression gives the highest accuracy for our selected dataset.
Keywords: Autism spectrum disorder, Machine learning, Dataset, Preprocessing, Encoding, SVM, KNN, Random forest, Logistic regression, Confusion matrix, Precision, Recall, F1 score, Accuracy
Introduction
Autism Spectrum Disorder occurs in the developmental stages of an individual and is a serious disorder which can impair the ability to interact or communicate with others. Generally caused by genetics or environmental factors, it impacts the nervous system, as a result of which the overall cognitive, social, emotional, and physical health of the individual is affected [8]. There is a wide variance in the range as well as the severity of its symptoms. A few of the common symptoms the individual faces are difficulties in communication, especially in social settings, obsessive interests, and mannerisms, which take a repetitive form. To identify ASD, an extensive examination is required. This also includes an extensive evaluation and a variety of assessments by psychologists for children and various certified professionals. Conventional methods of diagnosing include Autism Diagnostic Interview Revised (ADI-R) and Autism Diagnostic Observation Schedule Revised (ADOS-R). However, these are lengthy and cumbersome, taking up a large amount of time as well as effort.
A significant portion of the pediatric population suffers from ASD. In most cases, it can usually be identified in its preliminary stages, but the major bottleneck lies in the subjective and tedious nature of existing diagnosis procedures. As a result, there is a waiting time of at least 13 months from the initial suspicion to the actual diagnosis. The diagnosis takes many hours [10], and the continuously growing demand for appointments is much greater than the peak capacity of the country’s pediatric clinics [20].
Detecting and treating Autism Spectrum Disorder in its early stages are extremely crucial as this helps to decrease or alleviate the symptoms to a certain extent, thus improving the overall quality of life for the individual. However, owing to the gaps between initial concern and diagnosis, a lot of valuable time is lost as this disorder remains undetected. Machine Learning methods would not only help to assess the risk for ASD in a quick and accurate manner, but are also essential to streamline the whole diagnosis process and help families access the much-needed therapies faster.
Some of the screening methods used to detect ASD in children are Autism Spectrum Quotient (AQ), Childhood Autism Rating Scale (CARS-2), and Screening Tool for Autism in Toddlers and Young Children (STAT). In our paper, we have used the Q-CHAT-10 [2] screening method for toddlers.
We have structured our paper as follows: “Introduction” section includes the introduction to our project. “Review of Literature” section summarizes the literature survey performed. “Working Model” and “Methodology” section explain the working and methodology of the system we have proposed and its implementation. “Analysis and Results” section portrays the inferences and results obtained. Finally, “Conclusion” section highlights our conclusions.
Review of Literature
Several studies have made use of machine learning in various ways to improve and speed up the diagnosis of ASD. Duda et al. [5] applied forward feature selection coupled with under sampling to differentiate between autism and ADHD with the help of a Social Responsiveness Scale containing 65 items. Deshpande et al. [4] used metrics based on brain activity to predict ASD. Soft computing techniques such as probabilistic reasoning, artificial neural networks (ANN), and classifier combination have also been used [15]. Many of the studies performed have talked of automated ML models which only depend on characteristics as input features. A few studies relied on data from brain neuroimaging as well. In the ABIDE database, Li et al. [14], extracted 6 personal characteristics from 851 subjects and performed the implementation of a cross-validation strategy for the training and testing of the ML models. This was used to classify between patients with and without ASD, respectively. Thabtah et al. [21] proposed a new ML technique called Rules-Machine Learning (RML) that offers users a knowledge base of rules for understanding the underlying reasons behind the classification, in addition to detecting ASD traits. Al Banna et al. [1] made use of a personalized AI-based system which assists with the monitoring and support of ASD patients, helping them cope with the COVID-19 pandemic.
In this study, we have used five ML models to classify individual subjects as having ASD or No-ASD, by making use of various features, such as age, sex, ethnicity, etc., and evaluated each classifier to determine the best performing model.
To provide a concise view of our literature survey, we have summarized the most relevant papers that we studied, by identifying the key findings and limitations of each paper and listing them down in the form of a table (Table 1).
Table 1.
Summary of literature review
| Paper | Key findings | Limitations |
|---|---|---|
| [5] |
Used forward feature selection and under sampling Trained and tested six ML models on score sheets of 65 Social Responsiveness Scale from 2925 individuals having ASD or ADHD Found that out of the 65 behaviors 5 were sufficient to distinguish ASD from ADHD with an accuracy of 96.4% |
The dataset was compiled from primarily autism-based collections, as a result of which there was quite a significant imbalance, in favor of the ASD class |
| [4] |
Metrics based on brain activity used for prediction of ASD Used SVM to obtain an accuracy of 95.9% with 2 clusters and 19 features |
Constrained sample size/data set |
| [20] |
Uses SVM Integrates ML algorithm inside ASD screening tool Accuracy 97.6% |
Imbalanced datasets Small size of dataset, with 612 autism and 11 non autism cases |
| [17] |
Derived a novel algorithm which combines the structural and functional features Chalked out various different representations of the functional connectivity of the brain Results are an indication that combining multimodal features give the highest accuracy for distinguishing cases |
The ML models used show an increase in the accuracy of the prediction by a mere 4.2% for Autism, in comparison to the previous works carried out Datasets suffer significantly from variations |
| [24] |
Makes use of SVM, Naïve Bayes and Random Forest classification methods 95,577 records of children with 367 variables out of which 256 were found to be sufficient Clearly delineates different attributes used Created dataset having 4 classes (ASD: None, Mild, Moderate, Severe) Highest accuracy of 87.1% (2 class) and 54.1% (4 class) achieved with J48 algorithm (decision tree) |
Does not predict the severity of ASD Cursory set of attributes (conditions) used for identification of ASD which might not always necessarily translate to a case of ASD |
| [23] |
Automated optimal feature selection using Binary Firefly algorithm (selected 10 out of 21 features as optimum) No class imbalance problem (Among 292 instances in ASD children dataset, there are 151 instances with class ‘yes’ and 141 instances with class ‘No’) Makes use of NB, J48, SVM, KNN models Highest accuracy of 97.95% achieved with SVM |
Missing instances in the ASD child dataset Due to lesser number of instances in the dataset, there exists a chance of model overfitting on the dataset Certain disadvantages of swarm intelligence wrappers (Binary Firefly algorithm) |
| [1] |
Makes use of an AI system with sensor data to analyze the patient’s condition using facial expressions and emotions Sends regular alerts to the parents, thus helping the patient cope with ASD during times of COVID-19 The system consists of a smart wrist band with an interactive monitor and camera, connected to a mobile application Detects ASD using real-time gray scale images from a Kaggle dataset containing 35,887 images Out of all models, the Inception-ResNetV2 architecture achieved the highest accuracy of 78.56% |
A low accuracy is achieved compared to other approaches Research work is in nascent stages |
| [21] |
Makes use of an ML model based on induction of rules called Rules-Machine Learning (RML) Generated non-redundant rules in a straightforward manner utilizing Covering learning Made use of tenfold cross-validation to partition dataset into 10 subsets RML offers classifiers with higher predictive accuracy compared to standard approaches like Boosting, Bagging and decision trees |
RML proves to be ineffective in handling imbalanced data sets with respect to class labels Article does not include instances related to toddlers |
Working Model
Figure 1 demonstrates the general working and flow of our system. We begin by preprocessing the dataset to eliminate missing values and outliers, remove noise, and encode categorical attributes. We also employ feature engineering to choose the most beneficial features out of all the features present in the data set. This reduces data dimensionality to improve speed and efficiency during training. Once the data set has been preprocessed, classification algorithms like Logistic Regression, Naïve Bayes, Support Vector Machine, K-Nearest Neighbors, and Random Forest Classifiers are used to predict the output label (ASD or no ASD). The accuracy of each classifier is observed and compared. Furthermore, metrics like the F1 score and precision-recall values have also been computed for better evaluation of each classifier. If the classifier performs well, then the training accuracy will be higher than its test accuracy. This model can then be deemed to be the best model and hence be used for further training and classification. A brief description of this approach has been discussed in “Methodology” section.
Fig. 1.

Architecture of proposed system
Methodology
Data Preprocessing
The dataset [3] that we have used has been compiled by Dr. Fadi Thabtah [6] and it contains categorical, continuous and binary attributes. Originally, the dataset had 1054 instances along with 18 attributes (including class variable). Since the dataset contained a few non-contributing and categorical attributes, we had to preprocess the data. Preprocessing refers to the transformations applied to a data set before feeding it to the model. It is done to clean raw or noisy data and make it more suited for training and analysis. We removed the non-contributing attributes, namely ‘Case_No’, ‘Who completed the test’, and ‘Qchat-10-Score’.
To deal with the categorical values, we are making use of label encoding. Label Encoding converts the labels into numeric form to make it machine-readable. Repeated labels are assigned the same value as assigned earlier. Four features having 2 classes (Sex, Jaundice, Family_mem_with_ASD, and Class/ASD_Traits) have been selected to be binary label encoded. Label Encoding proves to be ineffective when there are more than 2 classes. For multiclass features, One-Hot Encoding is used to avoid hierarchical ordering by the model. The ‘Ethnicity’ feature which has 11 classes has been one-hot encoded.
Classification Algorithms
We split the dataset into two parts—training set and test set. The training set consisting of 80% of the data (843 samples) will be used to train the classification model. The remaining 20% of the data (211 samples) will be reserved for testing the accuracy and effectiveness of the model on unseen data and will be referred to as the testing data set. This random partitioning of data into training and testing sets helps us determine if our model is overfitting or underfitting. If the model has low training error, but high testing error, then the model is overfitting the data. On the other hand, if the model has high training and testing error, the model is underfitting the data. A good model will neither overfit nor underfit the data.
After having performed data preprocessing (4.1), we applied five classification models, namely Logistic Regression, Naive Bayes, Support Vector Machine, K-Nearest Neighbors, and Random Forest Classifier, and compared the performance of each based on accuracy achieved and F1 score (Table 4). A brief description of the classification models used has been given below.
Table 4.
A comparison of the applied ML models
| LR | NB | SVM | KNN | RFC | |
|---|---|---|---|---|---|
| Accuracy | 97.15% | 94.79% | 93.84% | 90.52% | 81.52% |
| Confusion matrix | |||||
| F1 score | 0.98 | 0.96 | 0.95 | 0.93 | 0.88 |
Logistic Regression Logistic Regression (LR)
Logistic Regression’s primary aim is in finding the model with the best fit that describes the relationship between the binomial character of interest and a set of independent variables [12]. It makes use of a logistic function to find an optimal curve to fit the data points.
Naive Bayes (NB)
Based around conditional probability (Bayes theorem) and counting, the name “naïve” comes from its assumption of conditional independence of all input features [13]. If this assumption is considered true, the rate at which an NB classifier will converge will be much higher than a discriminative model like logistic regression. Therefore, the amount of training data required would be lesser. The main disadvantage of NB is that it only works well with limited number of features. Moreover, there is a high bias when there is a small amount of data.
Support Vector Machine (SVM)
Commonly used in classification problems, Support Vector Machine is based on the idea of finding the hyperplane that divides a given data set into two classes in the best possible way [18]. The distance from the hyperplane to the closest training data point is known as the margin. SVM aims to maximize the margin of the training data by finding the most optimal separating hyperplane [19]. We began our training with a linear RBF kernel and observed it to give good results as compared to a non-linear kernel.
K-Nearest Neighbors (KNN)
The KNN algorithm is based on mainly two ideas: the notion of a distance metric and that points that are close to one another are similar. Let x be the new data point that we wish to predict a label for. The KNN algorithm works by finding the k training data points closest to x using a Euclidean distance metric. KNN algorithm then performs majority voting to determine the label for the new data point x [9]. In our analysis, lower values of k (k = 1 to k = 10) gave us the highest accuracy.
Random Forest Classifier (RFC)
Random forest classifier is a flexible algorithm that can be used for classification, regression, and other tasks, as well [16]. It works by creating multiple decision trees on arbitrary data points. After getting the prediction from each tree, the best solution is selected by voting.
Analysis and Results
Dataset Analysis
The dataset used here is based on the Quantitative Checklist for Autism in Toddlers (Q-CHAT) screening method devised by Baron-Cohen et al. [2]. A shortened version, Q-CHAT-10, containing a set of 10 questions has been used (Table 2). The answers to these questions are mapped to binary values as class type. These values are assigned during the data collection process by means of answering the Q-CHAT-10 questionnaire. The class value “Yes” is assigned if the Q-CHAT-10 score happens to be greater than 3, that is, there are potential ASD traits. Otherwise, class value “No” is assigned, implying no ASD traits.
Table 2.
Features mapping with Q-CHAT-10 screening method
| Dataset variable | Description |
|---|---|
| A1 | Child responding to you calling his/her name |
| A2 | Ease of getting eye contact from child |
| A3 | Child pointing to objects he/she wants |
| A4 | Child pointing to draw your attention to his/her interests |
| A5 | If the child shows pretense |
| A6 | Ease of child to follow where you point/look |
| A7 | If the child wants to comfort someone who is upset |
| A8 | Child’s first words |
| A9 | If the child uses basic gestures |
| A10 | If the child daydreams/stares at nothing |
We plotted several graphs to get different visual perspectives of the dataset. In the first plot (Fig. 2), we can see that the number of toddlers who are ASD positive is those who do not have jaundice while birth. The count is over 2 times that of jaundice born toddlers. Thus, we can infer that jaundice born children have a weak link with ASD.
Fig. 2.
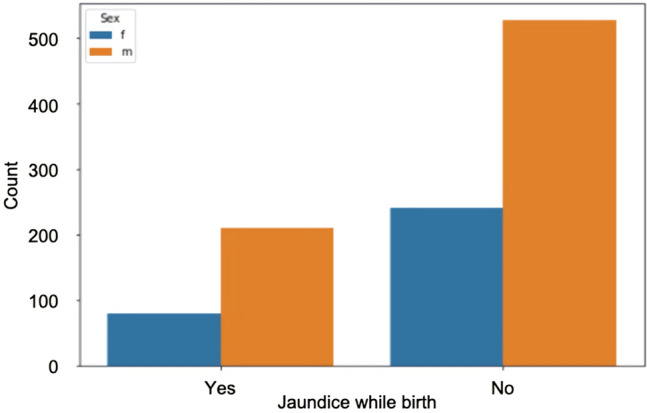
ASD positive toddlers born with jaundice based on gender
For toddlers, most of the ASD positive cases happen to be at are around 36 months of age. The least number of cases were observed between 15 and 20 months of age. From the graph, it is evident that significant signs of autism occur at the age of 3 years (Fig. 3). According to Ref. [22], one out of every 68 children aged between 2 and 3 years has autism.
Fig. 3.
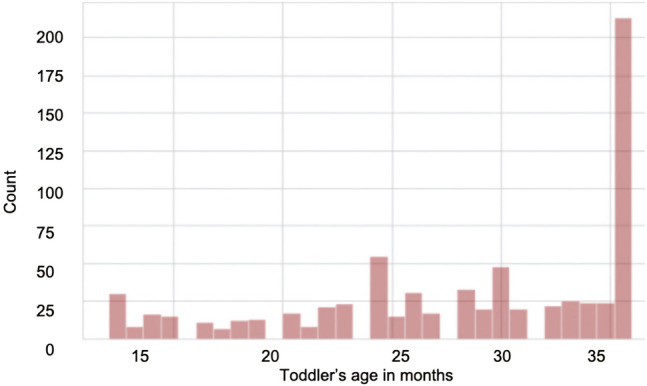
Age distribution of ASD positive
We plotted a gender distribution graph of the ASD traits observed in males and females. It can be concluded that ASD is more prevalent in males than in females as depicted in Fig. 4.
Fig. 4.

Gender distribution of ASD traits
The ethnicity distribution graph reveals that Native Indian individuals have the highest observed ASD traits (Fig. 5).
Fig. 5.

Ethnicity distribution of ASD traits
Evaluation Matrix
Usually, in most predictive models, the data points lie in the following four categories:
-
(i)
True positive (TP): The individual has ASD and we predicted correctly that the individual has ASD.
-
(ii)
True negative (TN): The individual does not have ASD and we predicted correctly that the individual does not have ASD.
-
(iii)
False positive (FP): The individual does not have ASD, but we predicted incorrectly that the individual has ASD. This is known as Type 1 error.
-
(iv)
False negative (FN): The individual has ASD, but we predicted incorrectly that the individual does not have ASD. This is known as Type 2 error.
The above four categories when put together in the form of a matrix produce the confusion matrix. The confusion matrix is particularly useful in gauging the performance of a machine learning classification model. The confusion matrix along with its parameters is shown below (Table 3).
Table 3.
Confusion matrix for ASD prediction
| Predicted | Individual has ASD | Individual does not have ASD |
|---|---|---|
| ASD is predicted | True positive | False positive |
| ASD is not predicted | False negative | True negative |
Comparison of Classification Models
We applied five machine learning models—Logistic Regression (LR), Naïve Bayes (NB), Support Vector Machine (SVM), K-Nearest Neighbors (KNN), and Random Forest Classifier (RFC). For the purpose of evaluating the performance of all these models, we have used the confusion matrix and F1 score. Table 4 shows a comparison of all the classification models we used.
From the values obtained, we can thereby infer that Logistic Regression, giving the highest accuracy, is the best model for our current dataset. Logistic regression performs well when the training data size is small and it is binary in nature. The feature space is split linearly, and it works well even when only a few variables are correlated. However, Naïve Bayes assumes that all features are conditionally independent. Hence, if some of the features are interdependent, the prediction might be inaccurate.
In addition to accuracy, we have also found out the precision and recall values to provide a better insight. Using these values, the F1 score has then been calculated by taking the weighted average (harmonic mean) of the precision and recall values. This score can vary between 0 and 1. The higher the F1 score, the better the model (a score of 1 is considered to be the best)
Precision and Recall Curves
Precision measures how accurate our positive predictions were, i.e., out of all the points predicted to be positive how many of them were actually positive
Recall measures what fraction of the positives our model identified, i.e., out of the points that are labeled positive, how many of them were correctly predicted as positive. Recall is the same as sensitivity
Accuracy can be defined as the probability of the number of correct predictions made by the classifier. In other words, it is the fraction of correct predictions made out of the total number of predictions
A precision-recall curve is generated by creating crisp class labels for probability predictions across a set of thresholds. For each threshold value, the precision and recall values are calculated. A line plot is created for the thresholds in ascending order with recall/precision on the y-axis and threshold on the x-axis. Shown below are the precision and recall curves plotted against threshold for the top three performing models—Logistic Regression (Fig. 6), Naïve Bayes (Fig. 7), and SVM (Fig. 8).
Fig. 6.
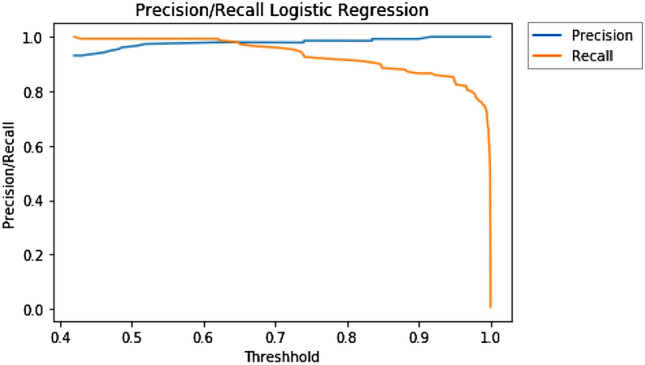
Precision/recall curve for LR
Fig. 7.
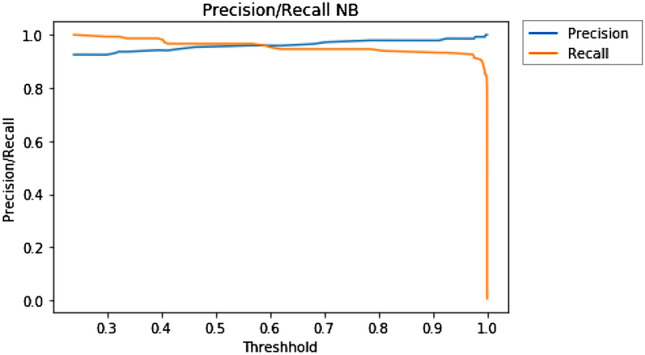
Precision/recall curve for NB
Fig. 8.
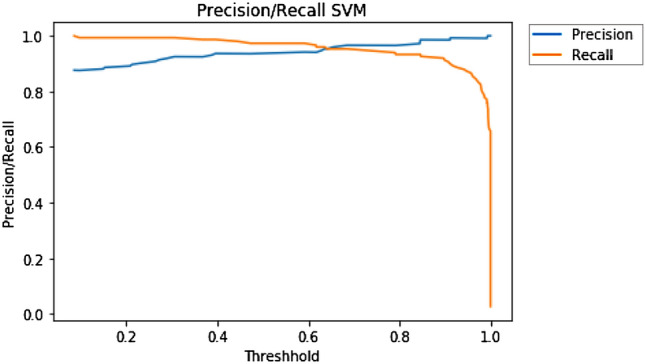
Precision/recall curves for SVM
Conclusion
The assessment of ASD behavioral traits is a time taking process that is only aggravated by overlapping symptomatology. There is currently no diagnostic test that can quickly and accurately detect ASD, or an optimized and thorough screening tool that is explicitly developed to identify the onset of ASD. We have designed an automated ASD prediction model with minimum behavior sets selected from the diagnosis datasets of each. Out of the five models that we applied to our dataset; Logistic Regression was observed to give the highest accuracy.
The primary limitation of this research is the scarce availability of large and open source ASD datasets. To build an accurate model, a large dataset is necessary. The dataset we used here did not have sufficient number of instances. However, our research has provided useful insights in the development of an automated model that can assist medical practitioners in detecting autism in children. In the future, we will be considering using a larger dataset to improve generalization. We also plan to employ deep learning techniques that integrate CNNs and classification to improve robustness and overall performance of the system. All in all, our research has resulted in analyzing various classification models that can accurately detect ASD in children with given attributes based on the child’s behavioral and medical information. The analysis of these classification models can be used by other researchers as a basis for further exploring this dataset or other Autism Spectrum Disorder data sets.
Declarations
Conflict of interest
On behalf of all authors, the corresponding author states that there is no conflict of interest.
Footnotes
This article is part of the topical collection “Advanced Computing and Data Sciences” guest edited by Mayank Singh, Vipin Tyagi, and P.K. Gupta.
Publisher's Note
Springer Nature remains neutral with regard to jurisdictional claims in published maps and institutional affiliations.
Contributor Information
Kaushik Vakadkar, Email: kaushik.vakadkar@gmail.com.
Diya Purkayastha, Email: diyap@outlook.com.
Deepa Krishnan, Email: deepa.krishnan@nmims.edu.
References
- 1.Al Banna MH, Ghosh T, Taher KA, Kaiser MS, Mahmud M. A monitoring system for patients of autism spectrum disorder using artificial intelligence. In: International conference on brain informatics. Cham: Springer; 2020. pp. 251–62.
- 2.Baron-Cohen S, Allen J, Gillberg C. Can autism be detected at 18 months? The needle, the haystack, and the CHAT. Br J Psychiatry. 1992;161:839–843. doi: 10.1192/bjp.161.6.839. [DOI] [PubMed] [Google Scholar]
- 3.Dataset: https://www.kaggle.com/fabdelja/autism-screening-for-toddlers. Accessed 1 Oct 2019.
- 4.Deshpande G, Libero LE, Sreenivasan KR, Deshpande HD, Kana RK. Identification of neural connectivity signatures of autism using machine learning. Front Hum Neurosci. 2013;7:670. doi: 10.3389/fnhum.2013.00670. [DOI] [PMC free article] [PubMed] [Google Scholar]
- 5.Duda M, Ma R, Haber N, Wall DP. Use of machine learning for behavioral distinction of autism and ADHD. Transl Psychiatry. 2016;6:e732. doi: 10.1038/tp.2015.221. [DOI] [PMC free article] [PubMed] [Google Scholar]
- 6.Thabtah F. An accessible and efficient autism screening method for behavioural data and predictive analyses. Health Informatics Journal. 2018;25(4):1739–1755. doi: 10.1177/1460458218796636. [DOI] [PubMed] [Google Scholar]
- 7.https://www.autism-society.org/what-is/facts-and-statistics/. Accessed 25 Dec 2019.
- 8.https://www.helpguide.org/articles/autism-learning-disabilities/autismspectrumdisorders.htm. Accessed 20 Dec 2019.
- 9.“KNN Classification using Scikit-learn”, https://www.datacamp.com/community/tutorials/k-nearest-neighbor-classification-scikit-learn. Accessed 8 Oct 2019.
- 10.Kosmicki JA, Sochat V, Duda M, Wall DP. Searching for a minimal set of behaviors for autism detection through feature selection-based machine learning. Transl Psychiatry. 2015 doi: 10.1038/tp.2015.7. [DOI] [PMC free article] [PubMed] [Google Scholar]
- 11.Li H, Parikh NA, He L. A novel transfer learning approach to enhance deep neural network classification of brain functional connectome. Front Neurosci. 2018 doi: 10.3389/fnins.2018.00491. [DOI] [PMC free article] [PubMed] [Google Scholar]
- 12.Logistic Regression. https://medium.com/datadriveninvestor/logistic-regression-18afd48779ce. Accessed 7 Oct 2019.
- 13.Naive Bayes for Machine Learning. https://machinelearningmastery.com/naive-bayes-for-machine-learning/. Accessed 8 Oct 2019.
- 14.Parikh MN, Li H, He L. Enhancing diagnosis of autism with optimized machine learning models and personal characteristic data. Front Comput Neurosci. 2019 doi: 10.3389/fncom.2019.00009. [DOI] [PMC free article] [PubMed] [Google Scholar]
- 15.Pratap A, Kanimozhiselvi C. Soft computing models for the predictive grading of childhood Autism—a comparative study. IJSCE. 2014;4:64–67. [Google Scholar]
- 16.Random Forests(r), Explained. https://www.kdnuggets.com/2017/10/random-forests-explained.html. Accessed 8 Oct 2019.
- 17.Sen B, Borle NC, Greiner R, Brown MR. A general prediction model for the detection of ADHD and Autism using structural and functional MRI. PLoS ONE. 2018;13:e0194856. doi: 10.1371/journal.pone.0194856. [DOI] [PMC free article] [PubMed] [Google Scholar]
- 18.Support Vector Machine—Introduction to Machine Learning Algorithms. https://towardsdatascience.com/support-vector-machine-introduction-to-machine-learning-algorithms-934a444fca47. Accessed 7 Oct 2019.
- 19.Support vector machines: The linearly separable case, https://nlp.stanford.edu/IR-book/html/htmledition/support-vector-machines-the-linearly-separable-case-1.html. Accessed 8 Oct 2019.
- 20.Thabtah F. Machine learning in autistic spectrum disorder behavioral research: A review and ways forward. Inf Health Soc Care. 2017;44:278–297. doi: 10.1080/17538157.2017.1399132. [DOI] [PubMed] [Google Scholar]
- 21.Thabtah F, Peebles D. A new machine learning model based on induction of rules for autism detection. Health Inform J. 2020;26(1):264–286. doi: 10.1177/1460458218824711. [DOI] [PubMed] [Google Scholar]
- 22.Towle P, Patrick P. Autism spectrum disorder screening instruments for very young children: A systematic review. New York: Hindawi Publishing Corporation; 2016. [DOI] [PMC free article] [PubMed] [Google Scholar]
- 23.Vaishali R, Sasikala R. A machine learning based approach to classify Autism with optimum behaviour sets. Int J Eng Technol. 2017;7:18. [Google Scholar]
- 24.van den Bekerom B. Using machine learning for detection of autism spectrum disorder. In: 26th Twente Student Conference on IT, Feb 2017.