

Abstract
Introduction
The HIV care cascade examines the attrition of people living with HIV from diagnosis to the use of antiretroviral therapy (ART) and suppression of viral replication. We reviewed the literature from sub‐Saharan Africa to assess the definitions used for the different steps in the HIV care cascade.
Methods
We searched PubMed, Embase and CINAHL for articles published from January 2004 to December 2020. Longitudinal and cross‐sectional studies were included if they reported on at least one step of the UNAIDS 90‐90‐90 cascade or two steps of an extended 7‐step cascade. A step was clearly defined if authors reported definitions for numerator and denominator, including the description of the eligible population and methods of assessment or measurement. The review protocol has been published and registered in Prospero.
Results and discussion
Overall, 3364 articles were screened, and 82 studies from 19 countries met the inclusion criteria. Most studies were from Southern (38 studies, 34 from South Africa) and East Africa (29 studies). Fifty‐eight studies (71.6%) were longitudinal, with a median follow‐up of three years. The medium number of steps covered out of 7 steps was 3 (interquartile range [IQR] 2 to 4); the median year of publication was 2015 (IQR 2013 to 2019). The number of different definitions for the numerators ranged from four definitions (for step “People living with HIV”) to 21 (step “Viral suppression”). For the denominators, it ranged from three definitions (“Diagnosed and aware of HIV status”) to 14 (“Viral suppression”). Only 12 studies assessed all three of the 90‐90‐90 steps. Most studies used longitudinal data, but denominator–denominator or denominator–numerator linkages over several steps were rare. Also, cascade data are lacking for many countries. Our review covers the academic literature but did not consider other data, such as government reports on the HIV care cascade. Also, it did not examine disengagement and reengagement in care.
Conclusions
The proportions of patients retained at each step of the HIV care cascade cannot be compared between studies, countries and time periods, nor meta‐analysed, due to the many different definitions used for numerators and denominators. There is a need for standardization of methods and definitions.
Keywords: HIV, care cascade, sub‐Saharan Africa, ART outcomes, virological suppression
1. INTRODUCTION
The Joint United Nations Programme on HIV/AIDS (UNAIDS) adopted the 90‐90‐90 targets in 2014 to track progress towards ending the HIV epidemic. Targets to be reached by 2020 include that 90% of people living with HIV (PLWH) are aware of their status, 90% of those diagnosed initiate antiretroviral therapy (ART) and 90% of those on ART achieve undetectable viral loads to end the HIV epidemic by 2030 [1]. The HIV care cascade examines the attrition of PLWH from diagnosis of the infection to starting ART and achieving suppression of viral replication. It is used to monitor HIV programme performance and to identify gaps and opportunities for specific interventions to improve retention and outcomes [2].
The number of studies examining the HIV care cascade has increased steeply, from no such study before 2011 to over 161 studies in 2020 (based on a PubMed search combining free‐text words “HIV”, “care” and “cascade”). These studies found that in sub‐Saharan Africa and elsewhere, significant gaps remain. For example in South Africa’s North West Province, awareness of HIV status among PLWH remained similar at around 70% in 2014 and 2016 and was considerably lower in men than in women [3]. Among HIV‐positive individuals presenting for initiation of ART in Dakar, Senegal, 16% were lost to follow‐up within one year [4]. However, studies differ concerning the definitions, methods and calculations used to construct the care cascade [5, 6, 7]. It is, therefore, difficult to compare published cascade research across regions and calendar periods.
Only a few studies have evaluated the methods used to define the HIV care cascade in low‐ and middle‐income countries or sub‐Saharan Africa [2, 5, 6, 7, 8]. To fill this gap, we performed a systematic review of studies published in the academic literature from sub‐Saharan Africa to assess the different methodological approaches used to define the steps in the HIV care cascade.
2. METHODS
We examined guidance on systematic reviews of observational studies [9, 10] when planning this review and report our review according to the PRISMA statement [11]. The review protocol has been published [12] and was registered in Prospero (PROSPERO registration number CRD42017055863) [13].
2.1. Search strategy and inclusion criteria
We searched PubMed, Embase and CINAHL for articles published in English from 1 January 2004 up to 3 December 2020, the date of database search. We used Medical Subject Headings (MeSH terms) and free‐text search. The MeSH terms for HIV and AIDS, and terms “cascade”, “continuum”, “linkage to care”, “retention in care” and “ART initiation” were cross‐referenced with terms for 62 African countries. The detailed search strategy has been published elsewhere [12]. Studies were included if they reported on at least one step of the 90‐90‐90 cascade or on at least two steps of the extended cascade. Pairs of reviewers (AG and FV, CM and DK) screened titles and abstracts. Two reviewers (CM, DK) independently screened the full text of potentially eligible studies using a standardized eligibility checklist. Disagreements were resolved through discussion.
2.2. Definition of steps
Figure 1 illustrates the populations involved in the cascade (bubbles) and the numerators and denominators (connectors linking populations) proposed by WHO and others for cross‐sectional and longitudinal cascades [6, 14, 15]. Seven populations (steps) are involved: (i) PLWH (diagnosed or undiagnosed); (ii) PLWH who have been diagnosed with HIV infection (the first 90); (iii) PLWH who have been diagnosed and linked to care; (iv) PLWH who have been diagnosed and who are retained in pre‐ART care; (v) PLWH who have been diagnosed and started ART; (vi) PLWH who have been diagnosed and are retained on ART (the second 90); (vii) PLWH who have been diagnosed, are retained on ART and are virologically suppressed (the third 90). A study reported on a step if it provided the number of patients in the numerator and denominator or a percentage of patients completing the step. We considered the step as clearly defined if the authors reported definitions for the numerator and denominator, such as the description of the population studied and methods of assessment or measurement.
Figure 1.
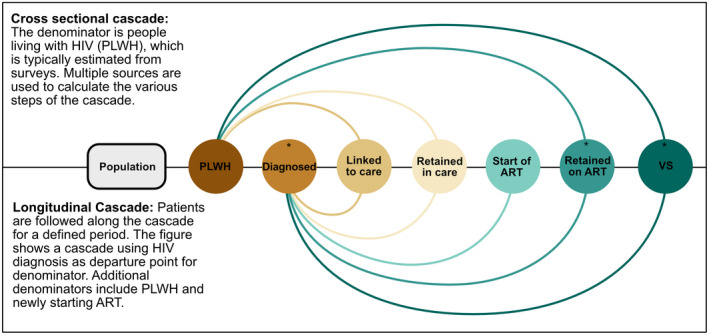
Cascade steps and denominators used for each step. The figure shows the denominators and numerators and their connection adapted from the WHO framework for cross‐sectional and longitudinal studies. *Steps of the 90‐90‐90 cascade. VS, viral suppression.
2.3. Data extraction
We developed a standardized data extraction sheet, which was piloted by four reviewers (AG, CM, DK and ME) and revised. Data extraction was performed independently in pairs by three reviewers (CM, DK, Leona Hulbert), with disagreement resolved by discussion. Data were then entered into an EpiData database [16]. We classified study design into cross‐sectional studies, longitudinal studies and studies that combine both designs (mixed design). We defined regions of sub‐Saharan Africa according to the classification used by the International epidemiological Databases to Evaluate AIDS (IeDEA) [17].
2.4. Statistical analysis
Descriptive statistical analyses were performed using STATA version 14.0 (Stata Corporation, College Station, TX, USA) [18].
3. RESULTS
3.1. Selection of eligible studies
Overall, 3810 articles were identified (Figure 2). After removal of duplicates, 3364 articles were screened by title and abstract, of which 412 were considered potentially eligible and underwent full‐text screening. Five studies reported on data from the Kenya AIDS Indicator Survey 2012 (KAIS) [19]. To avoid double‐counting of data from the KAIS, we included the publication reporting on the largest number of steps in the cascade [20]. A total of 82 studies met the inclusion criteria.
Figure 2.
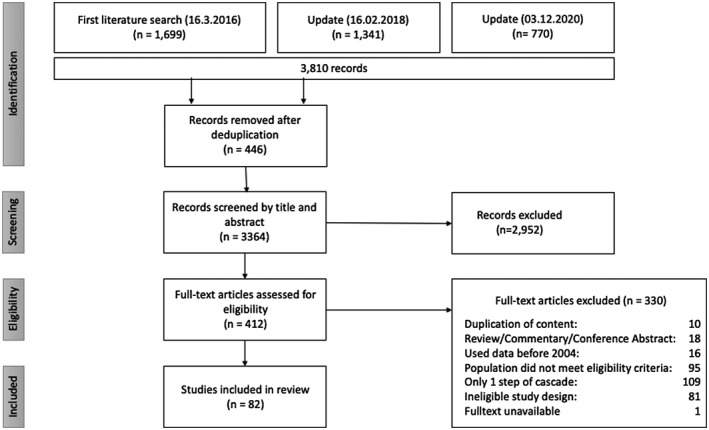
Flowchart of study selection.
3.2. Study characteristics
The median year of publication of studies was 2015 (Table 1). The studies included a median of 1776 people; the largest study had 884,328 people and the smallest 112 people. Most studies (58 studies, 71.6%) were longitudinal, with a median follow‐up of three years. The medium number of steps covered by each study was 3 (interquartile range [IQR] 2 to 4); 12 studies assessed all three of the 90‐90‐90 steps [8, 20, 21, 22, 23, 24, 25, 26, 27, 28, 29, 30]. Most studies were from Southern Africa (38 studies, 34 from South Africa) and East Africa (29 studies). Nineteen countries were represented (Burkina Faso, Cameroon, Côte d'Ivoire, Ethiopia, Gabon, Kenya, Lesotho, Malawi, Mozambique, Nigeria, Rwanda, Senegal, Sierra Leone, South Africa, Tanzania, Togo, Uganda, Zambia and Zimbabwe).
Table 1.
Characteristics of 82 published studies reporting on the HIV care cascade in sub‐Saharan Africa
| Characteristic | |
|---|---|
| Year of publication | 2015 (2013 to 2019) |
| No. of people included | 1776 (559 to 7536) |
| Study design | |
| Longitudinal study | 58 (71.6%) |
| Cross‐sectional study | 18 (22.2%) |
| Mixed design a | 5 (6.25) |
| No. of steps covered | 3 (2 to 4) |
| Duration of follow‐up (years) b | 3 (2 to 6) |
| Total no. of countries included | 19 |
| Region | |
| Central Africa | 4 (4,9%) |
| East Africa | 29 (35.4%) |
| Southern Africa | 38 (46.3%) |
| West Africa | 7 (8.5%) |
| Multi‐regional study | 4 (4.9%) |
| No. of sites c | 2 (1 to 15) |
| No. of studies at national level | 2 (2.4%) |
| Data collection methods | |
| Routine clinical records | 61 (74.4%) |
| Questionnaires | 35 (42.7%) |
| Blood samples collected specifically for study | 33 (40.2%) |
| Clinical records extracted from d | |
| Paper files only | 6 (9.8%) |
| Paper and electronic files | 10 (16.4%) |
| Electronic files only | 28 (45.9%) |
| Not reported | 17 (27.8%) |
Median (interquartile range) or number (%) are shown.
Studies combining cross‐sectional and longitudinal datasets
data for the 58 longitudinal studies
studies not reporting on national level or mobile testing (N = 52)
61 studies where clinical records were used.
3.3. Data collection and management
In 61 (74.4%) of the studies, data collection was performed by the clinic or hospital where participants were in care. Sixty‐one (74.4%) studies used data collected through routine clinical records, 35 (42.7%) used questionnaires and 33 (40.2%) studies collected samples specifically for the study. Twenty‐eight studies (45.9%) reported using data captured in an electronic database only, and most of the studies (56, 68.3%) had a personal identifier assigned to study participants, which allowed for tracking of the participants along the cascade (Table 1).
3.4. Number of definitions of numerator and denominator
The number of different definitions used in the 82 studies for the numerators defining the different steps ranged from four definitions (for step “People living with HIV”) to 21 (step “Viral suppression”). Similarly, the number of different denominators ranged from three (step “Diagnosed and aware of HIV status”) to 14 (step “Viral suppression”) (Table 2). The median number of definitions used across the seven steps was 8 for the numerator and 8 for the denominator.
Table 2.
Reporting and definitions provided on seven HIV care cascade steps in 82 published studies
| HIV care cascade step | Description | Study design | No. of studies reporting on step (% of 82 studies) | No. of studies reporting definition for numerator and denominator (% of studies reporting on step) | No. of definitions used for numerator | No. of definitions used for denominator | |
|---|---|---|---|---|---|---|---|
| Description of definitions | Description of definitions | ||||||
| 1 | People living with HIV | The proportion of people testing positive for HIV |
10 Cross‐sectional 3 Longitudinal 2 Mixed study design b |
15 (18%) | 14 (93%) | 4 | 5 |
|
People tested HIV positive in study through:
People tested HIV positive OR self‐reporting being HIV positive |
People tested for HIV:
|
||||||
| 2 a | Diagnosed and aware of their status | The proportion of people living with HIV who are aware of their status |
10 Cross‐sectional 10 Longitudinal 4 Mixed study design |
24 (29%) | 19 (79%) | 5 | 3 |
|
Self‐reported to be HIV positive Awareness of HIV‐positive status either through VCT at the sero‐survey or through self‐reporting. HIV infection assessed through:
|
|
||||||
| 3 | Linked to pre‐ART care | The proportion of people living with HIV linked to care |
10 Cross‐sectional 15 Longitudinal 3 Mixed study design |
28 (34%) | 24 (86%) | 5 | 6 |
|
Self‐reported measures:
Assessed through clinical records:
Time point of measurement: 1 to 12 months since diagnosis |
|
||||||
| 4 | Retention in pre‐ART care | The proportion of people linked to HIV care who are retained in pre‐ART care |
6 Cross‐sectional 13 Longitudinal |
19 (23%) | 12 (63%) | 8 | 10 |
|
Self‐reported measures:
Ascertained through clinical records:
Time point of measurement:
Definitions that were not further specified but allowed for interpretation of findings: "not eligible for ART or eligible but retained in care," "retained in the HIV care cascade" |
|
||||||
| 5 | ART initiation | The proportion of people linked to pre‐ART care who initiated ART |
3 Cross‐sectional 32 Longitudinal 4 Mixed study design |
39 (48%) | 25 (64%) | 9 | 9 |
|
Assessed as:
Time point of measurement:
Definition that was not further specified: "Participants initiating ART" |
PLWH:
Participants ever linked to care Enrolled in study with available VL Eligible for ART:
|
||||||
| 6 a | Retention on ART | The proportion of people on sustained ART who initiated ART |
13 Cross‐sectional 29 Longitudinal 4 Mixed study design |
46 (56%) | 34 (74%) | 12 | 8 |
|
Self‐reported measures:
Ascertained through:
Time points for measurement for longitudinal studies:
Definitions that were not further specified: "Currently on ART," “active on ART,” “self‐reported retention in care” |
|
||||||
| 7 a | Viral suppression | The proportion of all people receiving ART who have suppression of HIV replication |
16 Cross‐sectional 32 Longitudinal 4 Mixed study design |
52 (63%) | 48 (92%) | 21 | 14 |
|
Definition of viral suppression ranged from <25 to <5000 copies/mL. Threshold was not explicitly stated in one study. Time points at which viral suppression was assessed ranged from 1 month on ART to 10 years on ART. Time point was not specified in 18 studies |
Patients with available VL measurements
Patients on ART with available VL
Definitions that were not further specified: “Participants initiating ART” |
Correspond to UNAIDS 90‐90‐90 targets
cross‐sectional and longitudinal component.
3.5. Numerators and denominators along the cascade
The most frequently studied cascade populations were PLWH on ART with viral suppression (the third 90), followed by PLWH who have been diagnosed and are retained on ART (the second 90) and PLWH who have been diagnosed and started ART (Figure 3). In cross‐sectional studies, PLWH who had been diagnosed with HIV infection was the most common denominator used to describe retention at a subsequent step. The number of patients retained on ART was another commonly used denominator for viral suppression.
Figure 3.
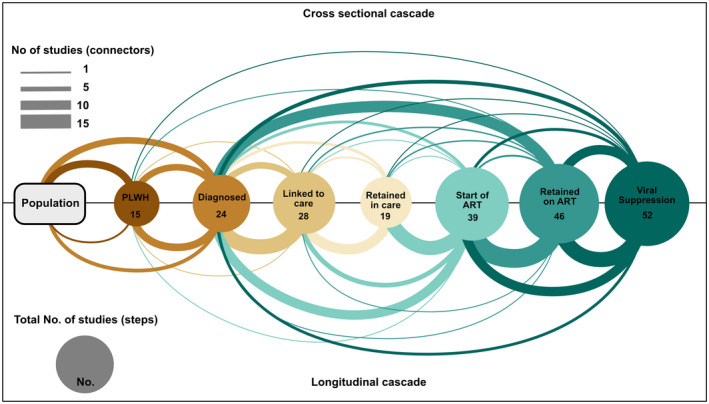
Cascade steps and denominators used for each step in 82 studies. Bubbles represent numerators, connectors point to the corresponding denominator.
As expected, in longitudinal studies, it was common to use the previous steps as the denominator for the subsequent step (Figure 3). For example the proportion of PLWH on ART with suppression of HIV replication was based on the number who were retained on ART. The latter, in turn, was based on the number of PLWH starting ART and so forth. In recent years (2018 to 2020) the denominator used for the step “Start of ART” changed, with more studies using “Diagnosed with HIV,” rather than “Retained in care” (Figure S1).
3.6. Individual steps of the cascade
3.6.1. People living with HIV
Fifteen studies reported numbers or percentages of PLWH [8, 22, 23, 24, 26, 27, 28, 29, 31, 32, 33, 34, 35, 36]: 10 were cross‐sectional, three were cohort studies and two of mixed design. All but one reported on the setting in which the testing took place (Table 2) and used the number who tested HIV positive as their definition of the numerator. One study included self‐reported HIV status among people who declined testing. Denominators were also consistent, with all studies using the number of people tested for HIV (Figure 3). Target populations tested differed between studies, ranging from adult residents of a high prevalence community to a random sample of the general population (Table 2).
3.6.2. Diagnosed and aware of HIV infection
Twenty‐four [20, 21, 22, 23, 24, 26, 27, 28, 29, 30, 31, 33, 34, 35, 37, 38, 39, 40, 41, 42, 43, 44, 45, 46] studies reported on people diagnosed with HIV and aware of their status, with 19 providing definitions for the denominator and numerator. Ten were cross‐sectional, 10 longitudinal and 4 included longitudinal and cross‐sectional components (mixed design). Awareness of HIV infection either relied on self‐reported information (questionnaires or interviews) or was assessed through clinical records; four studies did not specify the source of information. In most studies, denominators included the PLWH testing positive for HIV, but people attending HIV testing or the whole population were also used (Table 2). Only for eight studies, HIV diagnosis was the starting point of the cascade.
3.6.3. Linkage to pre‐ART care
Twenty‐eight studies reported on this step [20, 23, 24, 26, 27, 28, 31, 33, 34, 35, 37, 38, 39, 41, 44, 45, 47, 48, 49, 50, 51, 52, 53, 54, 55, 56, 57, 58]: 15 cohort studies, 10 cross‐sectional and three of mixed design. Twenty‐four studies (86%) provided a clear definition of the step (Table 2). Numerators were based on self‐reported clinic visits or assessments of eligibility for ART, or clinical records, with studies assessing linkage from 1 to 12 months since diagnosis (Table 2). Denominators were homogenous, defined as patients newly diagnosed with HIV or patients testing HIV positive (Figure 3).
3.6.4. Retention in pre‐ART care
Nineteen studies reported on retention in pre‐ART care [2, 20, 26, 27, 34, 49, 50, 51, 53, 54, 55, 56, 59, 60, 61, 62, 63, 64, 65], with 12 defining numerators and denominators. Six studies were cross‐sectional and 13 longitudinal. The definitions for numerators differed for the type of information used (self‐reported clinical visit or eligibility assessment, or clinical records) and the time of assessing retention after HIV diagnosis. Denominators were heterogeneous and included people newly diagnosed with HIV, PLWH who were not eligible for ART or not receiving ART, participants who present for at least one follow‐up visit or people receiving same‐day HIV testing (Table 2).
3.6.5. Initiation of ART
Thirty‐nine studies reported on initiation of ART [2, 21, 23, 28, 33, 34, 37, 40, 41, 42, 44, 45, 46, 47, 49, 50, 51, 52, 53, 54, 55, 56, 57, 58, 59, 60, 61, 62, 64, 66, 67, 68, 69, 70, 71, 72, 73, 74, 75], with 25 (64%) defining numerators and denominators. Thirty‐two were longitudinal, four of mixed design and three were cross‐sectional. Initiation of ART was either self‐reported or ascertained through clinical records. Most studies used participants eligible for ART based on CD4 cell count or clinical staging as the denominator. Three studies used all PLWH as the denominator (Table 2). The denominator and numerator also differed regarding the time point at which initiation of ART was assessed (certain time point since eligibility for ART; times since diagnosis and number of initiations at the end of the study period) (Table 2).
3.6.6. Retention on ART
Overall 46 studies [2, 20, 21, 22, 23, 24, 26, 27, 28, 29, 30, 32, 40, 43, 45, 49, 50, 51, 53, 61, 63, 65, 68, 69, 72, 74, 75, 76, 77, 78, 79, 80, 81, 82, 83, 84, 85, 86, 87, 88, 89, 90, 91, 92, 93, 94] reported on retention on ART or being on ART and 34 (74%) provided clear definitions of numerators and denominators. The majority of studies were longitudinal (29 studies, 63%), 13 were cross‐sectional and four of mixed design. Studies not reporting a clear definition described this step as "currently on ART" or similar. Numerators were either self‐reported or ascertained through clinical records, pharmacy records or pill counts (Table 2). Time points for assessing numerators ranged from retention for six months to ten years of ART. The most frequently used denominator was based on the patients starting ART (26 studies, 56%) (Figure 3).
3.6.7. Viral suppression
A total of 52 studies reported numbers or percentages of patients retained at this step [8, 20, 21, 22, 23, 24, 25, 26, 27, 28, 29, 30, 31, 32, 34, 36, 40, 41, 42, 43, 46, 56, 58, 65, 68, 69, 72, 73, 74, 76, 77, 78, 79, 80, 81, 82, 83, 84, 85, 86, 87, 88, 89, 90, 91, 92, 93, 95, 96, 97, 98, 99]. The majority of studies (32 studies, 62%) covering this step were longitudinal studies. Viral suppression was based on laboratory results; one of the studies used self‐reported viral suppression as the definition for the numerator. Variable definitions of viral suppression and time points when viral load was measured led to different denominators. Thresholds used for definition of viral suppression ranged from <25 to <5000 copies/mL. The threshold most frequently used was <400 copies/mL (15 studies, 31%) (Table 2). Time points at which viral suppression was assessed ranged from one month to ten years on ART and was not specified in 18 (35%) out of the 52 studies. The most frequent time point for the assessment of viral suppression was 12 months after ART initiation (15 studies, 31%). The denominators used varied widely. It ranged from all PLWH patients to patients with available viral load (VL) measurement at 10 years (Table 2).
4. DISCUSSION
This systematic review of published studies from sub‐Saharan Africa examined the approaches used to define the steps in the HIV care cascade and the steps covered in studies. Its results show that the definitions of the steps along the HIV care cascade are highly heterogeneous. Only 12 studies assessed all three 90‐90‐90 steps. Many studies focused on a subset of steps, with most studies assessing the start of ART, retention on ART, and achieving viral suppression. These steps are easier to assess within a typical clinic‐based cohort and are also part of the 90‐90‐90 goals proposed by UNAIDS, which might explain the numerous studies reporting on these steps. Fewer studies examined the earlier steps, including the proportion of PLWH who have been diagnosed with HIV infection (the first 90) or the step of linkage to care.
The various definitions used for numerators and denominators mean that the proportions of patients retained at each step cannot easily be compared between studies, countries and time periods. Also, the statistical combination of data in meta‐analyses, for example, for one country or region, would be problematic in this situation because "apples are combined with oranges" [100]. The heterogeneous definitions may be explained by the focus of studies, which may have been on retention in general, not specifically on the 90‐90‐90 targets. Of note, for the step of viral suppression, where definitions could be expected to be more consistent than for other steps, we identified a total of 21 different numerator definitions. Changing viral load thresholds over time and different time‐points of measuring contributed to the many different numerators, reflecting changing recommendations for defining viral suppression. The denominators also varied widely, ranging from all PLWH to patients starting ART. In recent years, PLWH diagnosed with HIV became a more common denominator for the proportion of patients on ART, reflecting the introduction of the “treat‐all” guidelines. “Retention in pre‐ART” care does no longer apply with “treat‐all”.
Previous studies from high‐income and lower‐income settings have highlighted the lack of uniformity in definitions [5, 6, 7, 101, 102]. To the best of our knowledge, this is the first comprehensive review of the methods used to assess the full HIV care cascade in sub‐Saharan Africa, including the definitions of numerators and denominators from cross‐sectional and longitudinal studies. Most previous studies focused on one part of the HIV care cascade, for example highlighting the lack of uniformity following specific community‐based testing strategies [103, 104], or on other settings, for example high‐income countries [7, 105]. Several studies from high‐income settings have previously highlighted the heterogeneity and lack of standardization [101, 102]. Haber and colleagues recommended investments in population‐based, longitudinal cohorts so that data can be linked at the individual level across steps (denominator–denominator linkage) and within steps (denominator–numerator linkage) [6]. We found that the majority of studies reporting on the cascade use longitudinal rather than cross‐sectional data. However, denominator–denominator or denominator–numerator linkages over several steps were rare. Globally agreed‐upon measures to quantify the HIV care cascade are needed to evaluate the scope of and factors that are associated with attrition along the cascade [6, 14, 105, 106].
A strength of our study is that we included smaller surveys and cohorts that are not necessarily representative of the national level but highly relevant to many settings in sub‐Saharan Africa. Some weaknesses need to be considered. Our review was based on a systematic search of the academic literature and did not consider other reports on the HIV care cascade. For example we did not include reports published by governments describing national care continua. Of note, a systematic review of national data found that only a few complete national continua of care were available, and there was much heterogeneity in the methods for determining progress towards the 90‐90‐90 target [5]. A previous systematic review identified 13 cascades from the USA, Canada, Denmark, Georgia and Australia and recommended the use of population‐based data sets to improve comparability [7]. Another study examined the linkage steps to care and ART initiation following community‐based detection of HIV [107]. Similar to our research, the authors found that definitions of numerators and denominators and observation periods were heterogeneous and that a meta‐analysis was inappropriate. We did not examine disengagement and reengagement in care. Such “churning in and out of HIV care” was beyond the scope of this review [108].
We did not systematically search for reports from the Population‐based HIV Impact Assessment (PHIA) surveys and did not include them [109, 110]. The PHIA project performed nationally representative cross‐sectional surveys for 13 different countries, measuring the three 90‐90‐90 steps of the HIV care cascade. In contrast to the academic literature, multinational studies, which use a standardized methodology, can provide data that are comparable across countries. Where a population‐based nationwide cohort is missing, combined information from cross‐sectional studies, cohort studies and from health surveillance is often used to evaluate the HIV cascade of care. A weakness that applies both to the PHIA surveys and the academic literature is the limited coverage of data on the care cascade. In our review, we identified studies from 19 countries in sub‐Saharan Africa. Therefore, data on the care cascade may still be lacking for some countries, including countries profoundly affected by the HIV epidemic. The IeDEA collaboration is an extensive network of clinical cohorts, which can address the later steps of the HIV cascade in a standardized way [17, 111].
5. CONCLUSIONS
In conclusion, the many different numerators and denominators used along the HIV care cascade limit the comparability between studies. It is not clear whether observed differences in results are due to real differences or different approaches to the calculation of numerators and denominators. Future studies assessing the HIV care cascade should provide clear definitions of numerators and denominators used. To identify gaps and opportunities for specific interventions to improve the cascade of care, we need standard definitions, such as those definitions proposed by the WHO [14].
Competing interests
The authors declare no competing interests.
Authors’ contributions
AG, BR, CM, FV and ME conceived the study and wrote the protocol. AG, FV, CM and DK performed title and abstract screening. AG, CM and DK performed full‐text screening. CM and DK performed data extraction and analysis. CM and ME wrote the first draft of the paper. All authors reviewed and approved the final manuscript.
Supporting information
Figure S1. Cascade steps and denominators used for each step. Bubbles represent numerators; connectors point to the corresponding denominator. Original search (upper panel) and new studies (lower panel).
Acknowledgement
We are grateful to Leona Hulbert for her help with data extraction and to Lea Sophie Heinrichsmeier for help with proof checking.
Funding
Funding of the International epidemiology Databases to Evaluate AIDS Southern Africa (IeDEA‐SA) collaboration was provided by 10 institutes, centres and programmes of the US National Institutes of Health (NIH): the U.S. National Institutes of Health’s National Institute of Allergy and Infectious Diseases (NIAID) (https://www.niaid.nih.gov), the Eunice Kennedy Shriver National Institute of Child Health and Human Development (NICHD) (https://www.nichd.nih.gov), the National Cancer Institute (NCI) (https://www.cancer.gov), the National Institute of Mental Health (NIMH) (https://www.nimh.nih.gov), the National Institute on Drug Abuse (NIDA) (https://www.drugabuse.gov), the National Heart, Lung, and Blood Institute (NHLBI) (https://www.nhlbi.nih.gov), the National Institute on Alcohol Abuse and Alcoholism (NIAAA) (https://www.niaaa.nih.gov), the National Institute of Diabetes and Digestive and Kidney Diseases (NIDDK) (https://www.niddk.nih.gov), the Fogarty International Center (FIC) (https://www.fic.nih.gov) and the National Library of Medicine (NLM) (https://www.nlm.nih.gov/) under Award Number U01AI069924. The research reported is solely the responsibility of the authors and does not necessarily represent the official views of the U.S. National Institutes of Health. ME was supported by special project funding (Grant No. 189498) from the Swiss National Science Foundation (www.snf.ch). The funders had no role in study design, data collection and analysis, decision to publish, or preparation of the manuscript. The content is solely the responsibility of the authors and does not necessarily represent the official views of the U.S. National Institutes of Health or any governments or institutions mentioned earlier.
Mugglin, C. , Kläger, D. , Gueler, A. , Vanobberghen, F. , Rice, B. and Egger, M. The HIV care cascade in sub‐Saharan Africa: systematic review of published criteria and definitions. J Int AIDS Soc. 2021; 24(7):e25761
PROSPERO Number: CRD42017055863
REFERENCES
- 1. Joint United Nations Programme on HIV/AIDS (UNAIDS) . 90‐90‐90‐on the right track towards the global target. Geneva: UNAIDS; 2016. [Google Scholar]
- 2. McNairy ML, Lamb MR, Abrams EJ, Elul B, Sahabo R, Hawken MP, et al. Use of a comprehensive HIV care cascade for evaluating HIV program performance: findings from 4 sub‐Saharan African countries. J Acquir Immune Defic Syndr. 2015;70(2):e44–51. 10.1097/QAI.0000000000000745. [DOI] [PMC free article] [PubMed] [Google Scholar]
- 3. Lippman SA, El Ayadi AM, Grignon JS, Puren A, Liegler T, Venter WDF, et al. Improvements in the South African HIV care cascade: findings on 90–90‐90 targets from successive population‐representative surveys in North West Province. J Int AIDS Soc. 2019;22:e25295. [DOI] [PMC free article] [PubMed] [Google Scholar]
- 4. Benzekri NA, Sambou JF, Ndong S, Diallo MB, Tamba IT, Faye D, et al. Food insecurity predicts loss to follow‐up among people living with HIV in Senegal, West Africa. AIDS Care. 2021;1–9. 10.1080/09540121.2021.1894316 [DOI] [PMC free article] [PubMed] [Google Scholar]
- 5. Granich R, Gupta S, Hall I, Aberle‐Grasse J, Hader S, Mermin J. Status and methodology of publicly available national HIV care continua and 90‐90‐90 targets: a systematic review. PLOS Med. 2017;14:e1002253. 10.1371/journal.pmed.1002253 [DOI] [PMC free article] [PubMed] [Google Scholar]
- 6. Haber N, Pillay D, Porter K, Barnighausen T. Constructing the cascade of HIV care: methods for measurement. Curr Opin HIV AIDS. 2016;11(1):102–8. [DOI] [PubMed] [Google Scholar]
- 7. Medland NA, McMahon JH, Chow EPF, Elliott JH, Hoy JF, Fairley CK. The HIV care cascade: a systematic review of data sources, methodology and comparability. J Int AIDS Soc. 2015;18(1):1–8. [DOI] [PMC free article] [PubMed] [Google Scholar]
- 8. Lippman SA, Shade SB, El Ayadi AM, Gilvydis JM, Grignon JS, Liegler T, et al. Attrition and opportunities along the HIV care continuum: findings from a population‐based sample, north west province, South Africa. J Acquir Immune Defic Syndr. 2016;73(1):91–9. [DOI] [PMC free article] [PubMed] [Google Scholar]
- 9. Mueller M, D’Addario M, Egger M, Cevallos M, Dekkers O, Mugglin C, et al. Methods to systematically review and meta‐analyse observational studies: a systematic scoping review of recommendations. BMC Med Res Methodol. 2018;18(1):44. 10.1186/s12874-018-0495-9 [DOI] [PMC free article] [PubMed] [Google Scholar]
- 10. Dekkers OM, Vandenbroucke JP, Cevallos M, Renehan AG, Altman DG, Egger M. COSMOS‐E. Guidance on conducting systematic reviews and meta‐analyses of observational studies of etiology. PLoS Med. 2019;16:e1002742. 10.1371/journal.pmed.1002742 [DOI] [PMC free article] [PubMed] [Google Scholar]
- 11. Moher D, Liberati A, Tetzlaff J, Altman DG; PRISMA Group . Preferred reporting items for systematic reviews and meta‐analyses: the PRISMA statement. PLoS Med. 2009;6:e1000097. 10.1371/journal.pmed.1000097 [DOI] [PMC free article] [PubMed] [Google Scholar]
- 12. Gueler A, Vanobberghen F, Rice B, Egger M, Mugglin C. The HIV Care Cascade from HIV diagnosis to viral suppression in sub‐Saharan Africa: a systematic review and meta‐regression analysis protocol. Syst Rev. 2017;6(1):172. 10.1186/s13643-017-0562-z [DOI] [PMC free article] [PubMed] [Google Scholar]
- 13. Booth A, Clarke M, Dooley G, Ghersi D, Moher D, Petticrew M, et al. The nuts and bolts of PROSPERO: an international prospective register of systematic reviews. Syst Rev. 2012;1(1)2. 10.1186/2046-4053-1-2 [DOI] [PMC free article] [PubMed] [Google Scholar]
- 14. World Health Organization .Cascade data use manual to identify gaps in HIV and health services for programme improvement. Geneva: World Health Organization; 2018. [Google Scholar]
- 15. Perlman DC, Jordan AE, Nash D. Conceptualizing care continua: lessons from HIV, hepatitis C virus, tuberculosis and implications for the development of improved care and prevention continua. Front Public Health. 2016;4:296. [DOI] [PMC free article] [PubMed] [Google Scholar]
- 16. Lauritsen JM, Bruus BM. EpiData Entry (version). A comprehensive tool for validated entry and documentation of data. The EpiData Association, Odense Denmark, Version 4.4.1.0. 2018.
- 17. Chammartin F, Ostinelli CHD, Anastos K, Jaquet A, Brazier E, Brown S, et al. Cohort profile: the international epidemiology databases to evaluate AIDS (IeDEA) in sub‐Saharan Africa, 2012–2019. BMJ Open. 10:e035246. [DOI] [PMC free article] [PubMed] [Google Scholar]
- 18. StataCorp . Stata: release 14. Statistical software. College Station, TX: StataCorp LLC; 2015. [Google Scholar]
- 19. Waruiru W, Kim AA, Kimanga DO, Ng'ang'a J, Schwarcz S, Kimondo L, et al. The Kenya AIDS indicator survey 2012. JAIDS J Acquir Immune Defic Syndr. 2014;66 Supplement 1:S3–12. 10.1097/QAI.0000000000000114 [DOI] [PMC free article] [PubMed] [Google Scholar]
- 20. Wafula R, Masyuko S, Ng'ang'a L, Kim AA, Gichangi A, Mukui I, et al. Engagement in HIV care among Kenyan adults and adolescents: results from a national population‐based survey. J Acquir Immune Defic Syndr. 2014;66(Supplement 1):S98–105. [DOI] [PMC free article] [PubMed] [Google Scholar]
- 21. Muddu M, Tusubira AK, Sharma SK, Akiteng AR, Ssinabulya I, Schwartz JI. Integrated hypertension and HIV care cascades in an HIV treatment program in Eastern Uganda: a retrospective cohort study. J Acquir Immune Defic Syndr. 2019;81(5):552–61. [DOI] [PMC free article] [PubMed] [Google Scholar]
- 22. Burgos‐Soto J, Ben Farhat J, Alley I, Ojuka P, Mulogo E, Kise‐Sete T, et al. HIV epidemic and cascade of care in 12 east African rural fishing communities: results from a population‐based survey in Uganda. BMC Public Health. 2020;20(1):970. 10.1186/s12889-020-09121-6 [DOI] [PMC free article] [PubMed] [Google Scholar]
- 23. van Rooyen H , Barnabas RV, Baeten JM, Phakathi Z, Joseph P, Krows M, et al. High HIV testing uptake and linkage to care in a novel program of home‐based HIV counseling and testing with facilitated referral in KwaZulu‐Natal, South Africa. J Acquir Immune Defic Syndr. 2013;64(1):e1–8. 10.1097/QAI.0b013e31829b567d [DOI] [PMC free article] [PubMed] [Google Scholar]
- 24. Grobler A, Cawood C, Khanyile D, Puren A, Kharsany ABM. Progress of UNAIDS 90‐90‐90 targets in a district in KwaZulu‐Natal, South Africa, with high HIV burden, in the HIPSS study: a household‐based complex multilevel community survey. Lancet HIV. 2017;4(11):e505–13. 10.1016/S2352-3018(17)30122-4 [DOI] [PubMed] [Google Scholar]
- 25. Jean K, Puren A, Cutler E, Singh B, Bouscaillou J, Rain‐Taljaard R, et al. Level of viral suppression and the cascade of HIV care in a South African semi‐urban setting in 2012. AIDS. 2016;30(13):2107–16. 10.1097/QAD.0000000000001155 [DOI] [PubMed] [Google Scholar]
- 26. Maman D, Zeh C, Mukui I, Kirubi B, Masson S, Opolo V, et al. Cascade of HIV care and population viral suppression in a high‐burden region of Kenya. AIDS. 2015;29(12):1557–65. [DOI] [PMC free article] [PubMed] [Google Scholar]
- 27. Maman D, Chilima B, Masiku C, Ayouba A, Masson S, Szumilin E, et al. Closer to 90–90‐90. The cascade of care after 10 years of ART scale‐up in rural Malawi: a population study. J Int AIDS Soc. 2016;19(1):20673. [DOI] [PMC free article] [PubMed] [Google Scholar]
- 28. Barnabas RV, van Rooyen H , Tumwesigye E, Murnane PM, Baeten JM, Humphries H, et al. Initiation of antiretroviral therapy and viral suppression after home HIV testing and counselling in KwaZulu‐Natal, South Africa, and Mbarara district, Uganda: a prospective, observational intervention study. Lancet HIV. 2014;1(2):e68–76. 10.1016/S2352-3018(14)70024-4 [DOI] [PMC free article] [PubMed] [Google Scholar]
- 29. Hansoti B, Mwinnyaa G, Hahn E, Rao A, Black J, Chen V, et al. Targeting the HIV epidemic in South Africa: the need for testing and linkage to care in emergency departments. EClinicalMedicine. 2019;15:14–22. 10.1016/j.eclinm.2019.08.007 [DOI] [PMC free article] [PubMed] [Google Scholar]
- 30. Edwards JK, Arimi P, Ssengooba F, Mulholland G, Markiewicz M, Bukusi EA, et al. The HIV care continuum among resident and non‐resident populations found in venues in East Africa cross‐border areas. J Int AIDS Soc. 2019;22:e25226. [DOI] [PMC free article] [PubMed] [Google Scholar]
- 31. Rao A, Kennedy C, Mda P, Quinn TC, Stead D, Hansoti B. Patient acceptance of HIV testing services in rural emergency departments in South Africa. South Afr J HIV Med. 2020;21(1):1–9. [DOI] [PMC free article] [PubMed] [Google Scholar]
- 32. Hansoti B, Stead D, Eisenberg A, Mvandaba N, Mwinnyaa G, Patel EU, et al. A window into the HIV epidemic from a South African emergency department. AIDS Res Hum Retroviruses. 2019;35(2):139–44. [DOI] [PMC free article] [PubMed] [Google Scholar]
- 33. Baisley KJ, Seeley J, Siedner MJ, Koole K, Matthews P, Tanser F, et al. Findings from home‐based HIV testing and facilitated linkage after scale‐up of test and treat in rural South Africa: young people still missing. HIV Med. 2019;20(10):704–8. [DOI] [PMC free article] [PubMed] [Google Scholar]
- 34. Conan N, Coulborn RM, Simons E, Mapfumo A, Apollo T, Garone DB, et al. Successes and gaps in the HIV cascade of care of a high HIV prevalence setting in Zimbabwe: a population‐based survey. J Int AIDS Soc. 2020;23:e25613. [DOI] [PMC free article] [PubMed] [Google Scholar]
- 35. Chamie G, Kwarisiima D, Clark TD, Kabami J, Jain V, Geng E, et al. Leveraging rapid community‐based HIV testing campaigns for non‐communicable diseases in rural Uganda. PLoS One. 2012;7:e43400. 10.1371/journal.pone.0043400 [DOI] [PMC free article] [PubMed] [Google Scholar]
- 36. Mekuria LA, Nieuwkerk PT, Yalew AW, Sprangers MAG, Prins JM. High level of virological suppression among HIVinfected adults receiving combination antiretroviral therapy in Addis Ababa, Ethiopia. Antivir Ther. 2016;21(5):385–96. [DOI] [PubMed] [Google Scholar]
- 37. Govindasamy D, van Schaik N , Kranzer K, Wood R, Mathews C, Bekker LG. Linkage to HIV care from a mobile testing unit in South Africa by different CD4 count strata. J Acquir Immune Defic Syndr. 2011;58(3):344–52. [DOI] [PMC free article] [PubMed] [Google Scholar]
- 38. Kranzer K, Govindasamy D, van Schaik N , Thebus E, Davies N, Zimmermann M, et al. Incentivized recruitment of a population sample to a mobile HIV testing service increases the yield of newly diagnosed cases, including those in need of antiretroviral therapy. HIV Med. 2012;13(2):132–7. [DOI] [PMC free article] [PubMed] [Google Scholar]
- 39. Losina E, Bassett IV, Giddy J, Chetty S, Regan S, Walensky RP, et al. The “ART” of linkage: pre‐treatment loss to care after HIV diagnosis at two PEPFAR sites in Durban, South Africa. PLoS One. 2010;5:e9538. [DOI] [PMC free article] [PubMed] [Google Scholar]
- 40. Meintjes G, Kerkhoff AD, Burton R, Schutz C, Boulle A, Van Wyk G, et al. HIV‐related medical admissions to a south african district hospital remain frequent despite effective antiretroviral therapy scale‐up. Medicine. 2015;94:e2269. [DOI] [PMC free article] [PubMed] [Google Scholar]
- 41. Haber N, Tanser F, Bor J, Naidu K, Mutevedzi T, Herbst K, et al. From HIV infection to therapeutic response: a population‐based longitudinal HIV cascade‐of‐care study in KwaZulu‐Natal, South Africa. Lancet HIV. 2017;4(5):e223–30. [DOI] [PMC free article] [PubMed] [Google Scholar]
- 42. Billioux VG, Chang LW, Reynolds SJ, Nakigozi G, Ssekasanvu J, Grabowski MK, et al. Human immunodeficiency virus care cascade among sub‐populations in Rakai, Uganda: an observational study. J Int AIDS Soc. 2017;20(1):21590. 10.7448/17582652.2017.1333701 [DOI] [PMC free article] [PubMed] [Google Scholar]
- 43. Flynn AG, Anguzu G, Mubiru F, Kiragga AN, Kamya M, Meya DB, et al. Socioeconomic position and ten‐year survival and virologic outcomes in a Ugandan HIV cohort receiving antiretroviral therapy. PLoS One. 2017;12:e0189055. 10.1371/journal.pone.0189055 [DOI] [PMC free article] [PubMed] [Google Scholar]
- 44. Colombe S, Machemba R, Mtenga B, Lutonja P, Safari W, Beard J, et al. Cascade of care for HIV‐seroconverters in rural Tanzania: a longitudinal study. AIDS Care. 2020;32(5):666–71. 10.1080/09540121.2019.1640842 [DOI] [PubMed] [Google Scholar]
- 45. Fuente‐Soro L, Iniesta C, López‐Varela E, Cuna M, Guilaze R, Maixenchs M, et al. Tipping the balance towards long‐term retention in the HIV care cascade: a mixed methods study in southern Mozambique. PLoS One. 2019;14:e0222028. [DOI] [PMC free article] [PubMed] [Google Scholar]
- 46. Gesesew HA, Ward P, Woldemichael K, Mwanri L. HIV care continuum outcomes: can ethiopia meet the UNAIDS 90‐90‐90 targets? Ethiop J Health Sci. 2020;30(2):179–88. [DOI] [PMC free article] [PubMed] [Google Scholar]
- 47. Aliyu MH, Blevins M, Parrish DD, Megazzini KM, Gebi UI, Muhammad MY, et al. Risk factors for delayed initiation of combination antiretroviral therapy in rural north central Nigeria. J Acquir Immune Defic Syndr. 2014;65(2):e41–9. [DOI] [PMC free article] [PubMed] [Google Scholar]
- 48. Choko AT, MacPherson P, Webb EL, Willey BA, Feasy H, Sambakunsi R, et al. Uptake, accuracy, safety, and linkage into care over two years of promoting annual self‐testing for HIV in Blantyre, Malawi: a community‐based prospective study. PLoS Med. 2015;12(9):1549–676. 10.1371/journal.pmed.1001873 [DOI] [PMC free article] [PubMed] [Google Scholar]
- 49. Clouse K, Pettifor AE, Maskew M, Bassett J, Van Rie A, Behets F, et al. Patient retention from HIV diagnosis through one year on antiretroviral therapy at a primary health care clinic in Johannesburg, South Africa. J Acquir Immune Defic Syndr. 2013;62(2):e39–46. [DOI] [PMC free article] [PubMed] [Google Scholar]
- 50. du Toit E , van Schalkwyk C , Dunbar R, Jennings K, Yang B, Coetzee D, et al. Missed opportunities for retention in pre‐ART care in Cape Town, South Africa. PLoS One. 2014;9:e9686. [DOI] [PMC free article] [PubMed] [Google Scholar]
- 51. Fox MP, Shearer K, Maskew M, Meyer‐Rath G, Clouse K, Sanne I. Attrition through multiple stages of pre‐treatment and ART HIV care in South Africa. PLoS One. 2014;9:e110252. [DOI] [PMC free article] [PubMed] [Google Scholar]
- 52. Govindasamy D, Kranzer K, Van Schaik N, Noubary F, Wood R, Walensky RP, et al. Linkage to HIV, TB and non‐communicable disease care from a mobile testing unit in Cape Town, South Africa. PLoS One. 2013;8(11):1–11. [DOI] [PMC free article] [PubMed] [Google Scholar]
- 53. Kelly JD, Schlough GW, Conteh S, Barrie MB, Kargbo B, Giordano TP. The majority of the pre‐antiretroviral population who were lost to follow‐up stopped their care in freetown, sierra leone: a 12‐month prospective cohort study starting with HIV diagnosis. PLoS One. 2016;11(2):1–11. 10.1371/journal.pone.0149584 [DOI] [PMC free article] [PubMed] [Google Scholar]
- 54. Kranzer K, Zeinecker J, Ginsberg P, Orrell C, Kalawe NN, Lawn SD, et al. Linkage to HIV care and antiretroviral therapy in Cape Town, South Africa. PLoS ONE. 2010;5:e13801. [DOI] [PMC free article] [PubMed] [Google Scholar]
- 55. MacPherson P, Corbett EL, Makombe SD, van Oosterhout JJ , Manda E, Choko AT, et al. Determinants and consequences of failure of linkage to antiretroviral therapy at primary care level in Blantyre, Malawi: a prospective cohort study. PLoS One. 2012;7:e44794. 10.1371/journal.pone.0044794 [DOI] [PMC free article] [PubMed] [Google Scholar]
- 56. Ostermann J, Pence B, Whetten K, Yao J, Itemba D, Maro V, et al. HIV serostatus disclosure in the treatment cascade: evidence from Northern Tanzania. AIDS Care. 2015;27 Suppl 1:59–64. [DOI] [PMC free article] [PubMed] [Google Scholar]
- 57. Reddy EA, Agala CB, Maro VP, Ostermann J, Pence BW, Itemba DK, et al. Test site predicts HIV care linkage and antiretroviral therapy initiation: a prospective 3.5 year cohort study of HIV‐positive testers in northern Tanzania. BMC Infect Dis. 2016;16(1):1–10. 10.1186/s12879-016-1804-8 [DOI] [PMC free article] [PubMed] [Google Scholar]
- 58. Lurie MN, Kirwa K, Callaway J, Cornell M, Boulle A, Bengtson AM, et al. Quantifying the HIV treatment cascade in a South African health sub‐district by gender: retrospective cohort study. Trop Med Int Health. 2020;25(2):186–92. [DOI] [PMC free article] [PubMed] [Google Scholar]
- 59. Castelnuovo B, Musaazi J, Musomba R, Ratanshi RP, Kiragga AN. Quantifying retention during pre‐antiretroviral treatment in a large urban clinic in Uganda. BMC Infect Dis. 2015;15:252. [DOI] [PMC free article] [PubMed] [Google Scholar]
- 60. Clouse K, Hanrahan CF, Bassett J, Fox MP, Sanne I, Van Rie A. Impact of systematic HIV testing on case finding and retention in care at a primary care clinic in South Africa. Trop Med Int Health. 2014;19(12):1411–9. [DOI] [PubMed] [Google Scholar]
- 61. Janssen S, Wieten RW, Stolp S, Cremers AL, Rossatanga EG, Klipstein‐Grobusch K, et al. Factors associated with retention to care in an HIV clinic in gabon, central Africa. PLoS One. 2015;10:e0140746. [DOI] [PMC free article] [PubMed] [Google Scholar]
- 62. Melaku Z, Lamb MR, Wang C, Lulseged S, Gadisa T, Ahmed S, et al. Characteristics and outcomes of adult Ethiopian patients enrolled in HIV care and treatment: a multi‐clinic observational study. BMC Public Health. 2015;15:462. [DOI] [PMC free article] [PubMed] [Google Scholar]
- 63. Ugoji C, Okere N, Dakum P, Ake‐Uzoigwe R, Igboelina D, Ndembi N, et al. Correlates of patient retention in HIV care and treatment programs in Nigeria. Curr HIV Res. 2015;13(4):300–7. [DOI] [PubMed] [Google Scholar]
- 64. Teasdale CA, Abrams EJ, Yuengling KA, Lamb MR, Wang C, Vitale M, et al. Expansion and scale‐up of HIV care and treatment services in four countries over ten years. PLoS One. 2020;15(4):1–14. 10.1371/journal.pone.0231667 [DOI] [PMC free article] [PubMed] [Google Scholar]
- 65. Ross J, Ribakare M, Remera E, Murenzi G, Munyaneza A, Hoover DR, et al. High levels of viral load monitoring and viral suppression under Treat All in Rwanda – a cross‐sectional study. J Int AIDS Soc. 2020;23(6):1–6. [DOI] [PMC free article] [PubMed] [Google Scholar]
- 66. Bassett IV, Regan S, Chetty S, Giddy J, Uhler LM, Holst H, et al. Who starts antiretroviral therapy in Durban, South Africa?.. not everyone who should. AIDS. 2010;24 Suppl 1:S37–44. [DOI] [PMC free article] [PubMed] [Google Scholar]
- 67. Mugisha V, Teasdale CA, Wang C, Lahuerta M, Nuwagaba‐Biribonwoha H, Tayebwa E, et al. Determinants of mortality and loss to follow‐up among adults enrolled in HIV care services in Rwanda. PLoS One. 2014;9:e85774. [DOI] [PMC free article] [PubMed] [Google Scholar]
- 68. Reepalu A, Balcha TT, Skogmar S, Jemal ZH, Sturegard E, Medstrand P, et al. High rates of virological suppression in a cohort of human immunodeficiency virus‐positive adults receiving antiretroviral therapy in ethiopian health centers irrespective of concomitant tuberculosis. Open Forum Infect Dis. 2014;1:ofu039. [DOI] [PMC free article] [PubMed] [Google Scholar]
- 69. Rougemont M, Stoll BE, Elia N, Ngang P. Antiretroviral treatment adherence and its determinants in Sub‐Saharan Africa: a prospective study at Yaounde Central Hospital, Cameroon. AIDS Res Ther. 2009;6:21. [DOI] [PMC free article] [PubMed] [Google Scholar]
- 70. Agolory SG, Auld AF, Odafe S, Shiraishi RW, Dokubo EK, Swaminathan M, et al. High rates of loss to follow‐up during the first year of pre‐antiretroviral therapy for HIV patients at sites providing pre‐ART care in Nigeria, 2004–2012. PLoS One. 2017;12:e0183823. 10.1371/journal.pone.0183823 [DOI] [PMC free article] [PubMed] [Google Scholar]
- 71. Katz IT, Bogart LM, Dietrich JJ, Leslie HH, Iyer HS, Leone D, et al. Understanding the role of resilience resources, antiretroviral therapy initiation, and HIV‐1 RNA suppression among people living with HIV in South Africa: a prospective cohort study. AIDS. 2018;2019(33):S71–9. [DOI] [PMC free article] [PubMed] [Google Scholar]
- 72. Opito R, Mpagi J, Bwayo D, Okello F, Mugisha K, Napyo A. Treatment outcome of the implementation of HIV test and treat policy at The AIDs Support Organization (TASO) Tororo clinic, Eastern Uganda: a retrospective cohort study. PLoS One. 2020;15(9):1–14. 10.1371/journal.pone.0239087 [DOI] [PMC free article] [PubMed] [Google Scholar]
- 73. Bahemana E, Esber A, Dear N, Ganesan K, Parikh A, Reed D, et al. Impact of age on CD4 recovery and viral suppression over time among adults living with HIV who initiated antiretroviral therapy in the African Cohort Study. AIDS Res Ther. 2020;17(1):66. 10.1186/s12981-020-00323-x [DOI] [PMC free article] [PubMed] [Google Scholar]
- 74. Mshweshwe‐Pakela N, Hansoti B, Mabuto T, Kerrigan D, Kubeka G, Hahn E, et al. Feasibility of implementing same‐day antiretroviral therapy initiation during routine care in Ekurhuleni District, South Africa: retention and viral load suppression. South Afr J HIV Med. 2020;21(1):1–6. [DOI] [PMC free article] [PubMed] [Google Scholar]
- 75. Mody A, Glidden DV, Eshun‐Wilson I, Sikombe K, Simbeza S, Mukamba N, et al. Longitudinal care cascade outcomes among people eligible for antiretroviral therapy who are newly linking to care in Zambia: a multistate analysis. Clin Infect Dis. 2020;71(10):e561–70. 10.1093/cid/ciaa268 [DOI] [PMC free article] [PubMed] [Google Scholar]
- 76. Ahoua L, Guenther G, Pinoges L, Anguzu P, Chaix ML, Le Tiec C, et al. Risk factors for virological failure and subtherapeutic antiretroviral drug concentrations in HIV‐positive adults treated in rural northwestern Uganda. BMC Infect Dis. 2009;9:1–11. [DOI] [PMC free article] [PubMed] [Google Scholar]
- 77. Fatti G, Grimwood A, Bock P. Better antiretroviral therapy outcomes at primary healthcare facilities: an evaluation of three tiers of ART services in four South African provinces. PLoS One. 2010;5:e12888. 10.1371/journal.pone.0012888 [DOI] [PMC free article] [PubMed] [Google Scholar]
- 78. Fatti G, Mothibi E, Meintjes G, Grimwood A. Antiretroviral treatment outcomes amongst older adults in a large multicentre cohort in South Africa. PLoS One. 2014;9:e100273. [DOI] [PMC free article] [PubMed] [Google Scholar]
- 79. Fox MP, Shearer K, Maskew M, Macleod W, Majuba P, Macphail P, et al. Treatment outcomes after 7 years of public‐sector HIV treatment. AIDS. 2012;26(14):1823–8. [DOI] [PMC free article] [PubMed] [Google Scholar]
- 80. Kaleebu P, Kirungi W, Watera C, Asio J, Lyagoba F, Lutalo T, et al. Virological response and antiretroviral drug resistance emerging during antiretroviral therapy at three treatment centers in Uganda. PLoS One. 2015;10:e0145536. [DOI] [PMC free article] [PubMed] [Google Scholar]
- 81. Messou E, Chaix ML, Gabillard D, Minga A, Losina E, Yapo V, et al. Association between medication possession ratio, virologic failure and drug resistance in HIV‐1‐infected adults on antiretroviral therapy in Cote d’Ivoire. J Acquir Immune Defic Syndr. 2011;56(4):356–64. [DOI] [PMC free article] [PubMed] [Google Scholar]
- 82. Mutevedzi PC, Lessells RJ, Heller T, Barnighausen T, Cooke GS, Newell ML. Scale‐up of a decentralized HIV treatment programme in rural KwaZulu‐Natal, South Africa: does rapid expansion affect patient outcomes? Bull World Health Organ. 2010;88(8):593–600. [DOI] [PMC free article] [PubMed] [Google Scholar]
- 83. Mutevedzi PC, Lessells RJ, Rodger AJ, Newell ML. Association of age with mortality and virological and immunological response to antiretroviral therapy in rural South African adults. PLoS One. 2011;6:e21795. [DOI] [PMC free article] [PubMed] [Google Scholar]
- 84. Okoboi S, Ding E, Persuad S, Wangisi J, Birungi J, Shurgold S, et al. Community‐based ART distribution system can effectively facilitate long‐term program retention and low‐rates of death and virologic failure in rural Uganda. AIDS Res Ther. 2015;12:37. [DOI] [PMC free article] [PubMed] [Google Scholar]
- 85. Rich ML, Miller AC, Niyigena P, Franke MF, Niyonzima JB, Socci A, et al. Excellent clinical outcomes and high retention in care among adults in a community‐based HIV treatment program in rural Rwanda. J Acquir Immune Defic Syndr. 2012;59(3):e35–42. [DOI] [PubMed] [Google Scholar]
- 86. Sanne IM, Westreich D, Macphail AP, Rubel D, Majuba P, Van Rie A. Long term outcomes of antiretroviral therapy in a large HIV/AIDS care clinic in urban South Africa: a prospective cohort study. J Int AIDS Soc. 2009;12:38. [DOI] [PMC free article] [PubMed] [Google Scholar]
- 87. Shearer K, Fox MP, Maskew M, Berhanu R, Long L, Sanne I. The impact of choice of NNRTI on short‐term treatment outcomes among HIV‐infected patients prescribed tenofovir and lamivudine in Johannesburg, South Africa. PLoS One. 2013;8:e71719. [DOI] [PMC free article] [PubMed] [Google Scholar]
- 88. Ugbena R, Aberle‐Grasse J, Diallo K, Bassey O, Jelpe T, Rottinghaus E, et al. Virological response and HIV drug resistance 12 months after antiretroviral therapy initiation at 2 clinics in Nigeria. Clin Infect Dis. 2012;54 Suppl 4:S375–80. [DOI] [PubMed] [Google Scholar]
- 89. Wadonda‐Kabondo N, Hedt BL, van Oosterhout JJ , Moyo K, Limbambala E, Bello G, et al. A retrospective survey of HIV drug resistance among patients 1 year after initiation of antiretroviral therapy at 4 clinics in Malawi. Clin Infect Dis. 2012;54 Suppl 4:S355–61. [DOI] [PMC free article] [PubMed] [Google Scholar]
- 90. Moyo F, Chasela C, Brennan AT, Ebrahim O, Sanne IM, Long L, et al. Treatment outcomes of HIV‐positive patients on first‐line antiretroviral therapy in private versus public HIV clinics in Johannesburg, South Africa. Clin Epidemiol. 2016;8:37–47. 10.2147/CLEP.S93014 [DOI] [PMC free article] [PubMed] [Google Scholar]
- 91. Hirasen K, Evans D, Maskew M, Sanne IM, Shearer K, Govathson C, et al. The right combination – treatment outcomes among HIV‐positive patients initiating first‐line fixed‐dose antiretroviral therapy in a public sector HIV clinic in Johannesburg, South Africa. Clin Epidemiol. 2018;10:17–29. 10.2147/CLEP.S145983 [DOI] [PMC free article] [PubMed] [Google Scholar]
- 92. Ndagijimana Ntwali JDD, Decroo T, Ribakare M, Kiromera A, Mugwaneza P, Nsanzimana S, et al. Viral load detection and management on first line ART in rural Rwanda. BMC Infect Dis. 2019;19(1):1–9. [DOI] [PMC free article] [PubMed] [Google Scholar]
- 93. Desta AA, Woldearegay TW, Futwi N, Gebrehiwot GT, Gebru GG, Berhe AA, et al. HIV virological non‐suppression and factors associated with non‐suppression among adolescents and adults on antiretroviral therapy in northern Ethiopia: a retrospective study. BMC Infect Dis. 2020;20(1):4. 10.1186/s12879-019-4732-6 [DOI] [PMC free article] [PubMed] [Google Scholar]
- 94. Wendie TF, Workneh BD. Prevalence and predictors of virological failure among adults living with HIV in south wollo zone, northeast Ethiopia: a retrospective cohort study. HIV/AIDS. 2020;12:393–402. [DOI] [PMC free article] [PubMed] [Google Scholar]
- 95. Achieng L, Musangi H, Ong'uti S, Ombegoh E, Bryant L, Mwiindi J, et al. An observational cohort comparison of facilitators of retention in care and adherence to anti‐eetroviral therapy at an HIV treatment center in Kenya. PLoS One. 2012;7(3):1–7. [DOI] [PMC free article] [PubMed] [Google Scholar]
- 96. Aghokeng AF, Monleau M, Eymard‐Duvernay S, Dagnra A, Kania D, Ngo‐Giang‐Huong N, et al. Extraordinary heterogeneity of virological outcomes in patients receiving highly antiretroviral therapy and monitored with the world health organization public health approach in sub‐Saharan Africa and southeast Asia. Clin Infect Dis. 2014;58(1):99–109. [DOI] [PubMed] [Google Scholar]
- 97. Cohen GM, Werner L, Gengiah S, Naidoo K. Role of education in HIV clinical outcomes in a tuberculosis endemic setting. J Int Assoc Provid AIDS Care. 2014;13(5):402–8. [DOI] [PMC free article] [PubMed] [Google Scholar]
- 98. Liégeois F, Eymard‐Duvernay S, Boyer S, Maradan G, Kouanfack C, Domyeum J, et al. Heterogeneity of virological suppression in the national antiretroviral programme of Cameroon (ANRS 12288 EVOLCAM). HIV Med. 2019;20(1):38–46. [DOI] [PubMed] [Google Scholar]
- 99. Glass TR, Motaboli L, Nsakala B, Lerotholi M, Vanobberghen F, Amstutz A, et al. The viral load monitoring cascade in a resource‐limited setting: a prospective multicentre cohort study after introduction of routine viral load monitoring in rural Lesotho. PLoS One. 2019;14:e0220337. 10.1371/journal.pone.0220337 [DOI] [PMC free article] [PubMed] [Google Scholar]
- 100. Sharpe D. Of apples and oranges, file drawers and garbage: why validity issues in meta‐analysis will not go away. Clin Psychol Rev. 1997;17(8):881–901. [DOI] [PubMed] [Google Scholar]
- 101. Gourlay A, Noori T, Pharris A, Axelsson M, Costagliola D, Cowan S, et al. The human immunodeficiency virus continuum of care in European union countries in 2013: data and challenges. Clin Infect Dis. 2017;64(12):1644–56. 10.1093/cid/cix212 [DOI] [PMC free article] [PubMed] [Google Scholar]
- 102. Porter K, Gourlay A, Attawell K, Hales D, Supervie V, Touloumi G, et al. Substantial heterogeneity in progress toward reaching the 90–90‐90 HIV target in the WHO European region. J Acquir Immune Defic Syndr. 2018;79(1):28–37. 10.1097/QAI.0000000000001761 [DOI] [PMC free article] [PubMed] [Google Scholar]
- 103. Sabapathy K, Hensen B, Varsaneux O, Floyd S, Fidler S, Hayes R. The cascade of care following community‐based detection of HIV in sub‐Saharan Africa – a systematic review with 90–90‐90 targets in sight. PLoS One. 2018;13:e0200737. 10.1371/journal.pone.0200737 [DOI] [PMC free article] [PubMed] [Google Scholar]
- 104. Nachega JB, Adetokunboh O, Uthman OA, Knowlton AW, Altice FL, Schechter M, et al. Community‐based interventions to improve and sustain antiretroviral therapy adherence, retention in HIV care and clinical outcomes in low‐ and middle‐income countries for achieving the UNAIDS 90–90‐90 targets. Curr HIV/AIDS Rep. 2016;13(5):241–55. 10.1007/s11904-016-0325-9 [DOI] [PMC free article] [PubMed] [Google Scholar]
- 105. MacCarthy S, Hoffmann M, Ferguson L, Nunn A, Irvin R, Bangsberg D, et al. The HIV care cascade: models, measures and moving forward. J Int AIDS Soc. 2015;18:19395. 10.7448/IAS.18.1.19395 [DOI] [PMC free article] [PubMed] [Google Scholar]
- 106. Fox MP, Rosen S. A new cascade of HIV care for the era of “treat all”. PLoS Med. 2017;14:e1002268. [DOI] [PMC free article] [PubMed] [Google Scholar]
- 107. Sabapathy K, Hensen B, Varsaneux O, Floyd S, Fidler S, Hayes R. The cascade of care following community‐based detection of HIV in sub‐Saharan Africa – a systematic review with 90–90‐90 targets in sight. PLoS One. 2018;13:e0200737. [DOI] [PMC free article] [PubMed] [Google Scholar]
- 108. Nsanzimana S, Binagwaho A, Kanters S, Mills EJ. Churning in and out of HIV care. lancet HIV. 2014;1(2):e58–e59. [DOI] [PubMed] [Google Scholar]
- 109. Ministry of Health, Zambia . Zambia population‐based HIV impact assessment (ZAMPHIA) 2016: final report. Lusaka: Ministry of Health; 2019. [Google Scholar]
- 110. Ministry of Health U . Uganda population‐based HIV/impact assessment (UPHIA) 2016–2017: final report. Kampala: Ministry of Health; 2019. [Google Scholar]
- 111. Egger M, Ekouevi DK, Williams C, Lyamuya RE, Mukumbi H, Braitstein P, et al. Cohort Profile: the international epidemiological databases to evaluate AIDS (IeDEA) in sub‐Saharan Africa. Int J Epidemiol. 2012;41(5):1256–64. [DOI] [PMC free article] [PubMed] [Google Scholar]
Associated Data
This section collects any data citations, data availability statements, or supplementary materials included in this article.
Supplementary Materials
Figure S1. Cascade steps and denominators used for each step. Bubbles represent numerators; connectors point to the corresponding denominator. Original search (upper panel) and new studies (lower panel).