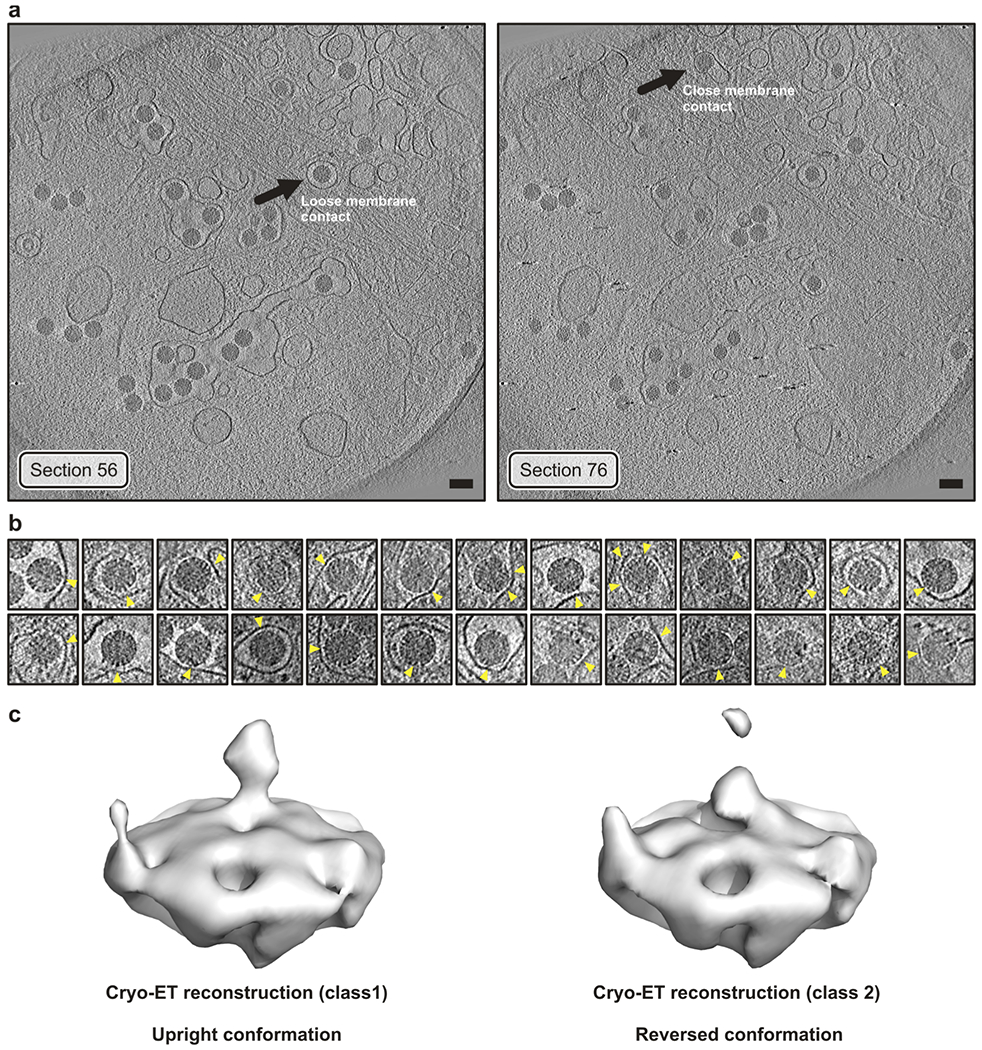
Extended Data Fig. 9 |. Cryo-tomographic (cryo-ET) analysis of RRVs entering BSC-1 cells.

a, Sections of the tomogram from which the reconstructions (icosahedral average of single virion subtomograms) in Fig. 4a were obtained. Left, virus with “loose” membrane contact indicated by an arrow. Right, virus with “tight” membrane contact indicated by an arrow. Images were low-pass filtered and contrast enhanced for display. Scale bar corresponds to 100 nm. b, Tomographic slices of manually selected viruses (not including particle in panel a) from several tomograms with tight membrane contacts (yellow arrowheads). Images were low-pass filtered and contrast enhanced for display. Those particles were selected to detect VP4 reversed conformations in additional viruses (other than particle in Fig. 4a). c, Sub-subtomogram classification of VP4 positions extracted from the RRV particles shown in panel b yielded a class (left) with the upright conformation and a class (right) with the reversed conformation. VP4 positions were extracted from 26 selected particles chosen to have an easily identified region of close membrane contact. The particle shown in Fig. 4a was excluded from this selection. Note that the reconstructions shown in Fig. 4a are from single particles with imposed icosahedral symmetry, whereas we show here classified averaged individual volumes extracted at VP4 positions.
