FIGURE 1.

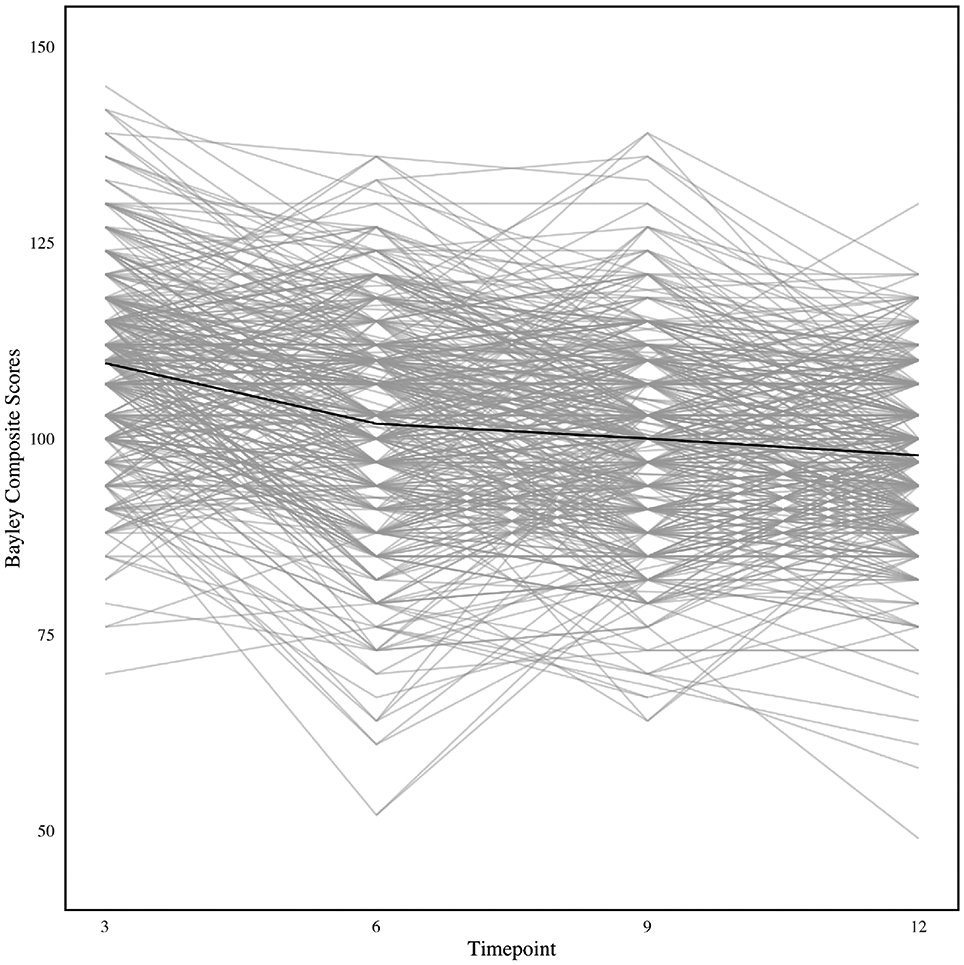
Longitudinal profile plot of infant development trajectories, with mean Bayley motor development score shown in black Note. Plot is based on the N = 1769 available measurements for n = 560 infants

Longitudinal profile plot of infant development trajectories, with mean Bayley motor development score shown in black Note. Plot is based on the N = 1769 available measurements for n = 560 infants