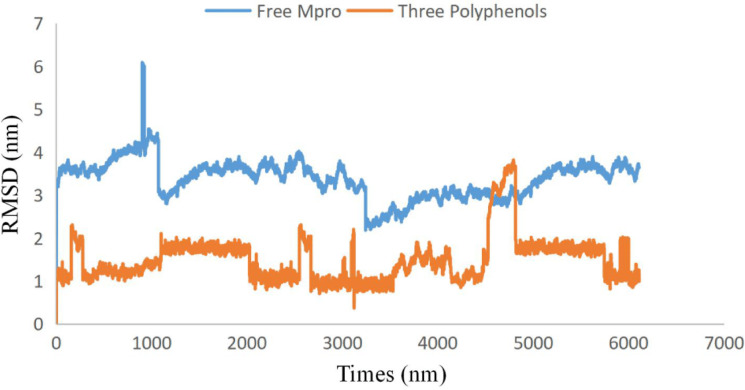
Figure 2. Plots of root-mean-square deviations of free SARS CoV-2 main protease (Mpro) (blue) and the complex of SARS CoV-2 main protease (7BUY) (red) with three polyphenols along the MD simulation time.
Free SARS CoV-2 main protease (Mpro) (blue) and the complex of SARS CoV-2 main protease (7BUY) (red) with three polyphenols.

