

Abstract
Adenylyl cyclase (AC) isoforms differ in their tissue distribution, cellular localization, regulation, and protein interactions. Most cell types express multiple AC isoforms. We hypothesized that cAMP produced by different AC isoforms regulates unique cellular responses in human bronchial smooth muscle cells (BSMC). Overexpression of AC2, AC3 or AC6 had distinct effects on forskolin (Fsk)-induced expression of a number of known cAMP-responsive genes. These data show that different AC isoforms can differentially regulate gene expression. Most notable, overexpression and activation of AC2 enhanced interleukin 6 (IL-6) expression, but overexpression of AC3 or AC6 had no effect. IL-6 production by BSMC was induced by Fsk and select G protein-coupled receptor (GPCR) agonists, though IL-6 levels did not directly correlate with global cAMP levels. Treatment with PKA selective 6-Bnz-cAMP or Epac selective 8-CPT-2Me-cAMP cAMP analogs revealed a predominant role for PKA in cAMP-mediated induction of IL-6. IL-6 promoter mutations demonstrated that AP-1 and CRE transcription sites were required for Fsk to stimulate IL-6 expression. Our present study defines an AC2 cAMP-signaling compartment that specifically regulates IL-6 expression in BSMC via Epac and PKA and demonstrates that other AC isoforms are excluded from this pool.
Keywords: Adenylyl Cyclase, Interleukin 6, Bronchial Smooth Muscle, cAMP, G Protein-Coupled Receptors, Gene Expression
Introduction
Bronchial smooth muscle cells (BSMC), which possess secretory and contractile properties, are involved in the airway hyper-responsiveness, constriction, and remodeling that occur in asthma (Tliba and Panettieri 2009). Airway constriction is treated with β-adrenergic receptor (βAR) agonists, which stimulate smooth muscle relaxation and bronchodilation through cAMP signaling pathways. In addition to relaxation, βAR activation also stimulates secretory functions of airway smooth muscle. Interleukin 6 (IL-6), a pro-inflammatory cytokine, is among the proteins secreted by BSMC following exposure to βAR agonists (Ammit et al. 2002). IL-6 levels are increased in blood serum and sputum of asthmatics and are inversely correlated with forced expiratory volume (Yokoyama et al. 1995; Rincon and Irvin 2012).
βAR agonists stimulate Gαs-coupled β2AR in smooth muscle, activating adenylyl cyclases (AC) that catalyze the formation of cAMP from ATP. Recent evidence suggests that cAMP signaling may be highly compartmentized in BSMC such that distinct AC isoforms regulate specific cellular responses such as arborization (Bogard et al. 2011; Bogard et al. 2012). AC isoforms differ in their tissue distribution, cellular localization, regulation, and interactions with other proteins (Ostrom et al. 2012). Human BSMC express predominantly AC2, AC4, and AC6 (Bogard et al. 2011). AC2 is stimulated by GβƔ, PKC, and Raf kinase; it is not significantly inhibited by Gαi or regulated by Ca2+ (Tang and Gilman 1991; Bol et al. 1997; Ding et al. 2004; Federman et al. 1992; Feinstein et al. 1991). Conversely, Gβɣ, PKC, Gαi, and Ca2+ inhibit AC6 (Bayewitch et al. 1998; Lai et al. 1997; Chen and Iyengar 1993; Katsushika et al. 1992). AC3 is not natively expressed in BSMC, but it is of interest in regard to signaling compartments since it falls into a 3rd subgroup of AC’s as defined by primary structure and regulation: Group 1 contains AC1, AC3 and AC8; group 2 contains AC2, AC4, and AC7; and group 3 contains AC5 and AC6 (Patel et al. 2001). AC3 is stimulated by Ca2+/calmodulin (CaM) and PKC and inhibited by CaM kinase (Choi et al. 1992; Jacobowitz et al. 1993; Wei et al. 1996). The differences among AC isoforms give them the potential to signal in unique ways and control distinct responses even when expressed in the same cell.
We hypothesized that activation of different AC isoforms leads to unique cellular responses, including changes in gene expression. In BSMC, we found several cAMP-regulated genes that were differentially regulated by overexpression of AC2 or AC6, while AC3 had little control over induction of these genes. Most notably, cAMP produced by AC2, but not AC6 or AC3, induced expression of IL-6. This specific activation of IL-6 expression appears to occur through both Epac and PKA signaling to yield activation of CRE and AP-1 elements in the IL-6 promoter.
Methods
Cell culture:
Human BSMC purchased from Lonza were grown in smooth muscle basal medium supplemented with the SmGM-2 bullet kit (5% fetal bovine serum, 0.1% insulin, 0.1% human epidermal growth factor, 0.2% human fibroblast growth factor-β, and gentamicin sulfate/amphotericin B; Lonza). In some experiments, dialyzed FBS (Thermo Scientific) was used to reduce induction by uncontrolled stimuli in serum. Cells were kept at 5% CO2 and 37° C. Experiments were performed on cells from passage 5–13. Adenoviral constructs expressing rat AC2, rat AC3, mouse AC6, or lacZ (control) cDNA were used in AC overexpression studies. The titer of AC virus was chosen to give similar global cAMP levels in response to 1 μM Fsk. Cells were infected 18–24 h before treatment.
Materials:
Fsk, Iso, ATPɣS, AVP, PGD2, glucagon, NECA, CGRP, and substance P were purchased from Sigma; 8-CPT-2Me-cAMP, GF 109203X, SB 202190, and wortmannin from Tocris, and butaprost from Cayman. IL-6 promoter luciferase constructs were purchased from the Belgian Coordinated Collections of Micro-organisms/LMBP; LMBP acquisition numbers 4495, 4496, 4498, 4499, 4500 (Vanden Berghe et al. 1998; Plaisance et al. 1997).
cAMP-responsive gene expression and GPCR gene expression:
Cells were lysed and RNA was isolated using RNeasy kit with on-column DNase step (Qiagen). RNA purity and yield were determined with Nanodrop spectrophotometer. 1 μg RNA was reverse transcribed using RT2 first strand kit (SABioscience). cDNA from a single sample was combined with RT2 SYBR Green Master Mix (SABioscience) and distributed among wells of a multiwell plate containing gene specific and control primers on Human cAMP/Ca2+ PathwayFinder or Human G Protein Coupled Receptors 384HT RT2 Profiler™ PCR Array (SABioscience). The crossing point (CP) was determined by the second derivative maximum algorithm on Roche Lightcycler 480. Melt curve analysis was used to exclude any gene whose CP may have been artificially reduced by multiple amplification products. Fold change was calculated by ΔΔCP method.
Quantitation of IL-6 expression:
IL-6 mRNA was quantified in cells following treatment with the indicated drug or vehicle for 1 h (peak time determined from time-course studies). RNA was isolated as described in gene expression studies above. 1 μg RNA was reverse transcribed using Transcriptor First Strand cDNA Synthesis Kit (Roche) and oligo (dT)18 primer. PCR was carried out on Roche Lightcycler 480 and amplification detected by SYBR green (KAPA). Single PCR products were confirmed by melt curve analysis. Fold regulation was calculated by ΔΔCP method with normalization to RPL13A housekeeping gene.
IL-6 Forward: GAC AGC CACTCA CCT CTT CA
IL-6 Reverse: AGT GCCTCT TTG CTG CTT TC
In other studies, IL-6 protein in cell culture media was quantified using a sandwich ELISA. Cells were treated with the indicated drug or vehicle for 24 h (peak time determined from time-course studies) then culture media was collected. ELISA were used to quantify IL-6 protein in each sample according to manufacturer’s instructions (eBioscience). Absorbance was quantified using a Synergy HT (Biotek) plate reading spectrophotometer.
cAMP assays:
Cells were washed three times with serum- and NaHCO3-free Dulbecco’s Modified Eagle’s medium (DMEM) supplemented with 20 mM HEPES, pH 7.4 (DMEH). After equilibration at 37°C for 30 min, cells were pretreated with 0.2 mM IBMX (a broadly specific PDE inhibitor) then exposed to the indicated drug for 10 min. Assay medium was aspirated and 150 μL 5% trichloroacetic acid was added to each well to terminate the reaction. cAMP content of the lysis buffer extract was quantified using the cAMP EIA Kit (Cayman Chemical) using the manufacturer’s acetylation protocol.
pIL6 Luciferase assays:
BSMC were plated 30,000 cells per well in 12-well plates. 18–24 h after plating, each well was transfected with 1.8 μg plasmid expressing the human IL-6 promoter (wild type or containing promoter site mutations) driving firefly luciferase. Cells were co-transfected with 0.4 μg Renilla luciferase intended as an internal control constitutively expressed via the thymidine kinase promoter. However, Fsk treatment affected Renilla luciferase expression, so it could not be used for normalization in our studies. All transfections used the CalPhos (Clontech) calcium phosphate kit. Experiments were begun 48 h post-transfection. Following treatment with the indicated drugs for 6 h, cells were scraped in 250 μL passive lysis buffer and assayed using the Dual Luciferase Reporter Assay System (Promega). Luminescence was measured with a TD-20/20 luminometer (Turner Designs).
Data Analysis and Statistics:
Data are presented as the mean ± SEM. Statistical comparisons (t tests and one-way analysis of variance) were performed and graphics were generated using GraphPad Prism 5.0f (GraphPad Software Inc., San Diego, CA).
Results
Individual AC isoforms differentially regulate gene expression in BSMC
Since most cells express multiple AC isoforms, we were interested in whether different AC’s mediate different cellular responses. We used adenoviral vectors to overexpress AC2, AC3, AC6, or lacZ (control) in BSMC. Stimulation with 1 μM Fsk significantly increased cAMP accumulation in all cells, as measured by EIA in the presence of broad-spectrum PFE inhibitor IBMX (Fig. 1). Overexpression of AC did not significantly increase basal or Fsk stimulated cAMP accumulation, but downstream responses, including gene expression, were modulated by AC overexpression (Fig. 2a). To investigate whether cAMP signaling by individual AC isoforms has unique effects on gene expression in BSMC, we used PCR arrays to examine expression of 84 cAMP and Ca2+-sensitive genes. We looked for changes resulting from overexpression and activation of specific AC isoforms. Adenoviral vectors were used to overexpress AC2, AC3, AC6, or lacZ, and RNA was isolated following 24 h exposure to 1 μM Fsk. Fsk altered the expression of many of these genes compared to vehicle in control BSMC, but we focused on genes that were differentially regulated with overexpression of AC isoforms by graphing mRNA expression as fold change compared to the lacZ condition (Supplementary Table 1 and Fig. 2a). A 3-fold or greater change was used to distinguish genes that were up-regulated or down-regulated upon AC overexpression, but smaller changes could be physiologically significant. Overexpression of AC3 did not cause a 3-fold or greater change compared to control cells in any of the genes on the array. AC2 and AC6 overexpression could enhance or dampen Fsk induction and had differing effects depending on the AC isoform and the gene. A total of 13 genes were altered by AC overexpression, and a subset was chosen to highlight the diversity in responses (Fig. 2a). Complete array data is presented in Supplementary Table 1. Fsk-mediated expression of Amphiregulin (AREG) was augmented to a greater extent by AC6 overexpression than by AC2. AC2 overexpression reduced the expression of Secretogranin II (SCG2), while AC6 overexpression reduced the expression of cyclin D1 (CCND1). Fsk-mediated expression of Interleukin 6 (IL-6) was enhanced only by AC2 overexpression and somatostatin (SST) was enhanced only by AC6 overexpression. cAMP produced by AC2 and AC6, but not AC3, were able to signal to the nucleus where they had unique effects on gene expression. These data indicate that different AC isoforms generate signals that are interpreted in distinct, even contrasting, ways in the nucleus.
Fig. 1.
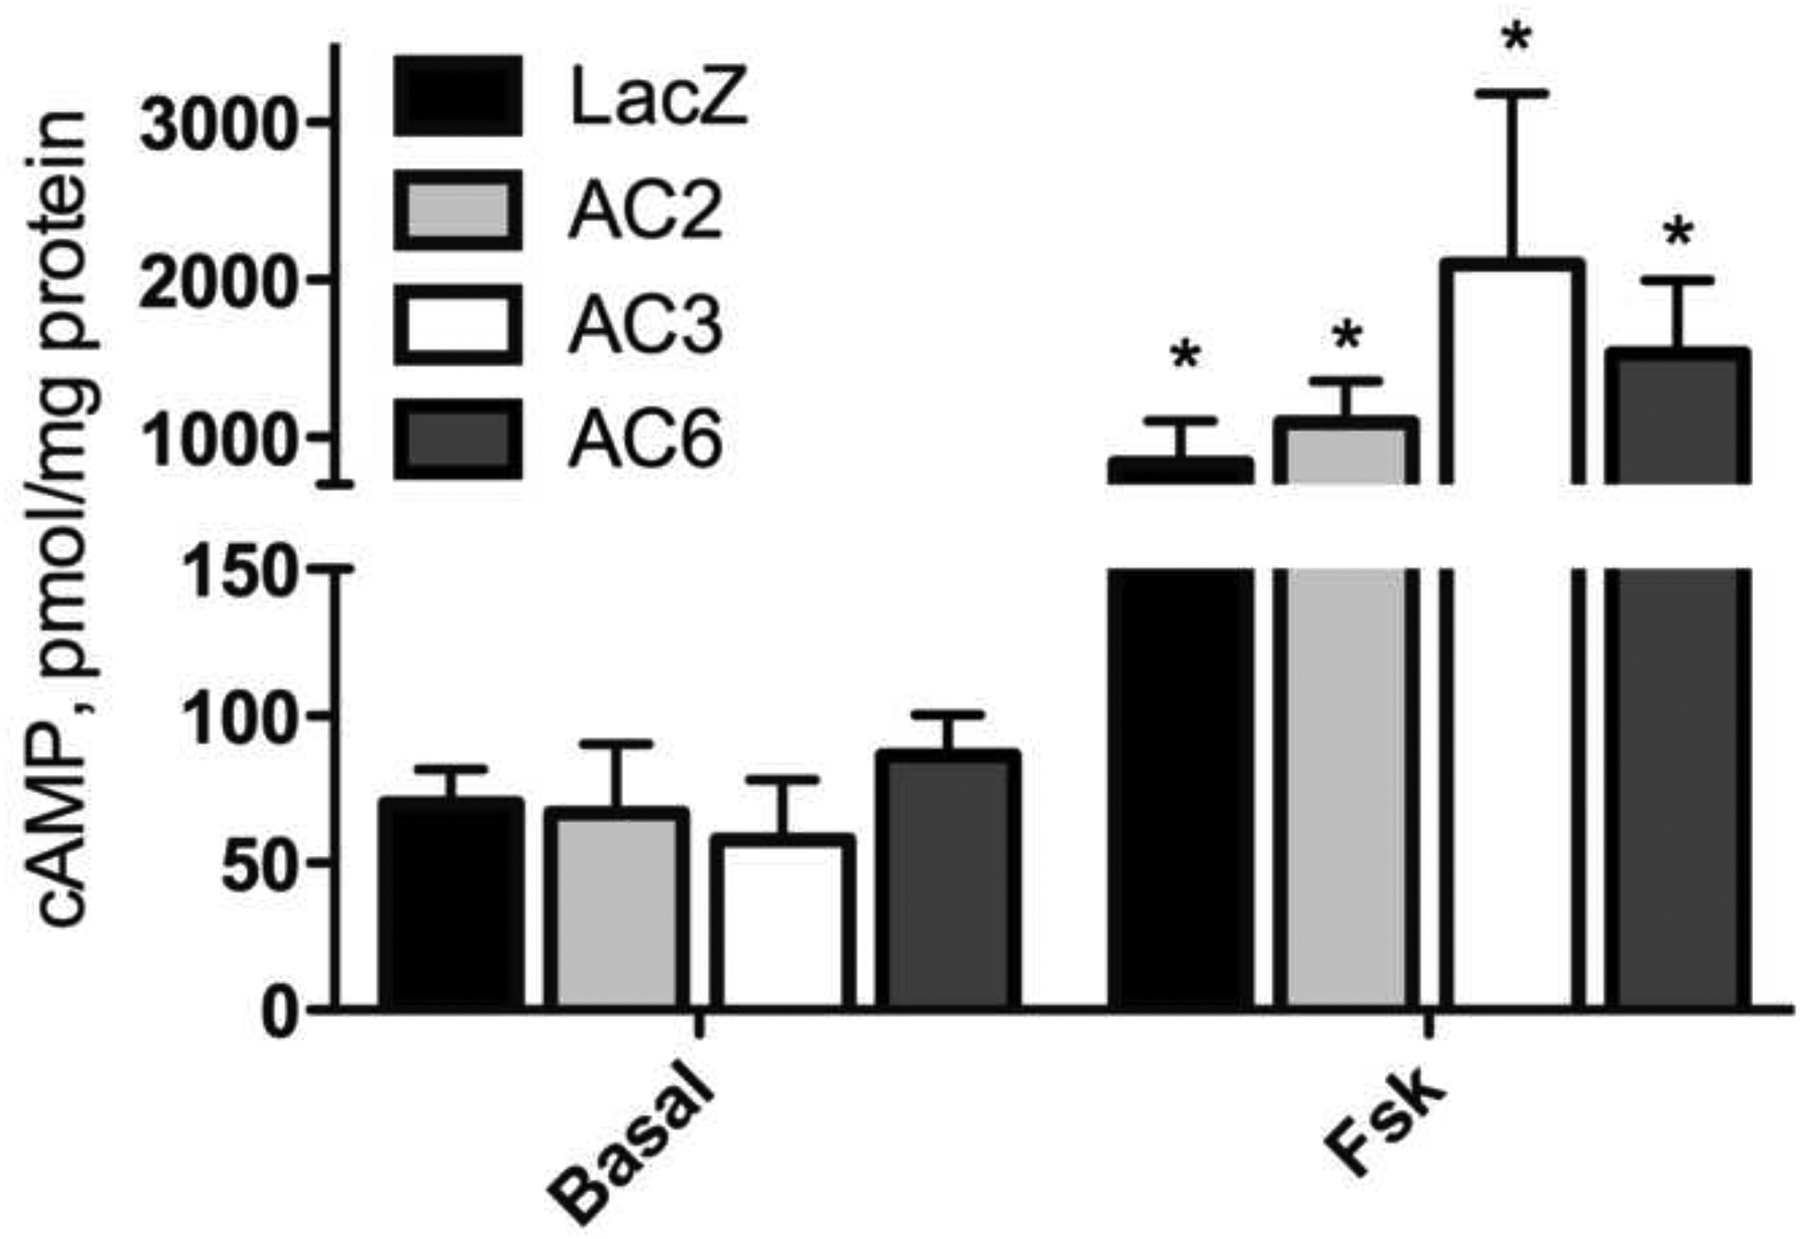
cAMP accumulation in control and AC overexpressing BSMC. cAMP EIA’s were used to measure cAMP following 10 min exposure to 1 μM Fsk or vehicle in the presence of broad-spectrum PDE inhibitor IBMX. mean ± SEM, n=3. * indicates p<.05 compared to basal.
Fig. 2.
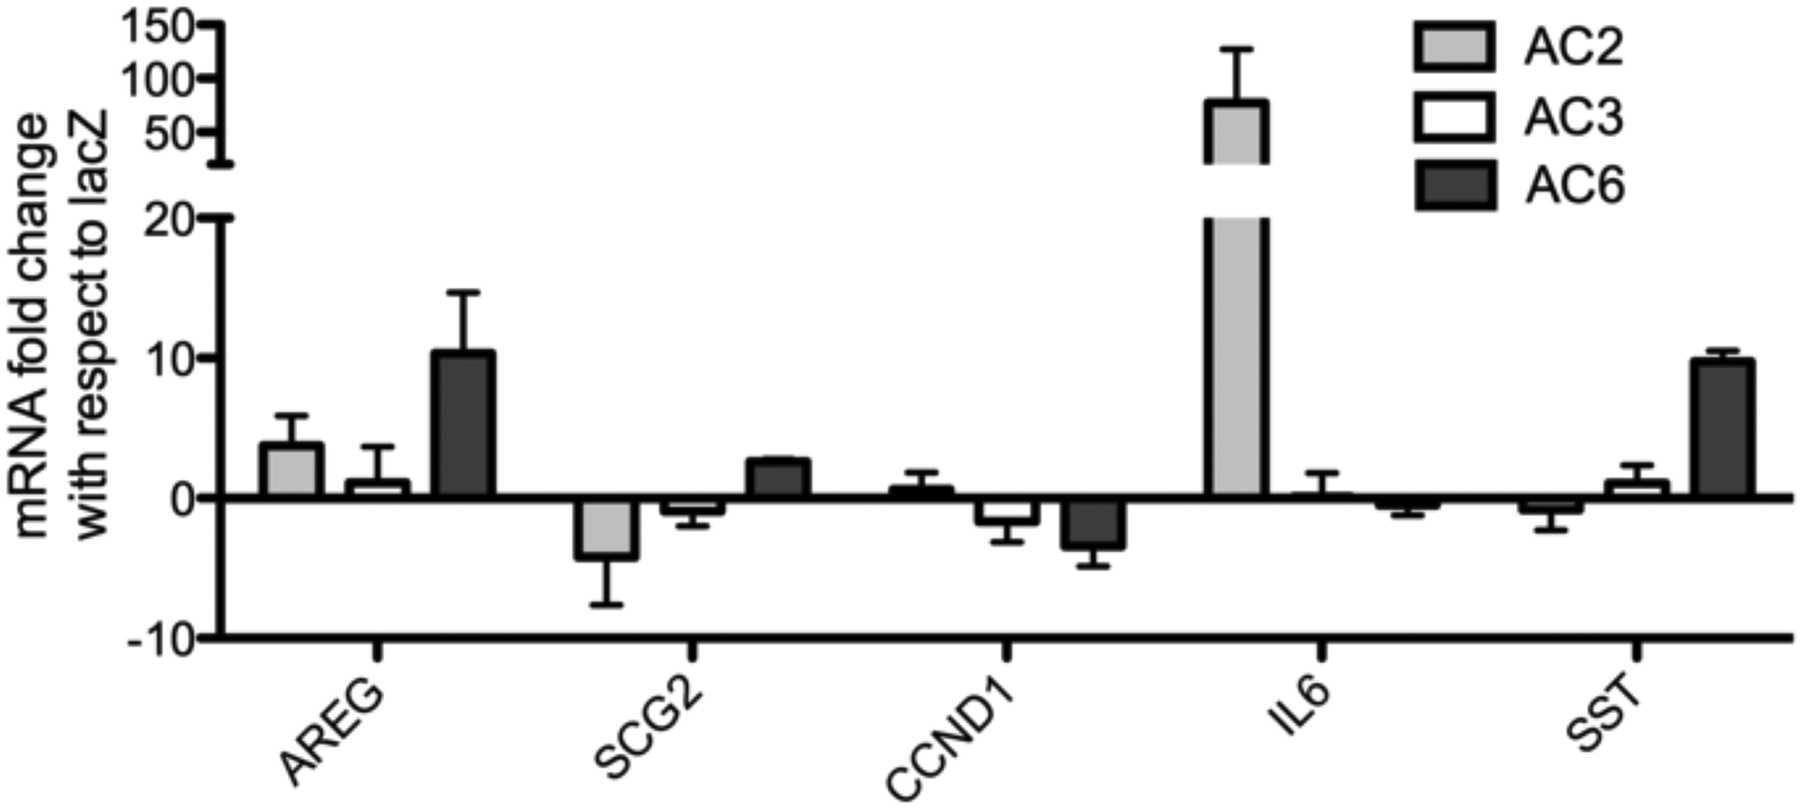
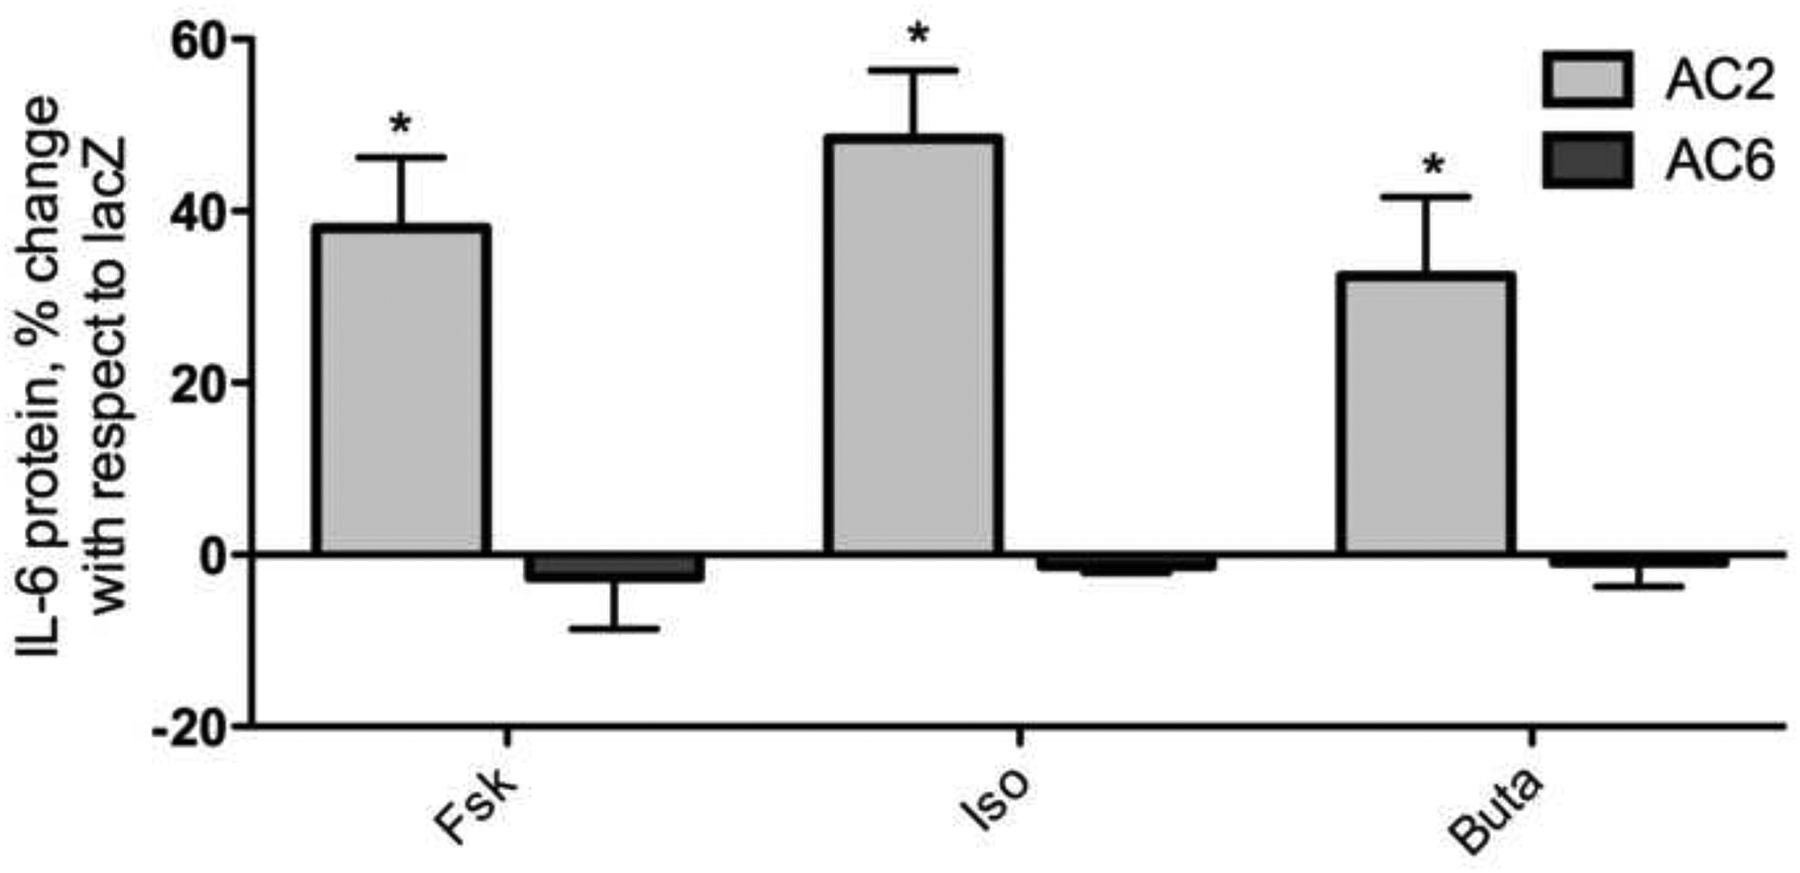
a: Fsk-induced gene regulation in AC overexpressing BSMC compared to control BSMC. RT2 q PCR arrays (SA Biosciences) were used to measure mRNA levels following 24 h treatment with 1μM Fsk. mRNA levels of AC overexpressing, Fsk-treated cells are expressed as fold change with respect to lacZ (control), Fsk- treated. Amphiregulin (AREG), Secretogranin II (SCG2), Cyclin D1 (CCND1), Interleukin 6 (IL-6), Somatostatin (SST). Data are presented as fold change over lacZ, mean ± SEM, n=3. b: IL-6 protein production in AC2 or AC6 overexpressing BSMC. IL-6 protein in cell culture media was measured by ELISA following 24 h treatment with 1 μM of the indicated drug. Data are presented as % change with respect to lacZ, mean ± SEM, n=3. * indicates p<.05 compared to lacZ
AC2 overexpression enhances Fsk- and receptor-mediated induction of IL-6 gene expression
The AC2-specific effect on regulation of IL-6 expression and IL-6’s role in asthma pathogenesis caused us to look further into how AC2-derived cAMP is uniquely able to regulate IL-6. Fsk directly activates all adenylyl cyclases natively expressed in BSMC, yet only AC2 overexpression increased IL-6 mRNA levels compared to control cells. To determine if the AC2 enhancement of IL-6 mRNA expression translates to increased protein, we measured secreted IL-6 in cell culture media using an ELISA. AC2 overexpression increased IL-6 produced in response to Fsk by 38.01% compared to lacZ, but AC6 overexpression did not enhance Fsk stimulated IL-6 production (Fig. 2b). Again, the results are graphed with respect to lacZ to emphasize the effect of overexpressing each AC isoform.
We hypothesized that co-localization of receptors, cyclases, and downstream effectors create distinct cAMP signaling compartments in BSMC. We have previously shown that AC2 and prostaglandin E2 receptors (EP2R) are excluded from lipid rafts in BSMC, and that β2AR are predominately localized to lipid rafts where they co-localize with AC6 (Bogard et al. 2011). Thus, we stimulated β2AR with isoproterenol (Iso) or EP2R with butaprost (Buta) for 24 h and measured IL-6 secreted into culture supernatant by ELISA. Both Iso and Buta increased IL-6 production, and these responses were enhanced by AC2 overexpression but not AC6 overexpression (Fig. 2b). Overexpression of AC2 enhanced Iso-stimulated IL-6 production by 48.44% and Buta-stimulated response by 32.41%. AC6 overexpression did not enhance IL-6 production over control cells in response to any of the stimuli we tested. Therefore, non-raft AC2 seems to have preferential control over IL-6 expression, and can be stimulated by both EP2R and β2AR. β2AR have been described as being lipid raft localized but appear to translocate into non-raft domains upon activation (Ostrom et al. 2001; Rybin et al. 2000).
Only some GPCR are associated with IL-6 induction
Having found that both β2AR and EP2R were linked to IL-6 expression in AC2 overexpressing BSMC, we wondered if there are other Gαs -coupled receptors that are able to stimulate IL-6 expression in BSMC. Because cells can express many receptors, we first wanted to identify the GPCR expressed in BSMC. We used a 384-well qRT-PCR array to look for expression of mRNA encoding many different GPCR (Supplementary Table 2). Following amplification, SYBR green melt curves were analyzed, and genes with more than 1 peak were excluded due to the ambiguity associated with multiple products. It is important to note that the PCR array data are qualitative in this context. Since cDNA for each receptor was amplified with different primers resulting in products of varying lengths, receptors with lower CP values are not necessarily expressed at higher levels. The PCR array served as a starting point to discover all the GPCR expressed by BSMC, but ultimately other approaches must be used to confirm functional receptor expression.
mRNA was detected (CP <35) for 227 of the receptors examined, while mRNA was not detected (CP >35) for 81 receptors (Supplementary Table 2). We chose a subset of the receptors with readily detectible mRNA and measured cAMP and IL-6 production following stimulation with their receptor-specific agonists. IL-6 protein in culture media increased compared to vehicle following 24 h treatment with a purinergic receptor agonist, ATPƔS, or adenosine receptor agonist, 5’-N-ethylcarboxamidoadenosine (NECA, Fig. 3a). Arginine vasopressin (AVP), BRL 37344 (β3AR-selective agonist), α-calcitonin gene related peptide (α-CGRP), glucagon, prostaglandin D2 (PGD2), and substance P did not significantly increase IL-6 secretion compared to vehicle. We also tested these agonists for their ability to stimulate cAMP production in BSMC. Cells were treated with these same GPCR-selective agonists for 10 min in the presence of a broad-spectrum phosphodiesterase (PDE) inhibitor (0.2 mM IBMX). ATPƔS and NECA, agonists that increased IL-6 secretion, did not significantly increase global cAMP levels (Fig. 3b). The cAMP response to NECA may be blunted by antagonism of adenosine receptors by IBMX (Daly et al. 1987). BRL 37344 and glucagon, agonists that did not increase IL-6 production, induced small but non-significant cAMP responses. These data may indicate that not all GPCR-mediated cAMP responses are capable of eliciting IL-6 production and that cAMP may not be the only signal required to elicit the response.
Fig. 3.
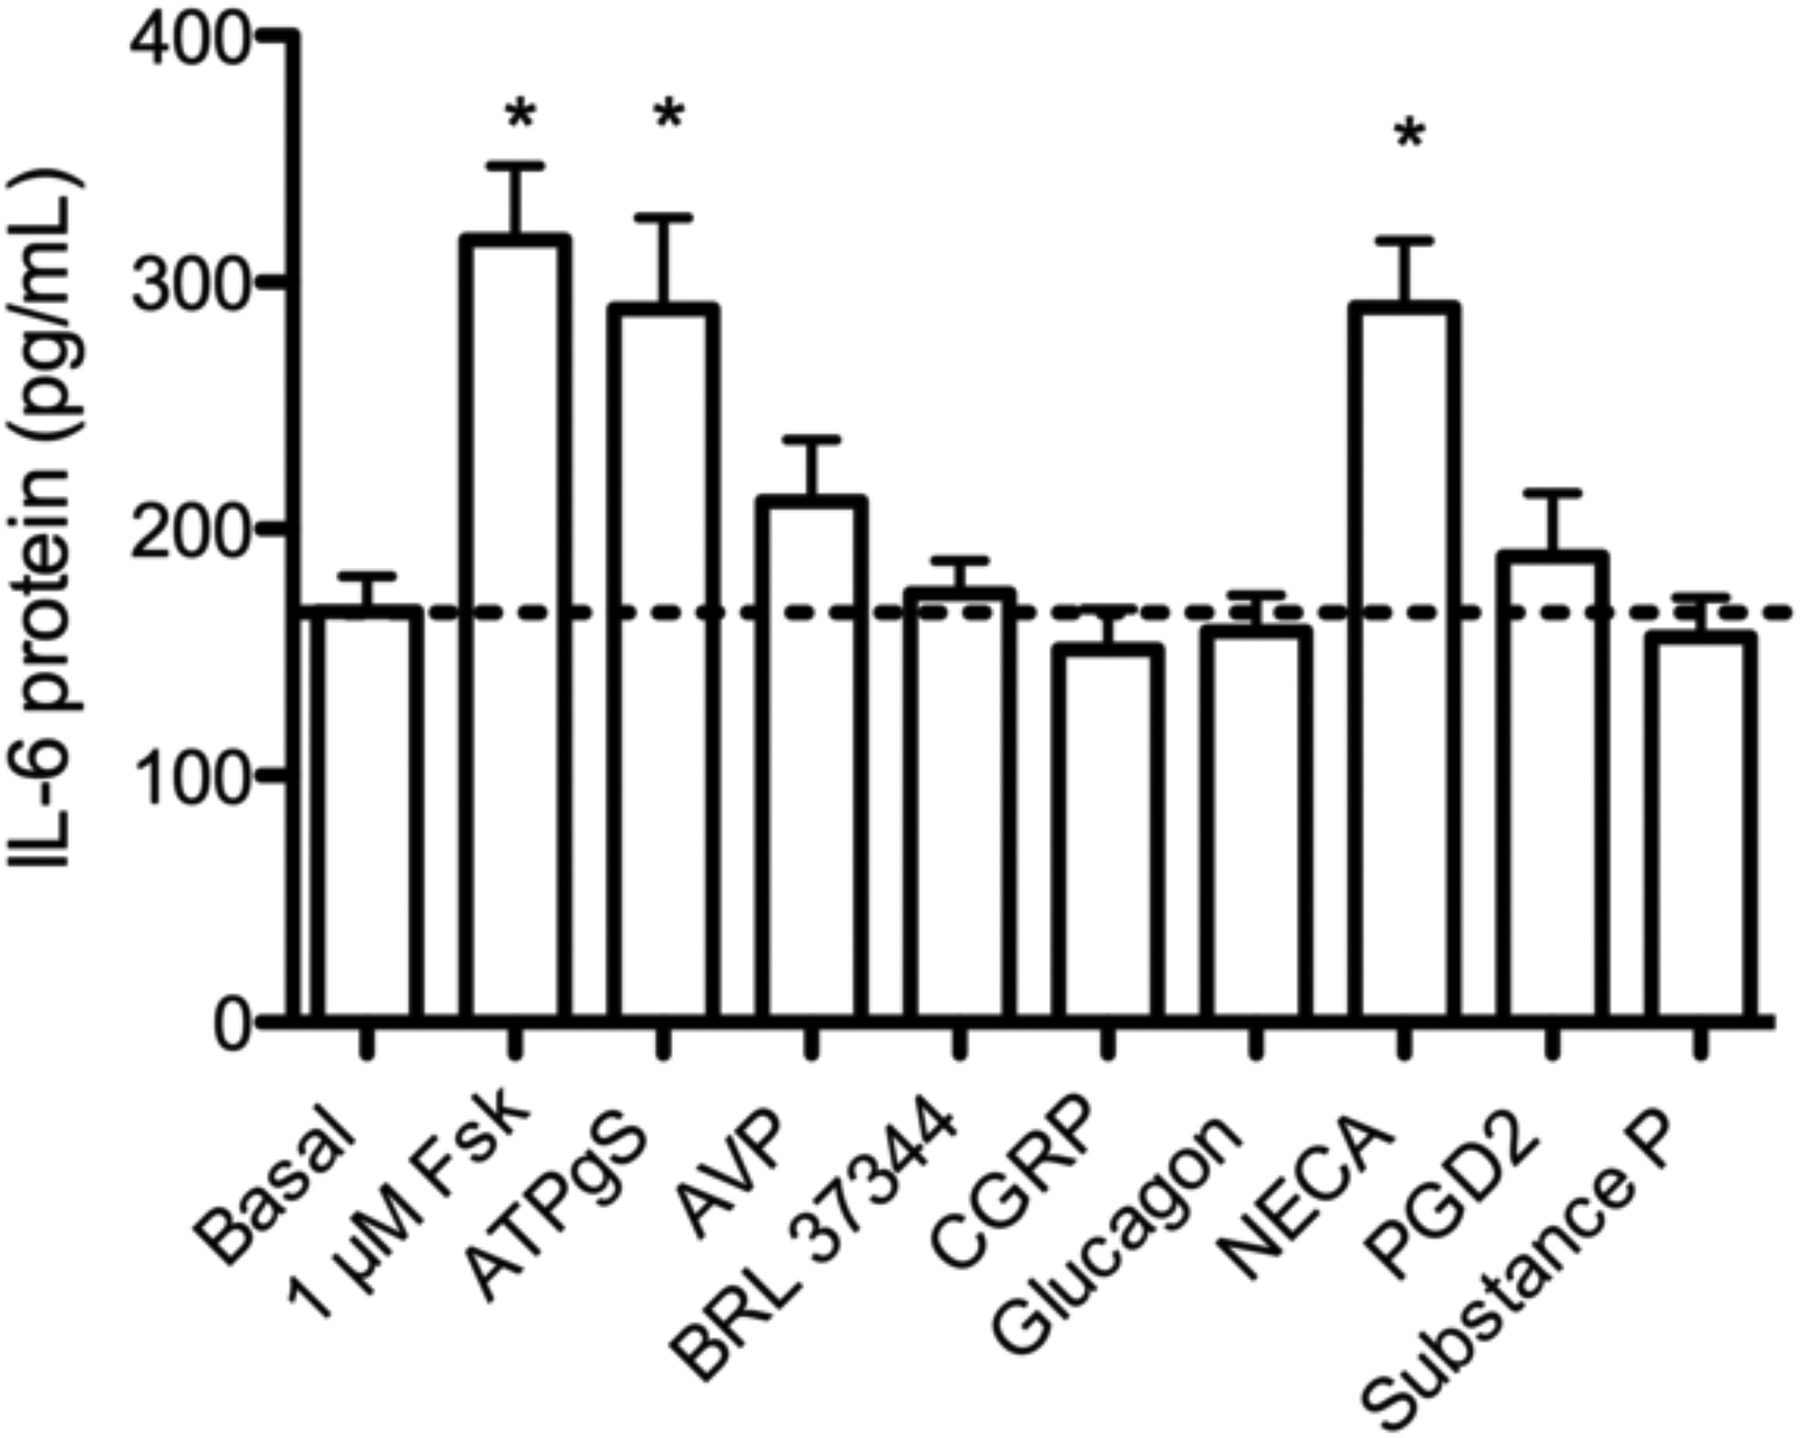
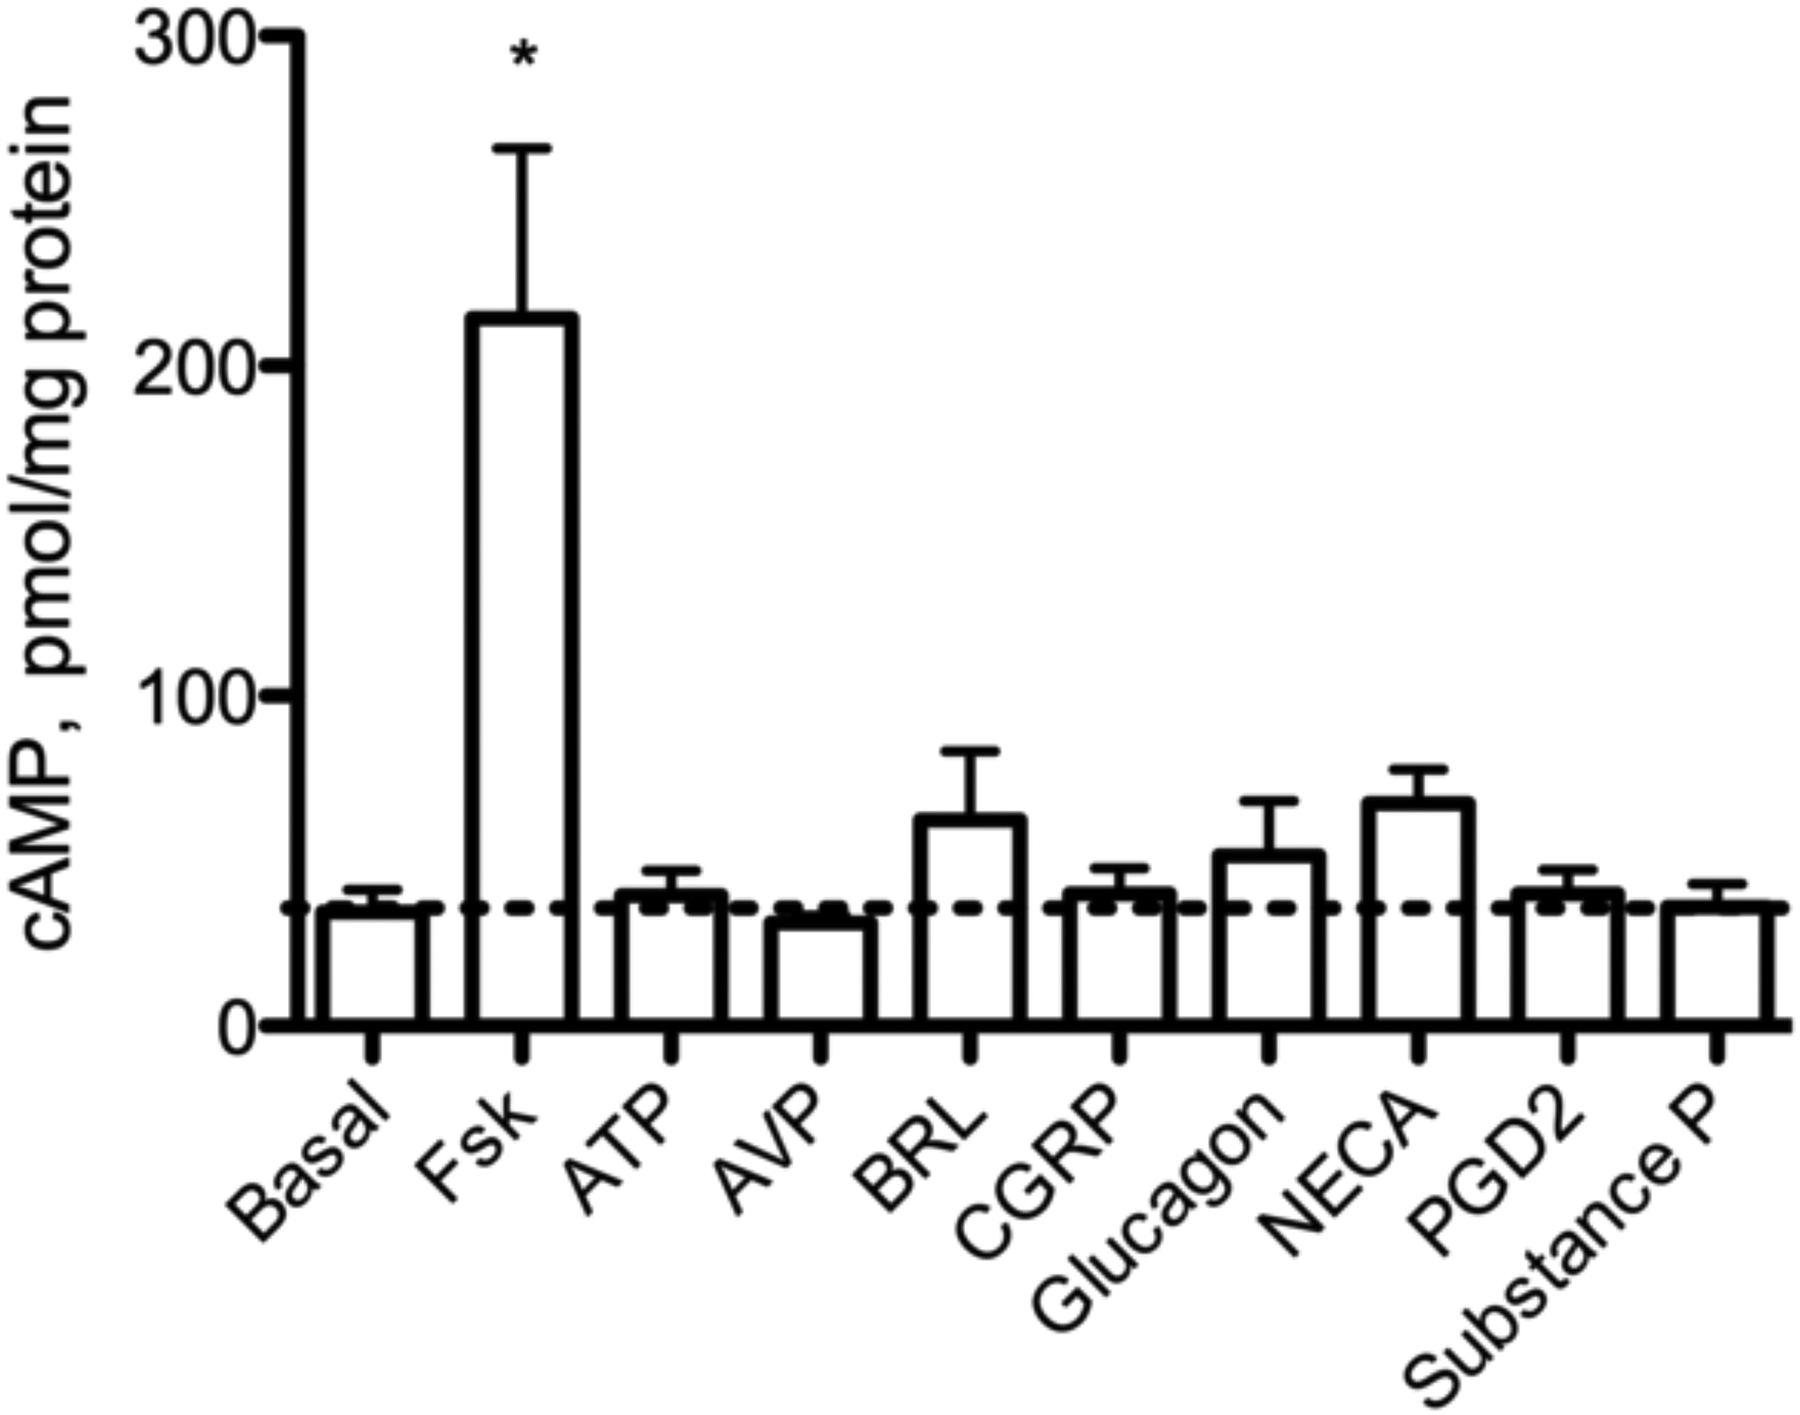
a: IL-6 protein production in response to Gαs-coupled receptor agonists. BSMC were treated with the indicated drug for 24 h, and IL-6 secreted into culture media was measured by ELISA. 1μM Fsk, AVP, CGRP, glucagon, PGD2, substance P; 10 μM ATPƔS, BRL 37344, NECA. cAMP measured by EIA. b: cAMP production in response to Gαs – coupled receptor agonists. BSMC were pretreated with 0.2 mM IBMX prior to 10 min agonist exposure: 1μM Fsk, AVP, CGRP, glucagon, PGD2, substance P; or 10 μM ATPƔS, BRL 37344, NECA. cAMP was measured by EIA. Dashed line represents basal level. Mean ± SEM, n=3–4. * indicates p<.05 compared to vehicle
Global cAMP levels are not directly correlated to IL-6 induction
Since levels of IL-6 production do not appear to directly correlate with global cAMP levels, we decided to further examine the correlation between cAMP and IL-6 using agonists for β2AR and EP2R, receptors whose expression in BSMC and ability to stimulate IL-6 in other cell types have been better described (Bogard et al. 2011; Raychaudhuri et al. 2010; Chen et al. 2012). Simultaneous Gαs and Fsk stimulation produces a synergistic cAMP response in many cell types that can aid in determining the role of this signaling pathway (Insel and Ostrom 2003; Daly et al. 1982; Darfler et al. 1982; Sutkowski et al. 1994; Ostrom et al. 2000). We used Iso and Buta alone or with concurrent treatment with Fsk (0.1 μM) to determine if increased cAMP always translates to increased IL-6 production. Lower concentrations of each drug were used in order to observe synergistic effects. Addition of Fsk at the time of agonist stimulation increased cAMP production over agonist alone but increased intra-experiment variability (Fig. 4a). Thus, BSMC express a moderate Gαs-Fsk synergistic effect. Using these same conditions, we found absolutely no increase in IL-6 production (Fig. 4b). Therefore, higher cAMP levels may not translate to increased IL-6 expression, implying that other signaling pathways could be involved.
Fig. 4.
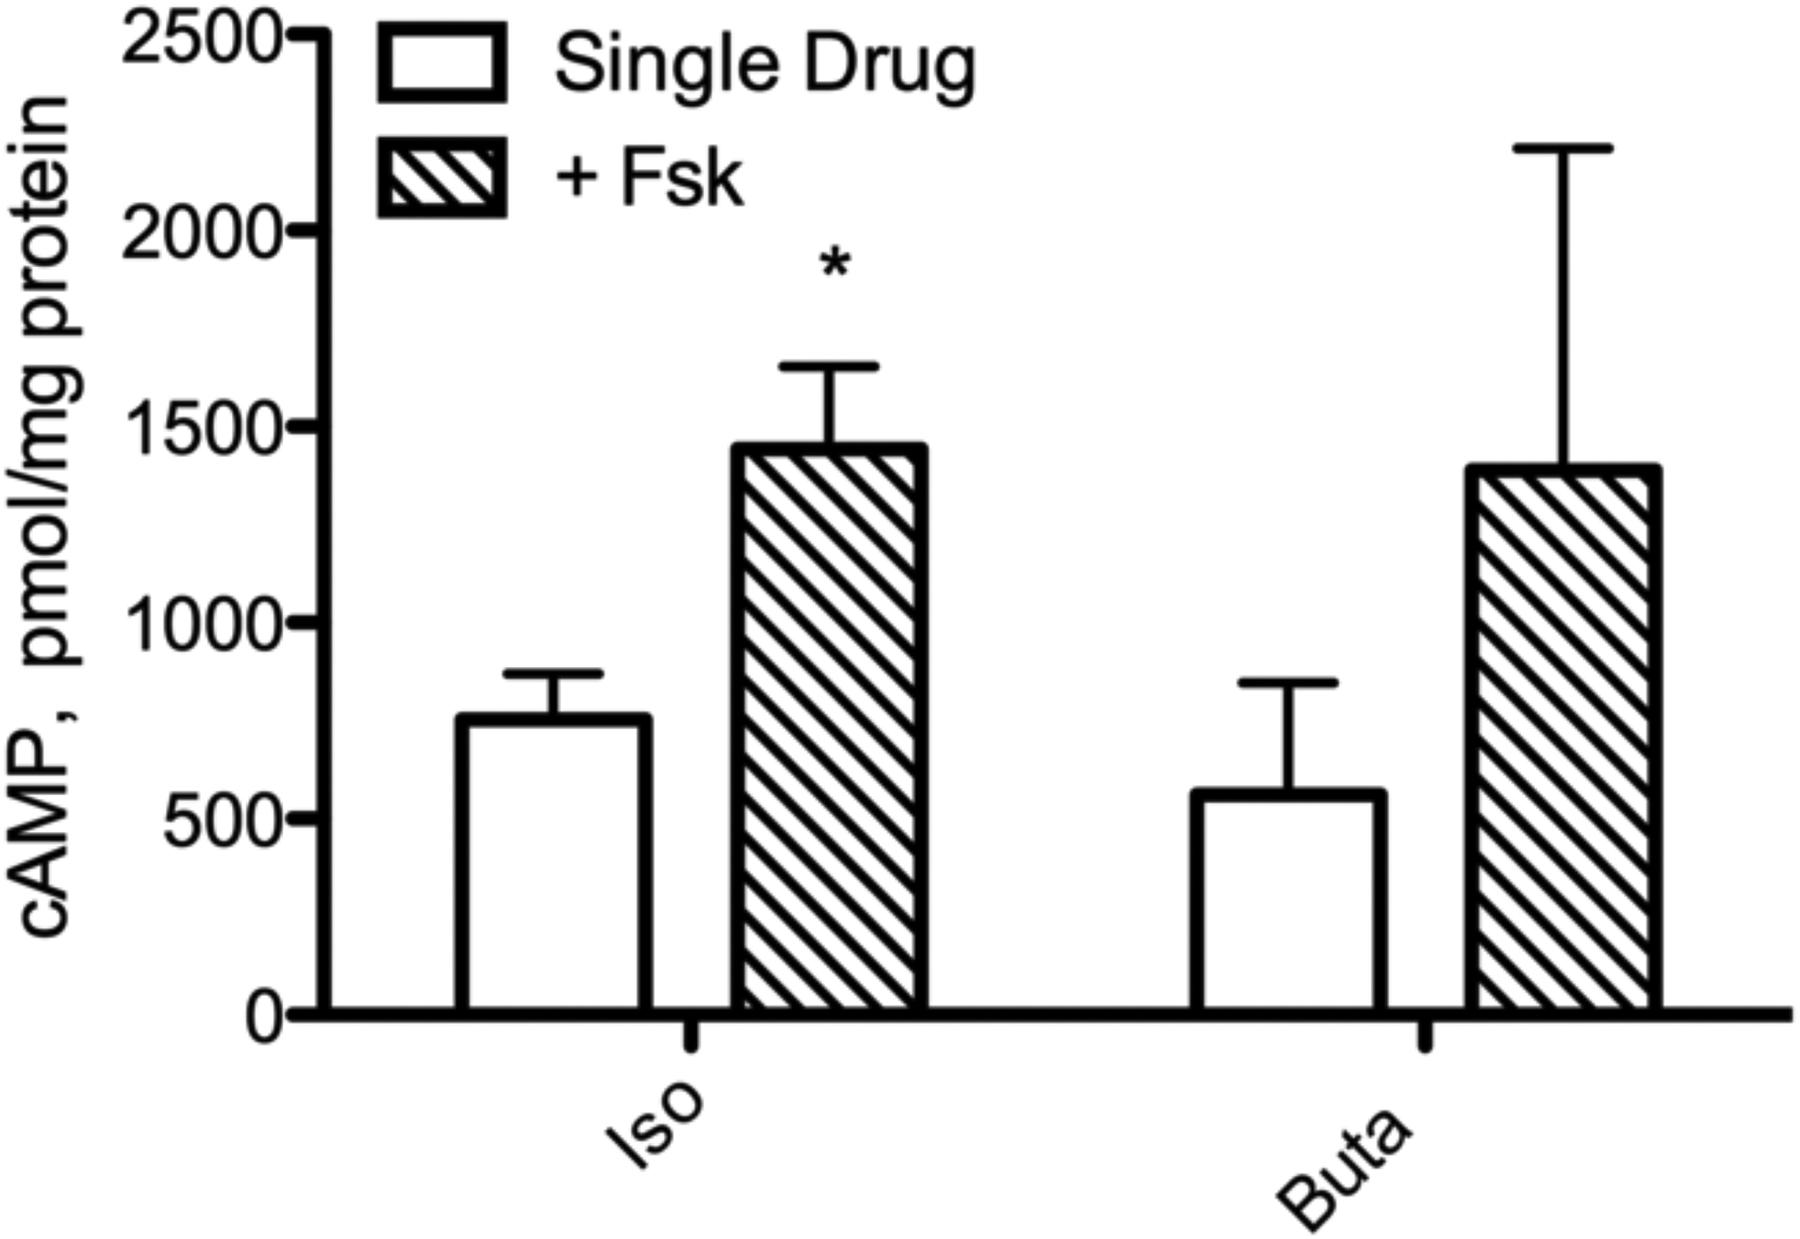
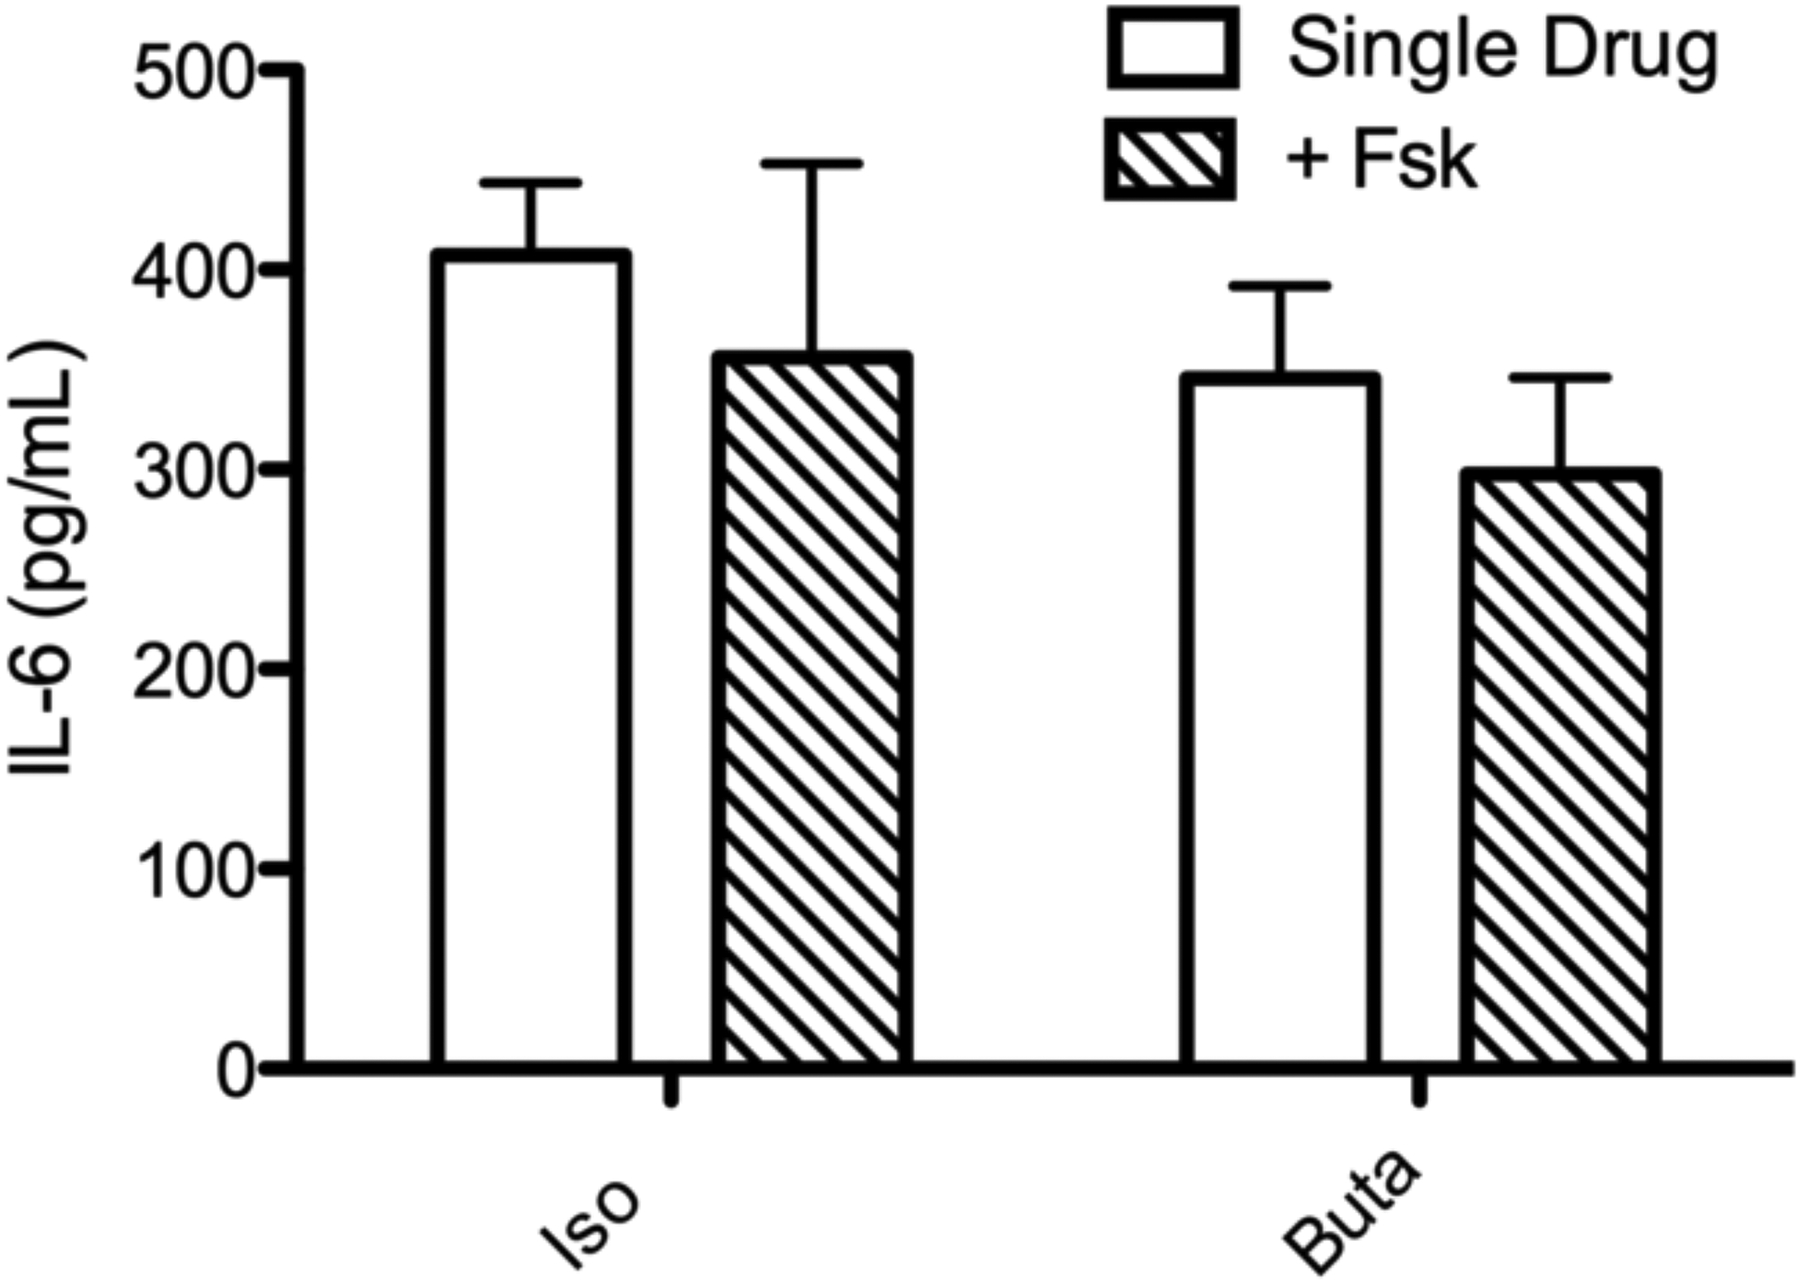
cAMP and IL-6 production in BSMC by GPCR agonists alone or with concurrent Fsk treatment. a: Cells were treated with 0.1 μM of the indicated drug with or without concurrent treatment with 0.1 μM Fsk for 10 min in the presence of 0.2 mM IBMX. cAMP was measured by EIA.. b: Cells were treated with 0.1 μM of the indicated drug with or without concurrent treatment with 0.1 μM Fsk. IL-6 in culture media was measured by ELISA following 24 h drug treatment. Mean ± SEM, n=3 * indicates p<.05 compared to single drug
We next sought to determine which downstream effectors are associated with AC2-mediated induction of IL-6 expression. PKA and Epac are the effectors of intracellular cAMP. We used selective cAMP analogs to investigate the role of these two pathways in regulation of IL-6 expression. Cells were cultured in medium containing dialyzed FBS to reduce other stimuli present in serum. 8-CPT-2Me-cAMP, the Epac selective analog, did not significantly increase IL-6 compared to vehicle at concentrations ranging from 1 μM to 100 μM (Fig. 5). The PKA selective analog 6-Bnz-cAMP stimulated a significant increase in IL-6 production when cells were exposed to 100 μM. Treatment with the non-selective cAMP analog 8-Br-cAMP that acts through both PKA and Epac resulted in significantly greater IL-6 production than analogs acting through PKA or Epac alone. PKA appears to play a predominant role in cAMP mediated induction of IL-6. Activation of Epac alone did not significantly increase IL-6 production, but Epac signaling appears to synergize with PKA signaling to contribute to IL-6 induction.
Fig. 5.
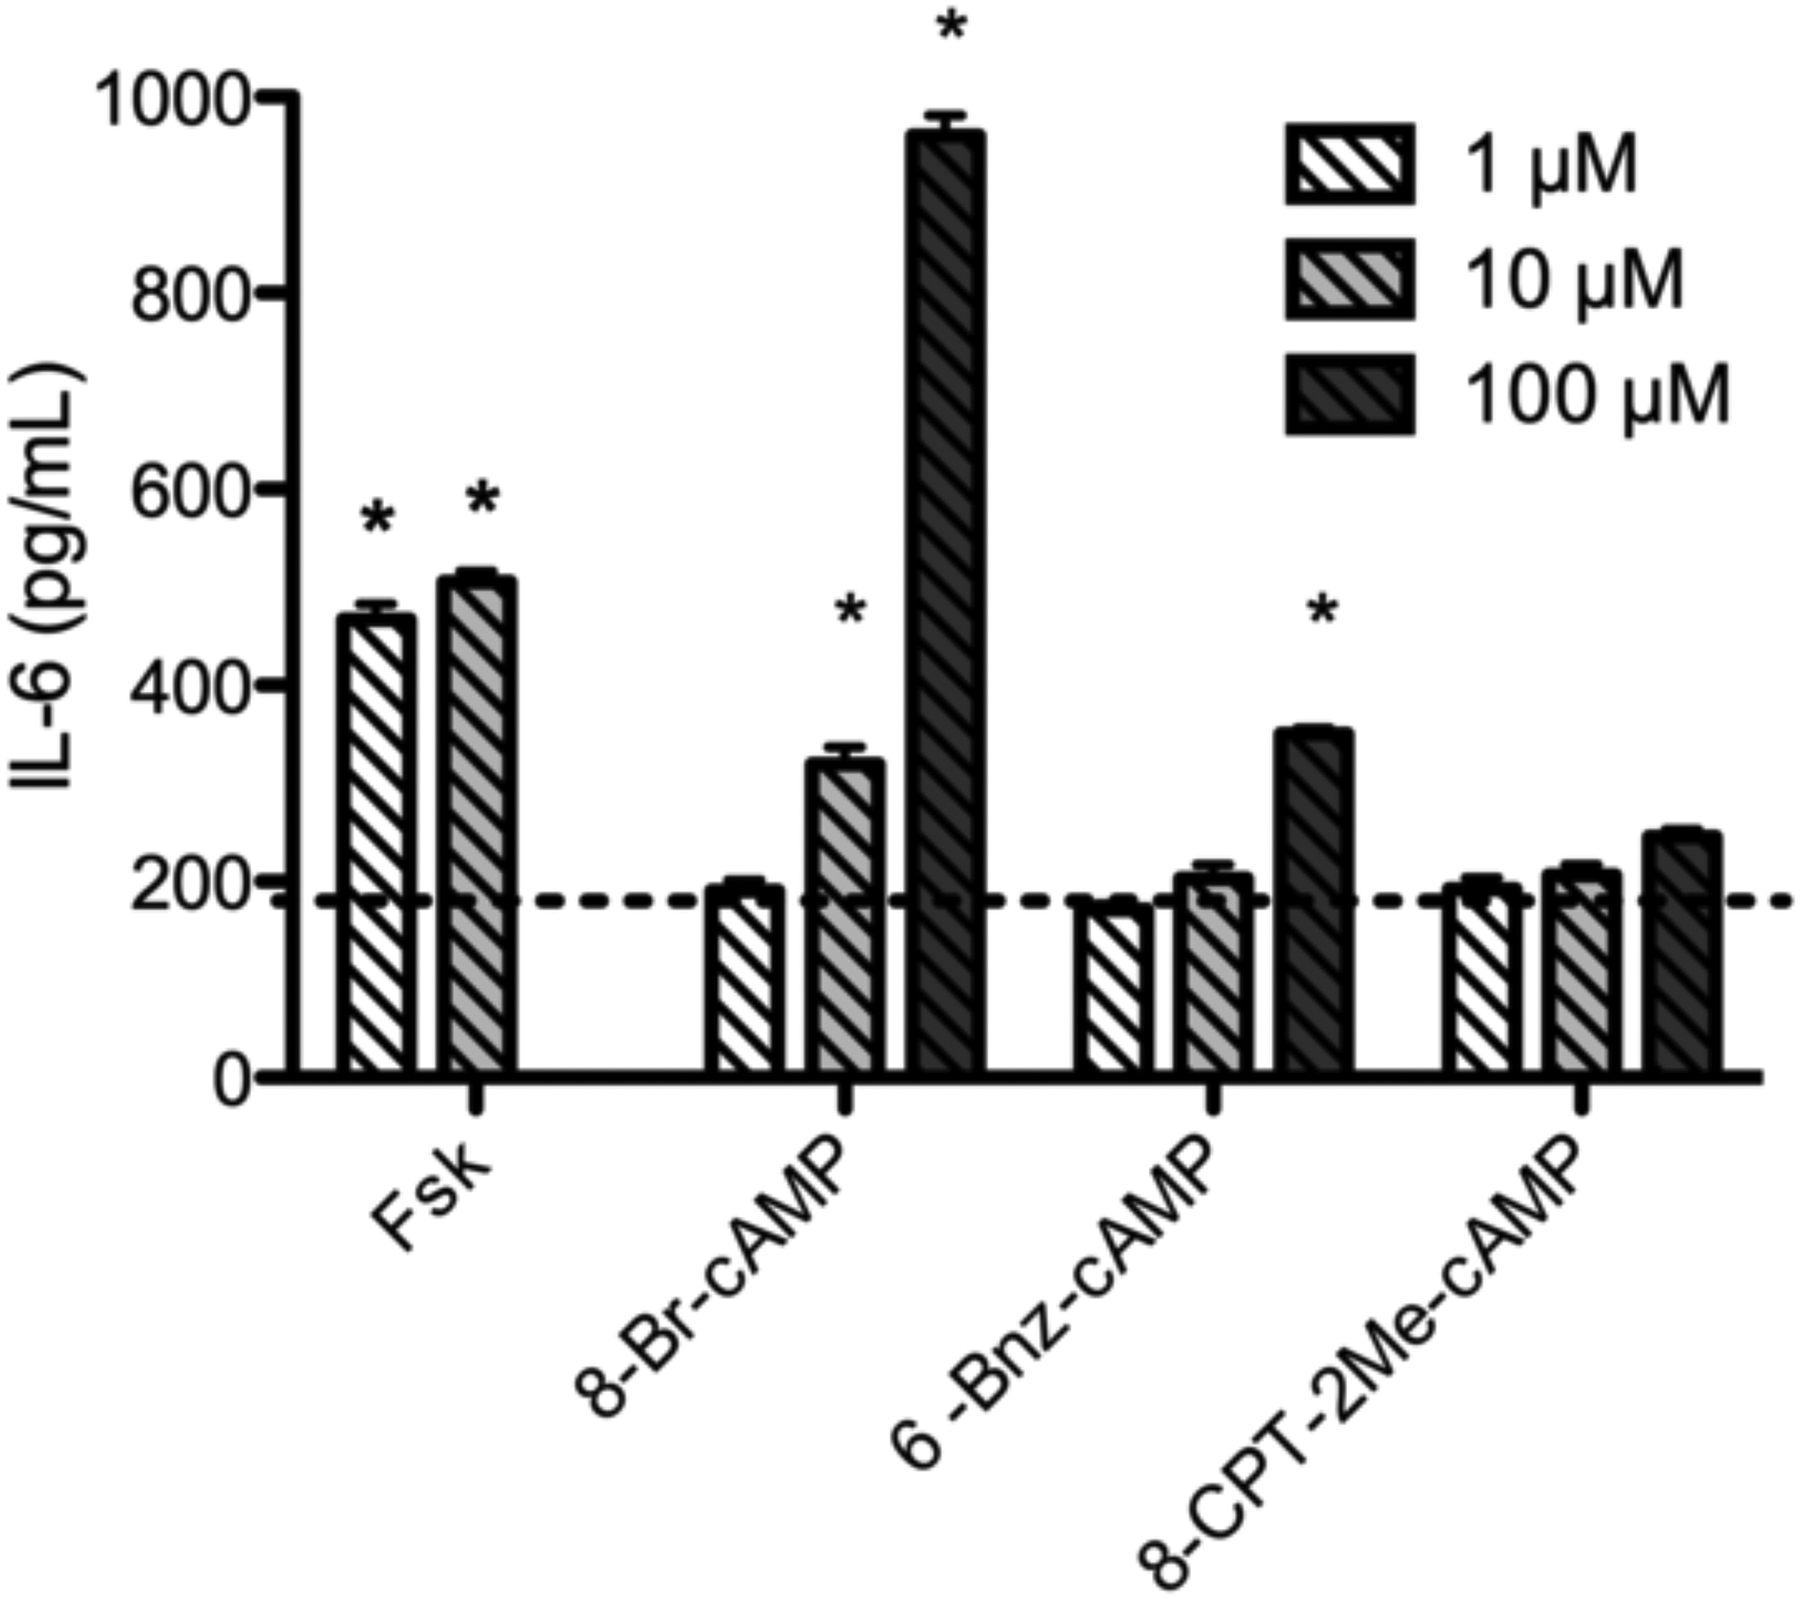
IL-6 protein production in response to non-selective, Epac selective, or PKA selective cAMP analogs. BSMC were treated with the indicated concentration of either 8-Br-cAMP (non-selective), 8-CPT-2Me-cAMP (Epac selective), or 6-Bnz-cAMP (PKA selective) for 24 h and IL-6 in culture supernatant was measured by ELISA. Dashed line represents vehicle. Mean ± SEM, n=3–4 * indicates p<.05 compared to vehicle
Fsk-induced IL-6 expression is not affected by inhibition of PKC, p38 MAPK, or PI3K
cAMP can induce IL-6 through various signaling pathways, with differences among cell types. In astrocytes, Prostaglandin E2 (PGE2) enhances IL-6 expression through EP4-like receptors and p38 mitogen-activated protein kinase (p38 MAPK) and protein kinase C (PKC) pathways (Fiebich et al. 2001). In chondrocytes the same stimulus regulates IL-6 expression through PKA and phosphatidylinositol 3-kinase (PI3K) pathways (Wang et al. 2010). IL-6 induction by βAR activation in neonatal mouse cardiac fibroblasts is Epac-dependent and involves PKCδ and p38 MAPK signaling pathways (Chen et al. 2012). Since it is clear that pathways mediating cAMP induction of IL-6 are cell-type specific, we sought to determine which signaling intermediates are required for Fsk-induced IL-6 expression in BSMC.
We used inhibitors of PKC (GF 109203X), p38 MAP kinase (SB 202190), or PI3K (wortmanin) to probe for the role of these signaling pathways. Cells were pretreated for 1 h with 10 μM of each inhibitor, concentrations that significantly inhibited IL-6 expression in other cell types (Fiebich et al. 2001; Wang et al. 2010). Following inhibitor pretreatment, cells were exposed to 1 μM Fsk for 1 h, and IL-6 mRNA expression was measured by qRT-PCR. None of the inhibitors tested had a significant inhibitory effect on Fsk-stimulated IL-6 expression (Fig. 6). In fact, GF 109203X or wortmanin pretreatment tended to increase IL-6 production compared to Fsk alone (not significant,). Since nonspecific effects could occur at high concentrations, we tested each inhibitor at concentrations ranging from 10 nM to 10 μM. There was no inhibition of Fsk-induced IL-6 expression by this range of concentrations of any of the inhibitors tested (data not shown). If anything, these inhibitors slightly increased Fsk-induced IL-6 expression. cAMP-mediated regulation of IL-6 expression may involve multiple stimulatory and inhibitory pathways with substantial cross talk and redundancy, making it difficult to unravel the steps with inhibition of individual intermediate kinases.
Fig. 6.
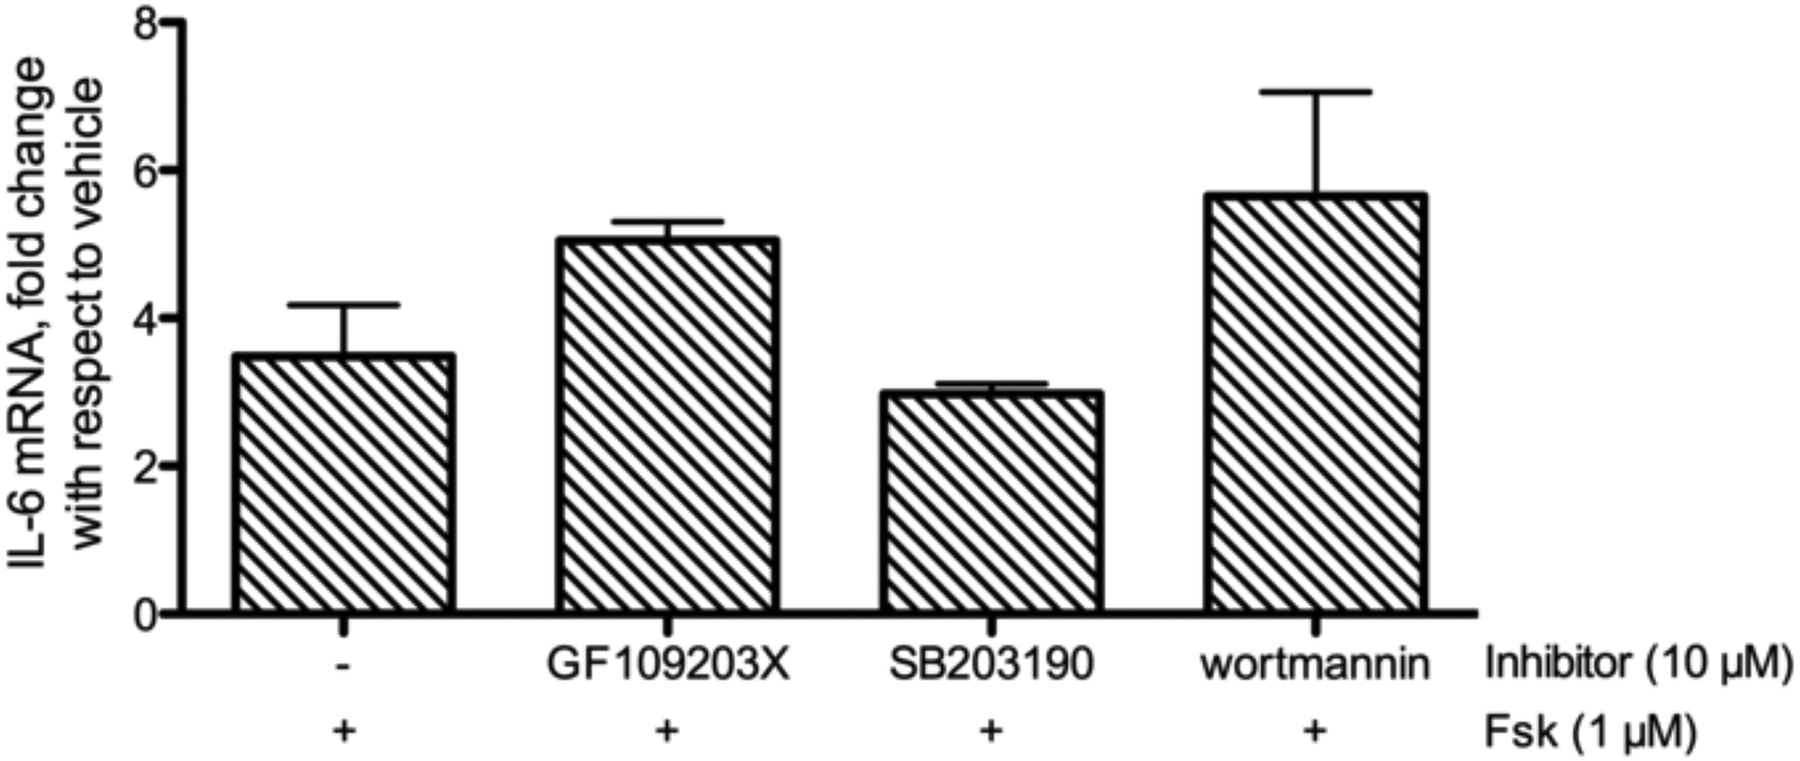
Fsk-induced IL-6 production with inhibition of PKC (GF 109203X), p38 MAPK (SB 202190) or PI3K (wortmanin). BSMC were pretreated with 10 μM of the indicated inhibitor for 1 h prior to addition of 1 μM Fsk. RNA was isolated after 1 h Fsk treatment and measured by qRT-PCR. Data presented as fold over vehicle, mean ± SEM, n=3
AP-1 and CRE promoter elements are required for Fsk-stimulated IL-6 expression
We utilized IL-6 gene reporter assays as an alternative approach to understand the signaling pathways linking cAMP to IL-6 expression. The IL-6 promoter contains C/EBP, CRE, NF-κB, and 2 AP-1 sites (Dendorfer et al. 1994; Akira et al. 1990; Tanabe et al. 1988). We transfected BSMC with a construct containing the luciferase gene preceded by 1168 base pairs of the wild type human IL-6 promoter. Fsk treatment (1 μM) increased luciferase activity nearly 4-fold in cells transfected with the wild type promoter construct (Fig. 7). To determine which promoter elements play a role in Fsk-stimulated IL-6 expression, we then transfected different luciferase constructs containing point mutations in each specific promoter element. Mutations to the 5’ AP-1 or the CRE transcription sites significantly reduced Fsk-stimulated reporter activity compared to wild type. Mutation of C/EBP or NF-κB promoter sites did not significantly alter the Fsk response. Thus, Fsk selectively leads to activation of AP-1 and CRE driven expression of IL-6.
Fig. 7.
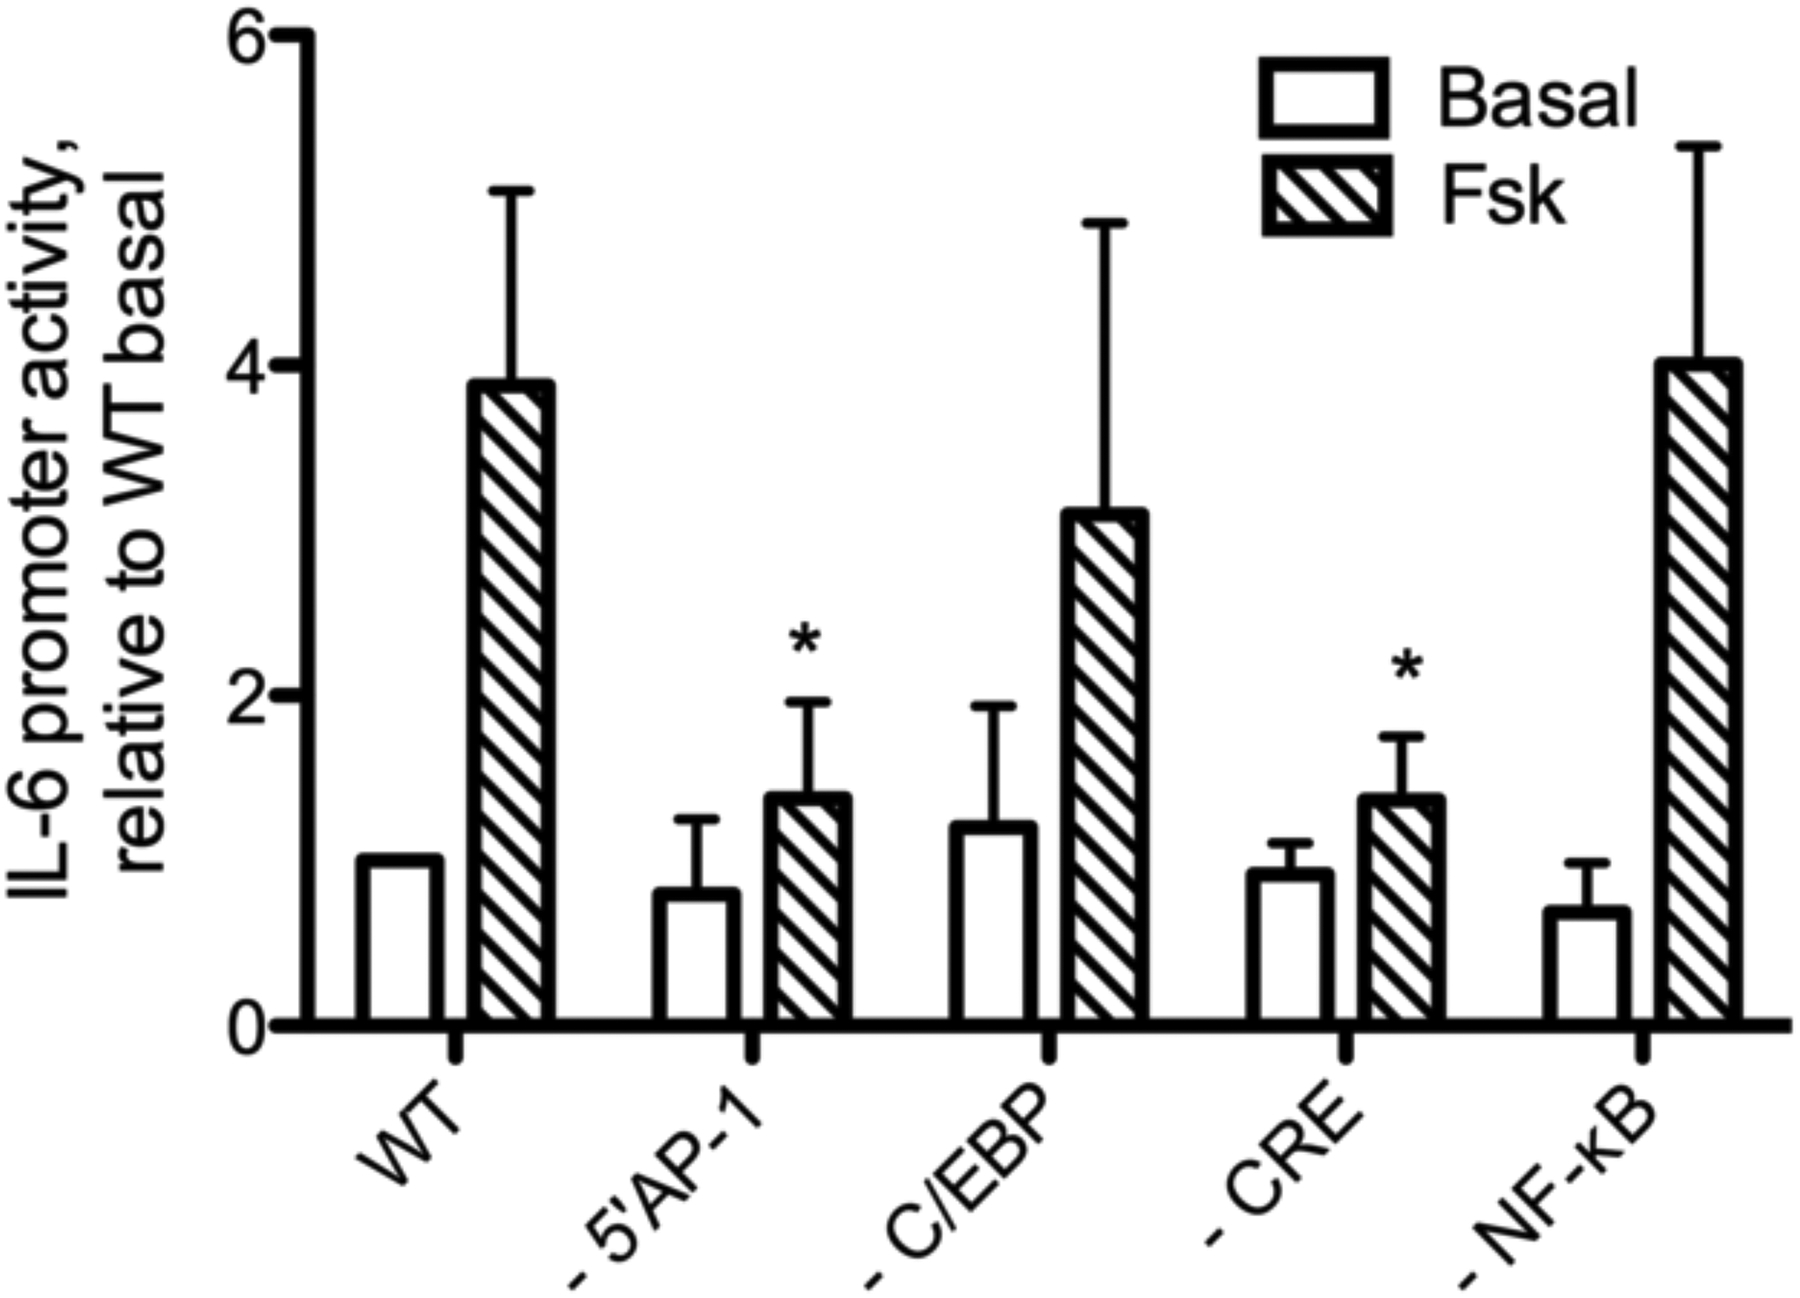
Fsk-induced promoter activation of IL-6 promoter mutants. IL-6 promoter activity was measured by luciferase assay in BSMC that were transfected with 1168 bp wild type or mutated human IL-6 promoters driving expression of luciferase. Luciferase activity in cell lysate was measured following 6 h treatment with 1 μM Fsk. Data is presented as fold over the basal wild-type promoter activity, mean ± SEM, n=11. * indicates p<0.05 compared to Fsk wild-type promoter
Discussion
All AC’s catalyze the conversion of ATP to cAMP, but the cAMP pools created by different AC isoforms can have unique effects in a cell (Gros et al. 2006; Bogard et al. 2012). We sought to determine whether cAMP from different AC isoforms differentially regulates gene expression in BSMC. Overexpression of AC2 or AC6 at the levels we achieved in these studies did not significantly increase cAMP accumulation measured by EIA in the presence IBMX (Fig. 1). cAMP production was likely underestimated since IBMX-insensitive PDE8 is expressed in BSMC. Overexpression of AC increases phosphorylation of PDE8 in these cells (unpublished observations), which increases its activity (Brown et al. 2012). Although adenoviral overexpression did not cause a significant increase in Fsk-stimulated global cAMP levels, it did significantly alter downstream signaling and cellular responses. AC overexpression influences Fsk-mediated gene regulation (Fig. 1 and Supplementary Table 1) and phosphorylation of several proteins (unpublished). AC can regulate some signaling pathways following stimulation independent from production of cAMP via changes in protein interactions (Gao and Hammond 2011; Gao et al. 2011). We hypothesize that cAMP signaling compartments facilitate rapid and focused signal transduction downstream of AC such that individual AC isoforms could mediate cellular responses without a significant increase in cytosolic cAMP levels.
We compared expression of 84 cAMP-sensitive genes in cells overexpressing AC2, AC3, or AC6 to control BSMC endogenously expressing AC2, AC4, and AC6. Subtractive analysis showed that there are at least three distinct cAMP signaling compartments created by overexpression of these different AC isoforms. Exogenously expressed AC3 produces cAMP in a compartment that is not linked to regulation of the genes we examined. cAMP pools produced by AC2 and AC6 are able to regulate cAMP-responsive genes, and for some genes there are isoform-specific effects on regulation. cAMP from AC2 and AC6 can stimulate or inhibit expression of different genes, and each cAMP pool can have contrasting effects on a given gene.
Regulation of gene expression by cAMP has been studied for decades, but not in the context of cAMP produced by specific AC isoforms. Activation of a gene via PKA-phosphorylation of CREB was first described for the somatostatin gene (Montminy and Bilezikjian 1987). We find that the induction of SST occurs downstream of AC6, but not of AC2, in BSMC. cAMP produced by AC2 can induce other genes that contain CREB responsive elements in these cells, raising the question of how these same cAMP signals are interpreted differently in the nucleus.
Activation of AC2, but not AC6, is associated with induction of IL-6 mRNA expression and protein production. To better understand how cAMP from the AC2 compartment specifically regulates IL-6 expression, we investigated the downstream signaling pathways responsible for activation of the IL-6 promoter. Activation of AC2 by Fsk or certain Gαs-coupled receptors activates Epac and PKA and stimulates IL-6 expression through interactions at AP-1 and CRE sites in the IL-6 promoter. Selective cAMP analogs revealed a predominant role for PKA signaling in cAMP mediated IL-6 induction, but Epac signaling synergistically enhanced the response following exposure to a nonselective cAMP analog that activates both PKA and Epac.
Measures of bulk intracellular cAMP levels are not correlated with the amount of IL-6 produced. Different receptors that activated both cAMP production and IL-6 did not show a clear relationship between cAMP levels and IL-6. Furthermore, Gαs-Fsk synergism led to increased cAMP production but did not alter IL-6 production. It is possible that there is a threshold after which additional cAMP has no ability to further increase IL-6 expression. However, a cAMP compartment model might also help explain the lack of correlation with large amounts of cAMP. If cAMP is not produced in the right location, it may be unable to activate the pathways that enhance IL-6 expression. Further studies that can detect cAMP produced in distinct subcellular compartments are needed to understand if such pools of cAMP exist.
The signaling pathways linking GPCR activation to induction of IL-6 appear to be complex. ATPɣS and NECA are able to increase IL-6 production without a detectable increase in cAMP, implying that other signaling pathways activated by Gs-coupled receptors can increase IL-6 expression. However, pharmacological inhibition of PKC, p38 MAPK, or PI3K does not reduce, and may actually increase, Fsk-induced IL-6 production in BSMC. These data are difficult to interpret due to the possibility of non-selective effects of these inhibitors. An alternative approach to study intermediate signaling molecules is to use RNA interference, which allows selective reduction in expression without off target effects. However, the poor transfection efficiency of BSMC restricted our ability to utilize RNAi in the present study.
The fact that both PKA and Epac are activated and that both the AP-1 and CRE promoter sequences appear to play roles, imply that multiple signaling pathways intersect to regulate IL-6 production. Thus, the compartmentized responses we observe may be partly due to the generation of different signal patterns that reach the nucleus rather than a strict spatial separation of similar signals. AC2 and AC6 may participate in different compartments in the near-membrane region that leads to activation of different signals, such that the compartment does not need to be maintained all the way into the nucleus.
The membrane compartments likely exist because AC isoforms differ in their regulation and interactions with other signaling molecules. AC2 is known to interact with multiple A Kinase Anchoring Protein (AKAP) scaffolding molecules including mAKAP, Yotiao, and AKAP79, which bring cAMP produced by AC2 in close proximity to prearranged signaling cascades that include PDE’s, which limit cAMP diffusion (Piggott et al. 2008; Kapiloff et al. 2009; Scott et al. 2013). Of these, AKAP79 has been identified in BSMC (Horvat et al. 2012). AC2 specific enhancement and the ability of ATPɣS and NECA to induce IL-6 without significant global cAMP increase could be explained by PKC activation of AC2 as part of a complex with AKAP79 as recently described by Shen and Cooper (2013). Using plasma membrane targeted Epac2 FRET-based cAMP sensors along with molecular and pharmacological approaches, they showed that activation of muscarinic receptors leads to the receptor’s association with AKAP79 in HEK-293 cells. AKAP79 forms a complex containing the receptor, AC2, PKC, PKA, and PDE4. This complex results in signals that are confined in space and time. Upon stimulation of the muscarinic receptor, PKC activates AC2. The cAMP produced by AC2 is short-lived since it activates PDE4 activity via PKA, and all components are kept in close association by AKAP79 (Shen and Cooper 2013).
It is likely that AC6 is also part of signaling complexes containing PDE’s. PDE4 appears to play a role in preventing cAMP produced by AC6 from inducing IL-6 expression. When we treated BSMC with the PDE4-selective inhibitor rolipram, overexpression of AC6 significantly increased IL-6 production, even at basal AC activity (with no addition of Fsk, data not shown). The AKAP gravin orchestrates a complex with PDE4 to restrict cAMP to the membrane region (Willoughby et al. 2006). Given that gravin is expressed in airway smooth muscle one might hypothesize that this complex acts to restrict the AC6 signaling compartment (Horvat et al. 2012). Further work should seek to define all the proteins associated with AC’s natively expressed in BSMC. Such studies should illuminate how AC2 is specifically linked to enhancement of IL-6 expression and how AC6 normally lacks this ability, and how AC6 regulates SST expression but AC2 does not.
We hypothesized that individual AC isoforms can differentially regulate cellular responses in BSMC and found that AC2-derived cAMP selectively regulates induction of IL-6 gene expression. We are the first to show AC isoform-specific differences in regulation of gene expression, but have little insight into the mechanistic details behind this phenomenon. The poor transfection efficiency of BSMC limits the approaches that can be used to study the roles for individual AC isoforms and the downstream signaling molecules important for AC2 selective regulation of IL-6 expression. We used adenoviral overexpression of individual AC isoforms and subtractive analysis to uncover AC isoform-specific roles in regulating gene expression. One concern with using an overexpression approach is whether overexpressed AC has the same localization as native protein. Our previous work examined subcellular localization of overexpressed AC’s and found no deviations from the pattern of endogenous expression (Bogard et al. 2011; Bogard et al. 2012). By the time a cAMP-mediated signal has reached the nucleus there have been many opportunities for stimulatory and inhibitory signaling and cross talk among signaling pathways, which make it difficult to trace an AC2-derived cAMP signal all the way to the IL-6 promoter. Future work will look at isoform specific differences more proximal to AC. A proteomics study is underway to identify phosphorylation patterns downstream of individual AC isoforms and may provide insight into signaling intermediates and pathways activated selectively by AC2 that induce IL-6 expression.
The present work illustrates that AC isoforms regulate specific cellular responses via differential gene expression in BSMC. βAR agonist-mediated AC activation is effective for treatment of bronchoconstriction in asthma, but at the same time it has the potential to stimulate AC2 activity and increase production of the pro-inflammatory cytokine IL-6, potentially worsening the disease. Better understanding of cAMP signaling compartments and effects downstream of individual AC isoforms could lead to improved therapeutic strategies for asthma.
Supplementary Material
Acknowledgements
This work was supported by the National Institutes of Health National Heart, Lung and Blood Institute [Grant HL079166].
List of non-standard abbreviations:
- AC
adenylyl cyclase
- cAMP
cyclic 3’,5’ adenosine monophosphate
- BSMC
bronchial smooth muscle cells
- Fsk
forskolin
- IL-6
interleukin 6
- GPCR
G protein-coupled receptor
- Epac
exchange protein activated by cAMP
- PKA
protein kinase A
- AP-1
activator protein 1
- CRE
cAMP response element
- βAR
beta-adrenergic receptor
- PKC
protein kinase C
- CaM
calmodulin
- Iso
isoproterenol
- NECA
5’-N-ethylcarboxamidoadenosine
- AVP
Arginine vasopressin
- α-CGRP
α-calcitonin gene related peptide
- PGD2
prostaglandin D2
- IBMX
3-isobutyl-1-methylxanthine
- CP
crossing point
- AREG
Amphiregulin
- SCG2
Secretogranin II
- CCND1
cyclin D1
- SST
somatostatin
- EP2R
prostaglandin E2 receptor
- Buta
butaprost
- 8-CPT-2Me-cAMP
8-(4-Chlorophenylthio)-2’-O-methylad-enosine-3’,5’-cyclic monophosphate sodium salt
- 8-Br-cAMP
8-Bromoadenosine 3′,5′-cyclic monophosphate
- p38 MAPK
p38 Mitogen-activated protein kinase
- PI3K
phosphatidylinositol 3-kinase
- PGE2
prostaglandin E2
- qRT-PCR
quantitative reverse transcriptase polymerase chain reaction
- C/EBP
CCAAT-enhancer-binding protein
- RNAi
RNA interference
- PDE
phosphodiesterase
- AKAP
A Kinase Anchoring Protein
References
- Akira S, Isshiki H, Sugita T, Tanabe O, Kinoshita S, Nishio Y, Nakajima T, Hirano T, Kishimoto T (1990) A nuclear factor for IL-6 expression (NF-IL6) is a member of a C/EBP family. Embo J 9 (6):1897–1906 [DOI] [PMC free article] [PubMed] [Google Scholar]
- Ammit AJ, Lazaar AL, Irani C, O’Neill GM, Gordon ND, Amrani Y, Penn RB, Panettieri RA Jr. (2002) Tumor Necrosis Factor-alpha -Induced Secretion of RANTES and Interleukin-6 from Human Airway Smooth Muscle Cells. Modulation by Glucocorticoids and beta -Agonists. Am J Respir Cell Mol Biol 26 (4):465–474 [DOI] [PubMed] [Google Scholar]
- Bayewitch ML, Avidor-Reiss T, Levy R, Pfeuffer T, Nevo I, Simonds WF, Vogel Z (1998) Inhibition of adenylyl cyclase isoforms V and VI by various Gbetagamma subunits. The FASEB journal : official publication of the Federation of American Societies for Experimental Biology 12 (11):1019–1025 [DOI] [PubMed] [Google Scholar]
- Bogard A, Xu C, Ostrom R (2011) Human Bronchial Smooth Muscle Cells Express Adenylyl Cyclase Isoforms 2, 4, and 6 in Distinct Membrane Microdomains. J Pharmacol Exp Ther 337 (1):209–217. doi: 10.1124/jpet.110.177923 [DOI] [PMC free article] [PubMed] [Google Scholar]
- Bogard AS, Adris P, Ostrom RS (2012) Adenylyl cyclase 2 selectively couples to E prostanoid type 2 receptors, whereas adenylyl cyclase 3 is not receptor-regulated in airway smooth muscle. J Pharmacol Exp Ther 342 (2):586–595. doi: 10.1124/jpet.112.193425 [DOI] [PMC free article] [PubMed] [Google Scholar]
- Bol GF, Hulster A, Pfeuffer T (1997) Adenylyl cyclase type II is stimulated by PKC via C-terminal phosphorylation. Biochim Biophys Acta 1358 (3):307–313 [DOI] [PubMed] [Google Scholar]
- Brown KM, Lee LC, Findlay JE, Day JP, Baillie GS (2012) Cyclic AMP-specific phosphodiesterase, PDE8A1, is activated by protein kinase A-mediated phosphorylation. Febs Lett 586 (11):1631–1637. doi: 10.1016/j.febslet.2012.04.033 [DOI] [PubMed] [Google Scholar]
- Chen C, Du J, Feng W, Song Y, Lu Z, Xu M, Li Z, Zhang Y (2012) beta-Adrenergic receptors stimulate interleukin-6 production through Epac-dependent activation of PKCdelta/p38 MAPK signalling in neonatal mouse cardiac fibroblasts. Br J Pharmacol 166 (2):676–688. doi: 10.1111/j.1476-5381.2011.01785.x [DOI] [PMC free article] [PubMed] [Google Scholar]
- Chen J, Iyengar R (1993) Inhibition of cloned adenylyl cyclases by mutant-activated Gi-alpha and specific suppression of type 2 adenylyl cyclase inhibition by phorbol ester treatment. The Journal of biological chemistry 268 (17):12253–12256 [PubMed] [Google Scholar]
- Choi EJ, Xia Z, Storm DR (1992) Stimulation of the type III olfactory adenylyl cyclase by calcium and calmodulin. Biochemistry 31 (28):6492–6498 [DOI] [PubMed] [Google Scholar]
- Daly JW, Jacobson KA, Ukena D (1987) Adenosine receptors: development of selective agonists and antagonists. Progress in clinical and biological research 230:41–63 [PubMed] [Google Scholar]
- Daly JW, Padgett W, Seamon KB (1982) Activation of cyclic AMP-generating systems in brain membranes and slices by the diterpene forskolin: augmentation of receptor-mediated responses. J Neurochem 38 (2):532–544 [DOI] [PubMed] [Google Scholar]
- Darfler FJ, Mahan LC, Koachman AM, Insel PA (1982) Stimulation of forskolin of intact S49 lymphoma cells involves the nucleotide regulatory protein of adenylate cyclase. J Biol Chem 257 (20):11901–11907. [PubMed] [Google Scholar]
- Dendorfer U, Oettgen P, Libermann TA (1994) Multiple regulatory elements in the interleukin-6 gene mediate induction by prostaglandins, cyclic AMP, and lipopolysaccharide. Molecular and cellular biology 14 (7):4443–4454 [DOI] [PMC free article] [PubMed] [Google Scholar]
- Ding Q, Gros R, Gray ID, Taussig R, Ferguson SS, Feldman RD (2004) Raf kinase activation of adenylyl cyclases: isoform-selective regulation. Mol Pharmacol 66 (4):921–928. doi: 10.1124/mol.66.4. [DOI] [PubMed] [Google Scholar]
- Federman AD, Conklin BR, Schrader KA, Reed RR, Bourne HR (1992) Hormonal stimulation of adenylyl cyclase through Gi-protein bg subunits. Nature 356:159–161 [DOI] [PubMed] [Google Scholar]
- Feinstein PG, Schrader KA, Bakalyar HA, Tang WJ, Krupinski J, Gilman AG, Reed RR (1991) Molecular cloning and characterization of a Ca2+/calmodulin-insensitive adenylyl cyclase from rat brain. Proc Natl Acad Sci U S A 88 (22):10173–10177. [DOI] [PMC free article] [PubMed] [Google Scholar]
- Fiebich BL, Schleicher S, Spleiss O, Czygan M, Hull M (2001) Mechanisms of prostaglandin E2-induced interleukin-6 release in astrocytes: possible involvement of EP4-like receptors, p38 mitogen-activated protein kinase and protein kinase C. J Neurochem 79 (5):950–958 [DOI] [PubMed] [Google Scholar]
- Gao MH, Hammond HK (2011) Unanticipated signaling events associated with cardiac adenylyl cyclase gene transfer. J Mol Cell Cardiol 50 (5):751–758. doi: 10.1016/j.yjmcc.2011.02.009 [DOI] [PMC free article] [PubMed] [Google Scholar]
- Gao MH, Tang T, Lai NC, Miyanohara A, Guo T, Tang R, Firth AL, Yuan JX, Hammond HK (2011) Beneficial effects of adenylyl cyclase type 6 (AC6) expression persist using a catalytically inactive AC6 mutant. Mol Pharmacol 79 (3):381–388. doi: 10.1124/mol.110.067298 [DOI] [PMC free article] [PubMed] [Google Scholar]
- Gros R, Ding Q, Chorazyczewski J, Pickering JG, Limbird LE, Feldman RD (2006) Adenylyl cyclase isoform-selective regulation of vascular smooth muscle proliferation and cytoskeletal reorganization. Circ Res 99 (8):845–852. doi: 10.1161/01.RES.0000245189.21703.c0 [DOI] [PubMed] [Google Scholar]
- Horvat SJ, Deshpande DA, Yan H, Panettieri RA, Codina J, Dubose TD Jr., Xin W, Rich TC, Penn RB (2012) A-kinase anchoring proteins regulate compartmentalized cAMP signaling in airway smooth muscle. FASEB J 26 (9):3670–3679. doi: 10.1096/fj.11-201020 [DOI] [PMC free article] [PubMed] [Google Scholar]
- Insel PA, Ostrom RS (2003) Forskolin as a tool for examining adenylyl cyclase expression, regulation, and G protein signaling. Cell Mol Neurobiol 23 (3):305–314 [DOI] [PMC free article] [PubMed] [Google Scholar]
- Jacobowitz O, Chen J, Premont RT, Iyengar R (1993) Stimulation of specific types of Gs-stimulated adenylyl cyclases by phorbol ester treatment. The Journal of biological chemistry 268 (6):3829–3832 [PubMed] [Google Scholar]
- Kapiloff MS, Piggott LA, Sadana R, Li J, Heredia LA, Henson E, Efendiev R, Dessauer CW (2009) An adenylyl cyclase-mAKAPbeta signaling complex regulates cAMP levels in cardiac myocytes. J Biol Chem 284 (35):23540–23546. doi: 10.1074/jbc.M109.030072 [DOI] [PMC free article] [PubMed] [Google Scholar]
- Katsushika S, Chen L, Kawabe J, Nilakantan R, Halnon NJ, Homcy CJ, Ishikawa Y (1992) Cloning and characterization of a sixth adenylyl cyclase isoform: types V and VI constitute a subgroup within the mammalian adenylyl cyclase family. Proc Natl Acad Sci U S A 89 (18):8774–8778 [DOI] [PMC free article] [PubMed] [Google Scholar]
- Lai HL, Yang TH, Messing RO, Ching YH, Lin SC, Chern Y (1997) Protein kinase C inhibits adenylyl cyclase type VI activity during desensitization of the A2a-adenosine receptor-mediated cAMP response. J Biol Chem 272 (8):4970–4977 [DOI] [PubMed] [Google Scholar]
- Montminy MR, Bilezikjian LM (1987) Binding of a nuclear protein to the cyclic-AMP response element of the somatostatin gene. Nature 328 (6126):175–178. doi: 10.1038/328175a0 [DOI] [PubMed] [Google Scholar]
- Ostrom RS, Bogard AS, Gros R, Feldman RD (2012) Choreographing the adenylyl cyclase signalosome: sorting out the partners and the steps. Naunyn Schmiedebergs Arch Pharmacol 385 (1):5–12. doi: 10.1007/s00210-011-0696-9 [DOI] [PubMed] [Google Scholar]
- Ostrom RS, Gregorian C, Drenan RM, Xiang Y, Regan JW, Insel PA (2001) Receptor number and caveolar co-localization determine receptor coupling efficiency to adenylyl cyclase. J Biol Chem 276 (45):42063–42069. [DOI] [PubMed] [Google Scholar]
- Ostrom RS, Gregorian C, Insel PA (2000) Cellular release of and response to ATP as key determinants of the set-point of signal transduction pathways. J Biol Chem 275 (16):11735–11739 [DOI] [PubMed] [Google Scholar]
- Patel TB, Du Z, Pierre S, Cartin L, Scholich K (2001) Molecular biological approaches to unravel adenylyl cyclase signaling and function. Gene 269 (1–2):13–25 [DOI] [PubMed] [Google Scholar]
- Piggott LA, Bauman AL, Scott JD, Dessauer CW (2008) The A-kinase anchoring protein Yotiao binds and regulates adenylyl cyclase in brain. Proc Natl Acad Sci U S A 105 (37):13835–13840. doi: 10.1073/pnas.0712100105 [DOI] [PMC free article] [PubMed] [Google Scholar]
- Plaisance S, Vanden Berghe W, Boone E, Fiers W, Haegeman G (1997) Recombination signal sequence binding protein Jkappa is constitutively bound to the NF-kappaB site of the interleukin-6 promoter and acts as a negative regulatory factor. Mol Cell Biol 17 (7):3733–3743 [DOI] [PMC free article] [PubMed] [Google Scholar]
- Raychaudhuri N, Douglas RS, Smith TJ (2010) PGE2 induces IL-6 in orbital fibroblasts through EP2 receptors and increased gene promoter activity: implications to thyroid-associated ophthalmopathy. PLoS One 5 (12):e15296. doi: 10.1371/journal.pone.0015296 [DOI] [PMC free article] [PubMed] [Google Scholar]
- Rincon M, Irvin CG (2012) Role of IL-6 in asthma and other inflammatory pulmonary diseases. International journal of biological sciences 8 (9):1281–1290. doi: 10.7150/ijbs.4874 [DOI] [PMC free article] [PubMed] [Google Scholar]
- Rybin VO, Xu X, Lisanti MP, Steinberg SF (2000) Differential targeting of beta -adrenergic receptor subtypes and adenylyl cyclase to cardiomyocyte caveolae. A mechanism to functionally regulate the cAMP signaling pathway. J Biol Chem 275 (52):41447–41457. [DOI] [PubMed] [Google Scholar]
- Scott JD, Dessauer CW, Tasken K (2013) Creating order from chaos: cellular regulation by kinase anchoring. Annu Rev Pharmacol Toxicol 53:187–210. doi: 10.1146/annurev-pharmtox-011112-140204 [DOI] [PMC free article] [PubMed] [Google Scholar]
- Shen JX, Cooper DM (2013) AKAP79 and PKC, PKA and PDE4, participate in a Gq-linked muscarinic receptor and adenylyl cyclase 2 cAMP signalling complex. Biochem J. doi: 10.1042/BJ20130359 [DOI] [PMC free article] [PubMed] [Google Scholar]
- Sutkowski EM, Tang WJ, Broome CW, Robbins JD, Seamon KB (1994) Regulation of forskolin interactions with type I, II, V and VI adenylyl cyclases by Gs alpha. Biochemistry 33:12852–12859 [DOI] [PubMed] [Google Scholar]
- Tanabe O, Akira S, Kamiya T, Wong GG, Hirano T, Kishimoto T (1988) Genomic structure of the murine IL-6 gene. High degree conservation of potential regulatory sequences between mouse and human. J Immunol 141 (11):3875–3881 [PubMed] [Google Scholar]
- Tang WJ, Gilman AG (1991) Type-specific regulation of adenylyl cyclase by G protein beta gamma subunits. Science 254 (5037):1500–1503 [DOI] [PubMed] [Google Scholar]
- Tliba O, Panettieri RA Jr. (2009) Noncontractile functions of airway smooth muscle cells in asthma. Annu Rev Physiol 71:509–535. doi: 10.1146/annurev.physiol.010908.163227 [DOI] [PubMed] [Google Scholar]
- Vanden Berghe W, Plaisance S, Boone E, De Bosscher K, Schmitz ML, Fiers W, Haegeman G (1998) p38 and extracellular signal-regulated kinase mitogen-activated protein kinase pathways are required for nuclear factor-kappaB p65 transactivation mediated by tumor necrosis factor. J Biol Chem 273 (6):3285–3290 [DOI] [PubMed] [Google Scholar]
- Wang P, Zhu F, Konstantopoulos K (2010) Prostaglandin E2 induces interleukin-6 expression in human chondrocytes via cAMP/protein kinase A- and phosphatidylinositol 3-kinase-dependent NF-kappaB activation. American journal of physiology Cell physiology 298 (6):C1445–1456. doi: 10.1152/ajpcell.00508.2009 [DOI] [PMC free article] [PubMed] [Google Scholar]
- Wei J, Wayman G, Storm DR (1996) Phosphorylation and inhibition of type III adenylyl cyclase by calmodulin-dependent protein kinase II in vivo. J Biol Chem 271 (39):24231–24235 [DOI] [PubMed] [Google Scholar]
- Willoughby D, Wong W, Schaack J, Scott JD, Cooper DM (2006) An anchored PKA and PDE4 complex regulates subplasmalemmal cAMP dynamics. Embo J 25 (10):2051–2061. doi: 10.1038/sj.emboj.7601113 [DOI] [PMC free article] [PubMed] [Google Scholar]
- Yokoyama A, Kohno N, Fujino S, Hamada H, Inoue Y, Fujioka S, Ishida S, Hiwada K (1995) Circulating interleukin-6 levels in patients with bronchial asthma. Am J Respir Crit Care Med 151 (5):1354–1358. doi: 10.1164/ajrccm.151.5.7735584 [DOI] [PubMed] [Google Scholar]
Associated Data
This section collects any data citations, data availability statements, or supplementary materials included in this article.