

Abstract
International standards recommend provision of 1 ambulance for every 50,000 people to fulfil demand for transporting patients to definitive care facilities in Low and Middle Income Countries (LMICs). Governments’ consistent attempt to build capacity of emergency medical services (EMS) in LMICs has been financially demanding. This study is an attempt to assess the feasibility of capacity building of existing EMS in Delhi, India by using taxis as an alternative mode of transport for emergency transportation of road traffic crash victims to enable improvement in response time for road traffic crashes where time criticality is deemed important. Performance of the proposed system is evaluated based on response time, coverage and distance. The system models the performance and quantifies the taxi - ambulance configuration for achieving EMS performance within international standards.
Keywords: Emergency Medical Services, Taxi-Ambulance, Road Traffic Crash, Response time, Low and Middle Income Countries
INTRODUCTION
Low and middle income countries (LMICs) contribute 90% of the global road traffic crash (RTC) fatalities (World Health Organization 2015). The road traffic fatality rate per 100000 population in India (18.9) is much higher than high (8.7) income countries. International standards recommend provision of 1 ambulance for every 50,000 people to fulfil demand for transporting patients to definitive care facilities in Low and Middle Income Countries (LMICs)(Debas et al. 2012; Deloitte Touche Tohmatsu India Pvt. Ltd. 2013). In India, severely injured road crash victims are six times more prone to die compared to countries that have a well-developed trauma care system (Radjou, Mahajan, and Baliga 2013). One of the major reasons for the higher fatality rate in India is the absence of a uniform Emergency Medical System (EMS), with no single access number. Only major cities, such as Delhi, Mumbai, Bengaluru and Kolkata, have EMS systems that are operated by government or by some private agency in a public-private partnership (Roy et al. 2010). Critically injured patients are more prone to die if definitive surgical care is not provided within 60 minutes from the time of injury (Björnstig 2004). These standards can be operationally delivered only when a uniform and sufficient EMS system is operational with well-defined and adhered to response time standards (Aboueljinane, Jemai, and Sahin 2012). If proper actions are not taken to counter the situation, the statistics are most likely to double by the year 2027 (Singh 2017). In most LMICs where such systems are capacity deficit, injured victims are transported to hospitals in private vehicles and by bystanders (Schmid and Doerner 2010; Arbon and Hayes 2007). In the absence of a formal ambulance system, victims are brought to hospital in private cars, taxis, three-wheeled auto rickshaws, cycle rickshaws, police and vehicles (Bhalla et al. 2019).
Study Area context: NCT of Delhi
In Delhi, an ambulance service is operated by the Government of National Capital Territory of Delhi (GNCTD). The service is named as Centralized Accident & Trauma Services (CATS), an autonomous body of GNCTD. It is currently operational with a fleet of 259 ambulances. The fleet is sub-divided into three categories based on the facilities fitted in the vehicle. Configuration being 29 Advance Life Support (ALS), 106 Basic Life Support (BLS) and 124 Patient Transfer Ambulance (PTA)(Sharma and Brandler 2014; Singh AR and Gupta SK 2014). The system is operated through regional emergency contact number “dial 102” from centralized control room. These ambulances fall within non-profit and government subsidized EMS program for patient transportation for all types of medical and non-medical emergencies. The CATS control centre receives about 30,000 calls per month for service of which about 15% calls are for road traffic crashes, which are assigned the highest priority for dispatching. The target operational response standard for these ambulance operations is 8 to 10 minutes, which is slowly being built up by adding more ambulances into the system (Kumar Gupta et al. 2011). In Delhi, only 30% of the calls taken by CATS is covered within 8 minutes (Singh AR and Gupta SK 2014). In this study, we propose to use three wheeler and four wheeler taxis as potential backup vehicles for time critical emergencies and assess its potential contribution to performance indices used for measuring EMS performance. There are 1,50,000 such vehicles operational in Delhi, whose geolocation is tracked by the transport department of Delhi government. If we could possibly utilize these as potential backup services for improving current operations of ambulances, they might add substantial value to existing EMS system performance. Training of taxi drivers for managing the crash scene and providing first aid to crash victims would be valuable for its implementation. An Australian study observed the first aid training and its utilization by layperson, drivers and bystanders while helping road crash victims.77% of the surveyed participants were trained in first aid training of which 11% actually used these skills during helping. These 11% respondents used these skills impromptu while travelling in a vehicle when they came across an RTC. They observed that having first aid training increased the likelihood of people to use those skills, while owning a first aid kit and pocket mask helps in confidence boosting of these responders. Responders were concerned about lack of follow up on their skills and about first aid experience (Arbon and Hayes 2007).Two factors that play a major role in survival of crash victim are obstruction in airway leading to suffocation and uncontrolled bleeding. The aim of training curriculum for basic life support is advised to be to maintain patient’s airway, breathing and circulation till hospitalised care is provided (Oxer 1999; Larsson, Mártensson, and Alexanderson 2002).
Understanding of System Barriers for Implementation of an EMS System
Less than 1% of the population has access to an ambulance globally. In India, almost 80% of the trauma patients have difficulty reaching a definitive care facility within the first 60 minutes (Fitzgerald et al. 2006). Only 4% of Indian hospitals have operational radio information network between hospital and ambulances. Recommendations suggest two stage setup system required for improvement of emergency response systems. The first deals with infrastructure required for the improved system. The second part is largely determined by the realities of existing public infrastructure in a specific geographical area with respect to emergency services management, especially medical care (Joshi et al. 2013). The main barrier for developing an independent EMS system is initial investment and maintaining consistent operations. Poor connectivity and inadequate parking facilities for ambulances add to woes of operators.
EMS Performance Measures
The performance of the EMS system reduces as the response time increases (Lam et al. 2015). The response time is primary performance index for measuring service performance (Lee 2014). The other major performance standard being total travel time and coverage. Other than space-time standards, the patient’s condition should also be considered for service type in order to decrease mortality rates (Lee 2014).
Response Travel Time and Related Standards
Total service time for a call to be serviced by a response vehicle constitutes of regulation time(time between call arrival and vehicle assignment), response travel time(time between vehicle departure to crash site arrival), onsite time(crash site arrival to departure from crash site) and drop off travel time(departure from crash site to hospital arrival) (Aboueljinane, Jemai, and Sahin 2012). Global response travel time standards for countries like England, Scotland, Australia, Canada and Netherlands varies within a range from 8 to 15 minutes with a coverage ranging from 75 to 90%. The coverage is defined as the % of events covered under the set benchmark i.e. percentage of demand covered in threshold like 8 minutes. Even countries like Sweden known for their best safety measure, the response time is kept between 5–10 minutes with 10 km of average travel distance. The performance standard is keeping in view that Sweden’s EMS is equipped with effective ground EMS system as well as air ambulance with Helicopters and aircrafts in its fleet, which is hard to find in most LMICs (Björnstig 2004). Thus, there is a need to consider alternatives as backup to match international performance measures with limited fleet until we are able to build up inventory of emergency services at par with developed nations. For this study, we are considering response travel time defined above as the response time and total travel time as the sum of response travel time and drop off travel time.
OBJECTIVES
The study objectives aim to develop and implement a simulation based methodology for enhancing ambulance based emergency service systems using available alternative vehicle resources such as three- and four-wheeler taxis.
Develop system configuration for taxi based EMS to bring down response travel time within international standards
To evaluate performance improvement of the developed system with international parameters of response travel time, total travel time, coverage
MODELLING METHODOLOGY
The study develops a simulation based methodology for deriving the optimum proportion of taxis to perform within international response time measure of 8 minutes for Delhi. The study bases its demand on the actual call records of ambulance services for a duration of three days in a week staggered across weekday and weekend to cover demand variation. The taxi trajectory data for 1,50,000 taxis is utilized to run the simulation framework. Further, we evaluate other performance measures as total travel time, distance and coverage.
Simulation Model Inputs
Ambulance Fleet: Government Ambulance Service Delhi
The service is operating a total fleet size of 259 ambulances in Delhi and each vehicle has been assigned with a unique code. These vehicles are placed at various base locations distributed in Delhi for effective operations across the city. Of these 259 ambulances, 39 ambulances are randomly sampled during each simulation accounting 15% of its real time utilization for road traffic crashes.
Crash Data
The data has been obtained for 7 months from December 2017 to August 2018 except for January & July 2018, due to missing information for these months. Government ambulance service receives on average about 30,000 service request calls per month on average for all type of incidents. On average about 15% of the total call records received for service are road traffic crashes. RTC’s are high priority cases for service, which means they need to be serviced earliest of all other calls for service and should be covered within performance standard of the service facility.
Hospital Data
The list of hospitals is extracted from the government ambulance service call records data. There are a total of about 106 hospitals taken as destinations for ambulances servicing the crash locations.
Para Transit Vehicles (Auto/Taxi)
Taxi locations are randomly sampled from taxi trajectories recorded real time data of 1,50,000 three wheeler and four wheeler taxis plying within GNCTD boundaries. In this study, we randomly sample taxi locations as an iterative process, sample size of number of taxis for each simulation iteration is from 50, 100, 125, 150, 175, 200, 250 and 300 taxis.
Demand
Three days demand for road crash locations has been extracted from the broader dataset, staggered across the weekdays and weekends to accommodate daily demand location fluctuations. Number of crashes in a typical weekday ranges from 150 to 170 while on a weekend count is about 200.
Simulation Framework
We started by understanding the existing government EMS system available in Delhi and its contribution in catering to road traffic related trauma. It’s observed that government ambulance service receives calls from every type of patient and user. This study’s focus is only on road traffic crash demand’s contribution towards government ambulance call for service requirements, owing to its time sensitive nature and higher proportion of calls within higher priority emergencies across nations. A generic simulation framework is developed which can be replicated for other time sensitive emergencies for cities where formal emergency response systems are either facing capacity woes or are in developing stages. The overall methodology is described in flowchart (Figure 1). The number of simulation iteration to be performed is based on RANdom SAmple Consensus (RANSAC) algorithm which enables selection of optimum number of simulations for reliable results. RANSAC is an iterative algorithm introduced by Fischler(Fischler and Bolles 1981) for the robust estimation of parameters from a subset of inliers from the complete data set. The sample taxi size used in each iteration is incremented until we either achieve 8 minutes performance standard or the response time variation is negligible. Each sample of taxi geolocation is first checked to ensure geospatial distribution throughout the city using google maps before using it as input to the simulation. The selected sample size ranges through 50, 100, 125, 150, 175, 200, 250 and 300 taxis each iterated 10 times for all 7 simulation iterations to account diversity in locations. The final trend line is drawn based on average of all 10 iterations for a single combination set of crash location, ambulance location, hospitals and taxi location.
Figure 1:

Simulation Methodology
The contribution of road traffic crashes in total calls for service is an average of 15% of the total demand. Current model assumes that similar contribution (~15%) is provided by ambulance fleet to cater to road crash related calls. Thus, simulation accounts only 15% of the vehicles as service vehicles for road traffic crashes from the total fleet i.e. 39 ambulances. Hence a multiple random sampling is done to run 10 times, each of 7 different combinations {~200 crashes *106 hospitals *(50 to 300) taxis and/or 39 ambulances of this fleet of 265 ambulances and variable taxi locations, multiple-randomly sampled from 1,50,000 taxi trajectory data}.
Number of Iterations based on RANSAC Model
One of the main issues in simulation models is to decide how many iterations would lead us to reliable estimates. For this study, we used Random Sample Consensus (RANSAC) algorithm, which is a popular tool for robust estimation problems in computer vision, primarily due to its ability to tolerate a tremendous fraction of outliers. RANSAC uses the smallest set possible and proceeds to enlarge this set with consistent data points (Derpanis 2010). The technique is best suited when a certain share of error (v) is predefined to determine the minimum number of iterations required. The desired probability of getting a good result is assumed as 99%.
Calculation:
| Equation 1 |
| Equation 2 |
Where,
v – Outlier or v = 1- u (Probability of observing an outlier)
(1-v) – Inlier
(1-v) m – Joint probability ‘m’ times of all inliers
N = Number of Iteration (To be found)
v = Probability that a point is outlier (1.5% or 0.015 assumed)(Derpanis 2010; Raguram, Frahm, and Pollefeys 2008)
u = Probability that any selected data point is an inlier
p = Desired probability that we get a good result (i.e. 0.99)
m = Number of points in sample (15% of 259 ambulance locations i.e. 39)
On substituting the values in the model, N=6
The inputs of the model are:
- Fixed:
- Demand/Crash locations
- Hospital Location
- Randomly sampled service vehicle locations:
- Ambulances
- Three wheeler and Four wheeler taxis
The output parameters obtained from the model are:
Response Time
Total Travel Time
Coverage
For this study, we are considering response travel time defined above as the response time and total travel time as the sum of response travel time and drop off travel time. Coverage is defined as the % of events covered under the set benchmark which is taken as 8 minutes for this study. The developed model aims to study the response time and coverage of the demand locations by service vehicles. The methodology involves generating simulations of scenario by varying the configuration of service vehicles and geographical positions of demand. The above combinations for simulation have been done for 3 days of a week to incorporate the weekday/ weekend fluctuations in overall results. The output is recorded in the terms of Response Time, Coverage and Distance driven for each event each day. The coverage is calculated for response time <= 8 minutes. Targeted coverage using taxis is 8 minutes for 90% of the cases based on international standards. The outcome of developed configuration vs government ambulance service data shows the trend and breakpoint of the additional taxis needed to achieve the response time and coverage within the predefined threshold level (Figure 2).
Figure 2:
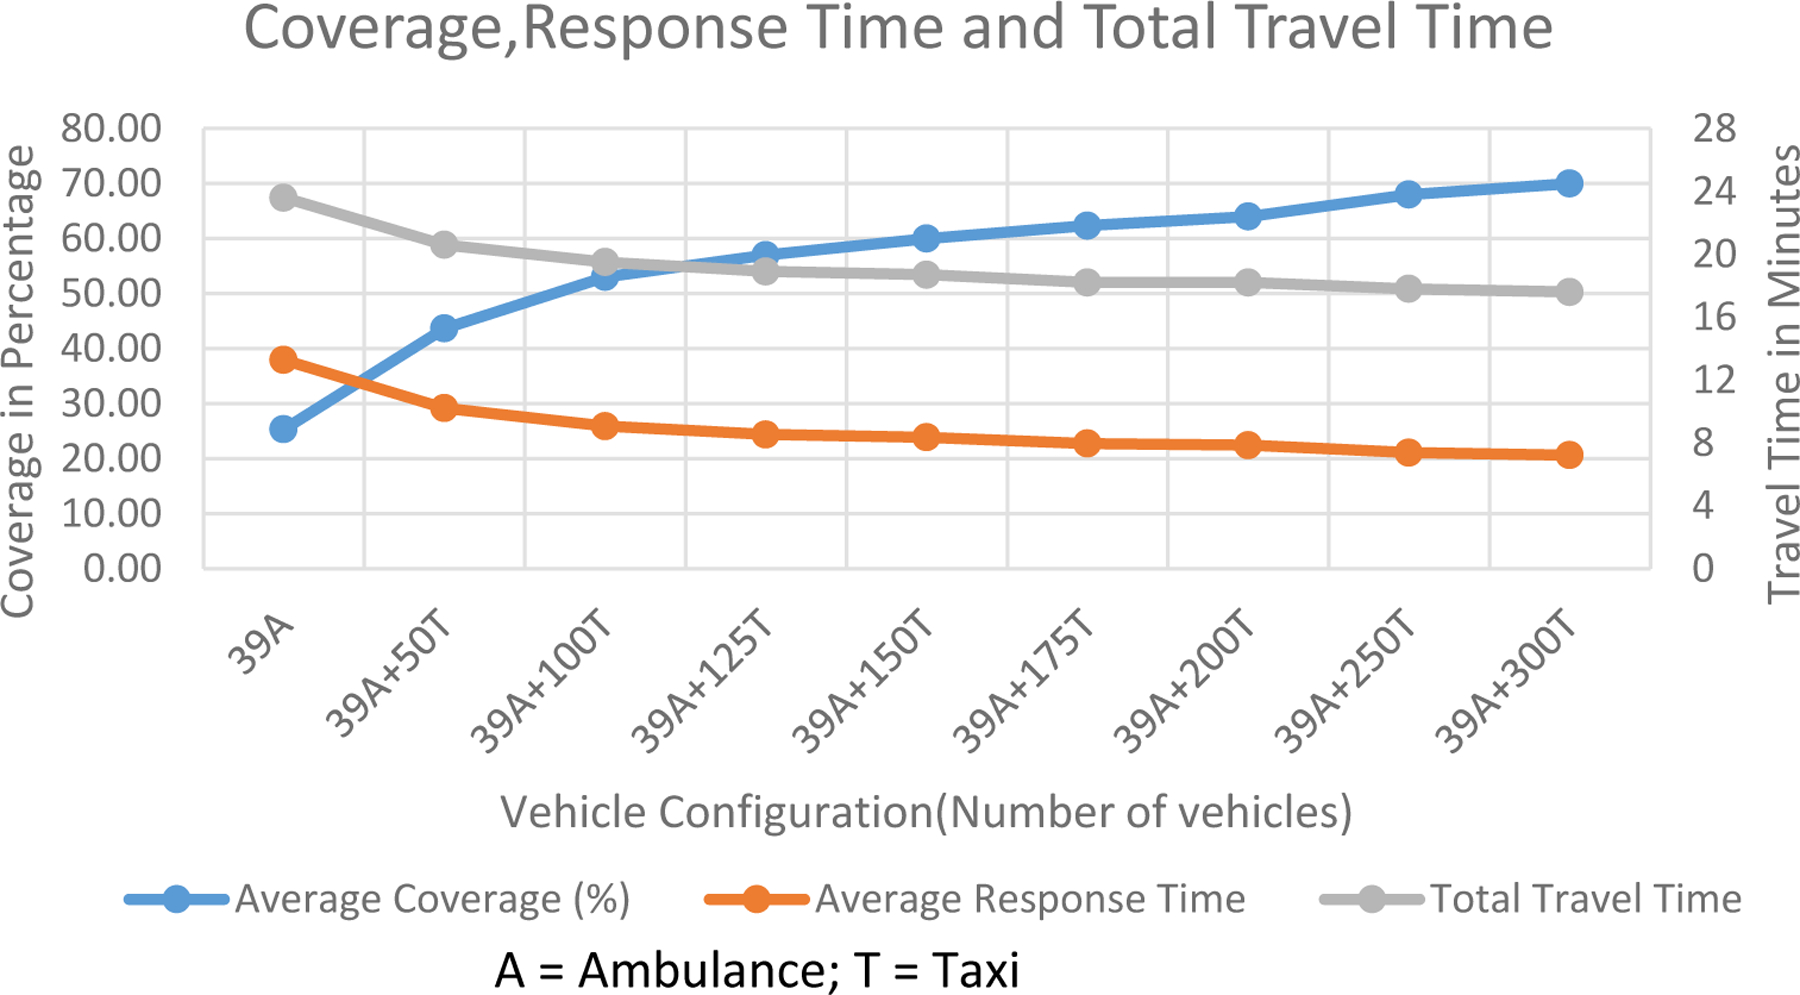
Response time curve for ambulance and taxi based emergency response system, A= Ambulance, T = Taxi
Response Time Estimation based on Google Maps API
Travel time based on Google Maps distance matrix API has been used to calculate distance and travel time between the identified nearest service vehicle (ambulance or taxi) to the crash location and thereafter from crash location to identified nearest hospital (Yang and Hsu 2016; Ahuja, Tiwari, and Bhalla 2019). Google maps has proven to be of value in estimating distance and travel time. In terms of service, number of hits to API are restricted by google to 1500–2000 depending on API called for (Ahuja, Tiwari, and Bhalla 2019).The results are obtained in JSON/XML format , from which distance and travel time is extracted and stored in text format for further use. Although, google accounts on-street congestion while calculating travel time, this congestion is when the API request hits google maps and not on-street congestion at the time of crash. The travel time results thus obtained are average and only representative of the scenario and not the actual travel time that was taken at the time of servicing the crash site. The combinations of vehicles used for the simulation process in each iteration of this study are Ambulances (A) and Taxis (T).The following combinations were simulated in the study:
A = 39
(A +T)1 = 39+50
(A+T)2 = 39+100
(A+T)3 = 39+125
(A+T)4 = 39+150
(A+T)5 = 39+175
(A+T)6 = 39+200
(A+T)7 = 39+250
(A+T)8 = 39+300 respectively.
Conditions used in Simulation
Demand and service points :Stationary
Vehicle configuration : Only vehicle travel time is considered where vehicle configuration is assumed to be four-wheeler
Priority: Ambulance and taxi are assigned same priority
Regulation and On site time: Not accounted
Travel time estimation: Google Maps Distance Matrix API is used to calculate distance and travel time for origin destination combination at the time at which API hits the map services. To account for temporal variation in travel time, we stagger the hits across the day, increase the number of simulation runs for same combination of hospitals, crashes and vehicles and finally average all the simulation runs for travel time results.
RESULTS AND DISCUSSION
Response Time
The response time curve as obtained from the developed simulation model is presented in Figure 2.Response time trend is decreasing with the incremental addition of taxis to the system. The transition phase in response time is observed at the interface of 100–125 taxis. At a threshold of 150 taxis, no further significance in reduction in slope of the curve is observed. The simulation is repeated with higher number of taxis (up to 300) in addition to 39 ambulances. The stability in the slope of the curve shows 175 could be taken as the cut-off point for achieving response time of 8 minutes.
Comparison of simulation model with government ambulance operations data
The comparison of results for government provided ambulance vs simulation (Figure 2) has been done to assess the variation in the simulation system performance as compared to on road operations. Initially, model validation was evaluated by comparing with government ambulance call statistics. 2–3 minutes deviation is observed in simulation vs. real data which is similar to the call response and dispatch time before ambulance leaves the base station (Sharma and Brandler 2014). After normalizing for only ambulance, further simulations were performed for ambulances and combination of ambulances (A) and taxis (T). The results show the response time is highest with government ambulance only (39 ambulances) and lowest at 300 taxis + 15% ambulance as expected. The observed sample variance in response time for field data is 0.42 while for simulated data is 0.093. The transition can be seen at each iteration, the change in response time is gradually decreasing and the results are constant at the later stages of simulation. The saving of time is about 5.3 minutes from the government ambulance service data at threshold value.
Total Travel Time
The drop off time (travel transfer time from the crash site to the nearest hospital) has been assessed and added to the response time to obtain total travel time, while on-site time wasn’t accounted in total travel time calculation (Figure 2). The drop off time remained same and did not show much variation even after multiple simulations. The reason for this could be that the locations of the crashes from resource data are fixed and nearest hospital locations are predefined as per government ambulance systems. This means, every time the iteration fetches the same time between the crash site and respective nearest hospital. The only variation would come when referral mechanism is accounted, which for the timing has not been considered in the simulations as aim was to see the generic trend of the system and not specific trend.
Coverage
As defined in the previous sections, the study targeted 90% coverage for response time of <= 8 minutes. The model could not deliver beyond 70% coverage even with addition of vehicles ~10 times the initial selection (Figure 2). It actually depends on its spatial availability. The coverage is gradually increasing with more taxis and at later stages, is not highly significant. This incites us to rethink the basis of standards that we have in place which require 75–90% of population to be covered within 8 min (Information and Authority 2010). Also, spatial distribution of formal services jeopardizes the coverage of lesser demand regions (only 24% coverage), where more presence of taxis on streets tends to improve the availability and could thus be used as backup systems in circumstances of special need such as specific high frequency events, which here is road crash but could also be cardiac arrest, falls etc. depending on the community requirements.
Travel Distance per Event
It is the distance travelled by the vehicle to reach at the crash site. As expected, with more services, the travel distance to crash site is reduced. The average travel distance reaches almost half at 175 taxis. This may result is saving of running cost. The average results of the simulation sets for the distance (km) per event is shown in figure 3. On an average, about 2 km distance is saved by improving the availability of vehicles by 4 times. Achieving these standards may not be cost effective by using ambulances alone, giving us a window of exploring these relations that if other modes of transport are embedded in the system and used as per requirement.
Figure 3:

Distance travelled per event, A= Ambulance, T = Taxi
CONCLUSION AND RECOMMENDATIONS
The response time for any emergency is crucial and early medical attention to life threatening incidents could increase the chances of survival. In current study, the response time for high priority events such as road traffic crashes has been assessed for the actual demand from government ambulance service database and we observe possible scope of improvement to bring system performance within international standards. Possibility of using three and four wheeler taxis as backup to current system and then evaluating at what contribution of these systems could enable international performance standards is explored and found as significant contributor to performance goals. In terms of facilities, taxis tend to act similar to patient transport ambulance. Results show that addition of about 4 times the existing contributing vehicles to ambulance services has a potential to bring down the ambulance performance standards within international standards. The maximum coverage achieved at this standard is limited to 60 – 65%. To improve the coverage as a future application scope, simulation could be advanced to dynamic system simulation. This will increase the complexity of evaluation but might better achieve the true operational performance and shall lead to recommendation of required systemic improvements to achieve higher coverage.
Emergency Medical Technicians and paramedics deployed in ambulances are trained in basic life support and are equipped to provide first aid to the patients until they reach specialised care facilities like hospitals, trauma centres etc. In deploying alternative mechanisms like taxi systems, patient handling issues by the taxi drivers is a concern as they may not be adequately trained. Given the girth of the problem and acknowledging the role of bystanders in transporting crash victims, Delhi Road Safety Policy requires state to train all commercial vehicle drivers in First Aid Trauma Care. This training includes course on basic life support and rescue systems and information about emergency services. The program aims to give commercial license holders information, training and confidence to provide basic lifesaving care to road crash victims until the victims receive adequate specialized care (Transport Department 2018). This step if enforced efficiently by the state could provide adequate knowledge to the identified taxi responders. This training should be supplemented with some field exposure to these volunteers, first aid toolkit supply and regular training for sustained skill management. Delhi government has also implemented a policy of incentivising any bystander who brings the road crash victim to the hospital by 2000 INR(Bhalla et al. 2019). This policy could be leveraged to compensate taxi drivers for their time spent in helping the victims.
LIMITATIONS
Availability of taxis is subject to their individual, day to day operation timings and their prior occupancy either with a passenger or with prior engagement with proposed crash response system.
For instance, unlike ambulances, taxis aren’t available 24 hours per day. So, in the proposed system with identified 175 taxis, if a crash happens at an odd hour like 3am, we might find very few taxis available close by some locations, which will increase the response time for the nearest taxi to reach crash site. Finally, the current methodology does not model congestion. It only models the average traffic conditions at the previously identified crash locations. It is also not modelling the effect of the congestion that is caused by the crash.
CONTRIBUTION OF THE STUDY
The results obtained from the above analysis show decent improvement in the service and operation attributes. The methodology shows the significance of conservatively adding services. The response time and coverage are the two important parameters which indicate the performance of an EMS system. The study shows how the performance of the system changes with the changes in the service points and its locations. Further, the cost effectiveness of the system can be achieved by utilizing available resources for the respective alternate purpose. In this analysis, the performance of Delhi ambulance service can be improved by introducing an adjunct transportation facility to the conventional ambulance transport offering quicker and cheaper EMS service. The above analysis computes the performance of the EMS operations by iteratively improving vehicle availability in the system for current demand and demonstrates a methodology to evaluate backup capacity systems for “cause specific” events like road traffic injuries or mass casualty events. The strategy could be more effective for low and middle income countries where it’s harder to build cost intensive systems for shorter duration. It has potential to generate more job opportunities for auto (three wheeler taxi) or taxi drivers and cater to natural human satisfaction derived from helping people in need. Owing to its low cost implementation, for the benefit of users and service providers, piloting the project in communities and calibrating according to community specific needs could aid in improving their existing system substantially. In the present age where trajectory data presence is increasing and data mining technologies are becoming handier, we could identify about 175 to 200 drivers based on their spatial availability and train them at regular intervals after recruiting into the system. This potential resource then becomes available as supplement to the existing emergency services in times of need without much investment.
ACKNOWLEDGEMENTS
The paper concept was discussed with Prof. Dinesh Mohan (Indian Institute of Technology Delhi, New Delhi, India), Dr. Mathew Varghese (St. Stephen’s Hospital, Delhi, India) and Prof. Girish Agrawal (OP Jindal Global University, Sonipat, Haryana, India). We are thankful for guidance and comments provided by them.
We are grateful to Department of Transport, Delhi and Delhi Integrated Multi Modal Transit System Ltd (DIMTS) for their support in accessing taxi trajectory data. We thank Ms. Jyoti, Application Developer, for assistance to develop simulation program for this study.
FUNDING
This study was partially supported by National Institute of Health, US (NIH) /Fogarty grant (1R21TW010168).
Footnotes
DATA AVAILABILITY STATEMENT: No data is available
Contributor Information
Vipul Mishra, Department of Civil Engineering, Indian Institute of Technology, Delhi, India, 110016,.
Richa Ahuja, Transportation Research Injury Prevention Programme (TRIPP), Indian Institute of Technology, Delhi, India, 110016; Department of Civil Engineering, Indian Institute of Technology, Delhi, India, 110016.
N. Nezamuddin, Department of Civil Engineering, Indian Institute of Technology, Delhi, India, 110016
Geetam Tiwari, Transportation Research Injury Prevention Programme (TRIPP), Indian Institute of Technology, Delhi, India, 110016; Department of Civil Engineering, Indian Institute of Technology, Delhi, India, 110016.
Kavi Bhalla, Public Health Sciences, University of Chicago Biological Sciences Division, Chicago, Illinois, USA.
REFERENCES
- Aboueljinane L, Jemai Z, and Sahin E. 2012. Reducing Ambulance Response Time Using Simulation: The Case of Val-de-Marne Department Emergency Medical Service. In Proceedings - Winter Simulation Conference, 1–12. Berlin, Germany: IEEE. [Google Scholar]
- Ahuja R, Tiwari G, and Bhalla K. 2019. Going to the Nearest Hospital vs. Designated Trauma Centre for Road Traffic Crashes: Estimating the Time Difference in Delhi, India. International Journal of Injury Control and Safety Promotion 26, no. 3: 1–12. 10.1080/17457300.2019.1626443. [DOI] [PMC free article] [PubMed] [Google Scholar]
- Arbon P, and Hayes J. 2007. First Aid and Harm Minimisation for Victims of Road Trauma : A Population Study. [DOI] [PubMed]
- Bhalla K, Sriram V, Arora R, Ahuja R, Varghese M, Agrawal G, Tiwari G, and Mohan D. 2019. The Care and Transport of Trauma Victims by Layperson Emergency Medical Systems: A Qualitative Study in Delhi, India. BMJ Global Health 4, no. 6. [DOI] [PMC free article] [PubMed] [Google Scholar]
- Björnstig U 2004. Pre-Hospital Emergency Care in Sweden. IATSS Research 28, no. 2: 24–31. [Google Scholar]
- Debas Haile T., Peter Donkor, Atul Gawande, Jamison Dean T., Kruk Margaret E., and Mock Charkes N., eds. 2012. Disease Control Priorities: Essential Surgery. 3rd ed. The World Bank. 10.1016/j.tws.2012.02.007. [DOI] [PubMed] [Google Scholar]
- Deloitte Touche Tohmatsu India Pvt. Ltd. 2013. Assessment of Emergency Response Service ( ERS ) Performance in Madhya Pradesh.
- Derpanis KG 2010. Overview of the RANSAC Algorithm. Image Rochester 4, no. 1: 2–3. [Google Scholar]
- Fischler MA, and Bolles RC. 1981. Random Sample Consensus: A Paradigm for Model Fitting with Applications to Image Analysis and Automated Cartography. Communications of the ACM 24, no. 6: 381–395. [Google Scholar]
- Fitzgerald M, Dewan Y, Reilly GO, Mathew J, and Mckenna C. 2006. India and the Management of Road Crashes: Towards a National Trauma System. Indian Journal of Surgery 68, no. 4: 226–232. http://scholar.google.com/scholar?hl=en&btnG=Search&q=intitle:India+and+the+management+of+road+crashes+:+Towards+a+national+trauma+system#0. [Google Scholar]
- Information H, and Authority Q. 2010. Pre-Hospital Emergency Care Key Performance Indicators for Emergency Response Times. Health (San Francisco)no. November: 1–82. [Google Scholar]
- Joshi A, Rajhans P, Galwankar S, Arquilla B, Swaroop M, Stawicki S, Das B, Aggarwal P, Bhoi S, and Kalra OP. 2013. Academic College of Emergency Experts in India’s INDO-US Joint Working Group (JWG) White Paper on the Integrated Emergency Communication Response Service in India: Much More than Just a Number! Journal of Emergencies, Trauma and Shock 6, no. 3: 216–223. [DOI] [PMC free article] [PubMed] [Google Scholar]
- Kumar Gupta S, Kumar N, Thergaonkar A, Rajan Singh A, Singh SK, and Pradeep Mehta S. 2011. Report of the Working Group on Emergency Care in India. [Google Scholar]
- Lam SSW, Nguyen FNHL, Ng YY, Lee VPX, Wong TH, Fook-Chong SMC, and Ong MEH. 2015. Factors Affecting the Ambulance Response Times of Trauma Incidents in Singapore. Accident Analysis and Prevention 82 (September): 27–35. [DOI] [PubMed] [Google Scholar]
- Larsson EM, Mártensson NL, and Alexanderson KAE. 2002. First-Aid Training and Bystander Actions at Traffic Crashes-A Population Study. Prehospital and Disaster Medicine 17, no. 3: 134–141. [DOI] [PubMed] [Google Scholar]
- Lee E 2014. Designing Service Coverage and Measuring Accessibility and Serviceability of Rural and Small Urban Ambulance Systems. Systems 2, no. 1: 34–53. http://www.mdpi.com/2079-8954/2/1/34/. [Google Scholar]
- Oxer HF 1999. Simple First Aid Can Save Lives in Traffic Crashes. Perth: WA Inc. [Google Scholar]
- Radjou AN, Mahajan P, and Baliga DK. 2013. Where Do I Go? A Trauma Victim’s Plea in an Informal Trauma System. Journal of Emergencies, Trauma and Shock 6, no. 3: 164–170. [DOI] [PMC free article] [PubMed] [Google Scholar]
- Raguram R, Frahm JM, and Pollefeys M. 2008. A Comparative Analysis of RANSAC Techniques Leading to Adaptive Real-Time Random Sample Consensus. In Lecture Notes in Computer Science (Including Subseries Lecture Notes in Artificial Intelligence and Lecture Notes in Bioinformatics), ed. Forsyth D, Torr P, and Zisserman A, 5303 LNCS:500–513. Berlin, Heidelberg: Springer Berlin Heidelberg. [Google Scholar]
- Roy N, Murlidhar V, Chowdhury R, Patil SB, Supe PA, Vaishnav PD, and Vatkar A. 2010. Where There Are No Emergency Medical Services-Prehospital Care for the Injured in Mumbai, India. Prehospital and Disaster Medicine 25, no. 2 (April): 145–151. [DOI] [PubMed] [Google Scholar]
- Schmid V, and Doerner KF. 2010. Ambulance Location and Relocation Problems with Time-Dependent Travel Times. European Journal of Operational Research 207, no. 3 (December): 1293–1303. [DOI] [PMC free article] [PubMed] [Google Scholar]
- Sharma M, and Brandler ES. 2014. Emergency Medical Services in India: The Present and Future. Prehospital and Disaster Medicine 29, no. 3: 307–310. [DOI] [PubMed] [Google Scholar]
- Singh AR, and Gupta SK. 2014. Review of the Centralized Accident and Trauma Services (CATS) in New Delhi, India. Cibtech Journal of Bio-Protocols ISSN 3, no. 1: 2319–384045. [Google Scholar]
- Singh SK 2017. Road Traffic Accidents in India: Issues and Challenges. Transportation Research Procedia 25: 4708–4719. [Google Scholar]
- Transport Department, G. of N. of D. 2018. Road Safety Policy.
- World Health Organization. 2015. Global Status Report on Road Safety.
- Yang SY, and Hsu CL. 2016. A Location-Based Services and Google Maps-Based Information Master System for Tour Guiding. Computers and Electrical Engineering 54 (August): 87–105. [Google Scholar]