

Abstract
Microphthalmia-associated transcription factor (MiT) family aberration-associated renal cell carcinomas (MiTF-RCC) is a subtype of renal cell carcinoma harboring recurrent chromosomal rearrangements involving TFE3 or TFEB genes. MiTF-RCC is morphologically diverse and can histologically resemble common RCC subtypes like clear cell RCC and papillary RCC, and often poses a diagnostic challenge in genitourinary clinical and pathology practice. To characterize the MiTF-RCC at molecular level and identify biomarker signatures associated with MiTF-RCC, we analyzed RNAseq data from MiTF-RCC, other RCC subtypes and benign kidney. Upon identifying TRIM63 as a cancer-specific biomarker in MiTF-RCC, we evaluated its expression independently by RNA in situ hybridization (RNA-ISH) in whole tissue sections from 177 RCC cases. We specifically included 31 cytogenetically confirmed MiTF-RCC cases and 70 RCC cases suspicious for MiTF-RCC in terms of clinical and morphological features, to evaluate and compare TRIM63 RNA-ISH results with the TFE3/TFEB fluorescence in situ hybridization (FISH) results, which is the current clinical standard. We confirmed that TRIM63 mRNA was highly expressed in all classes of MiTF-RCC compared to other renal tumor categories, where it was mostly absent to low. While the TRIM63 RNA-ISH and TFE3/TFEB FISH results were largely concordant; importantly, TRIM63 RNA-ISH was strongly positive in TFE3 FISH false-negative cases with RBM10-TFE3 inversion. In conclusion, TRIM63 can serve as a diagnostic marker to distinguish MiTF-RCC from other renal tumor subtypes with overlapping morphology. We suggest a combination of TFE3/TFEB FISH and TRIM63 RNA-ISH assays to improve the accuracy and efficiency of MiTF-RCC diagnosis. Accurate diagnosis of MiTF-RCC and other RCC subtypes would enable effective targeted therapy and avoid poor therapeutic response due to tumor misclassification.
Keywords: renal cell carcinoma, RNA in situ hybridization, next-generation sequencing, TFE3, TFEB, TRIM63, MiTF, translocation, amplification
Introduction
Microphthalmia-associated transcription (MiT) family aberration-associated renal cell carcinoma (MiTF-RCC) account for approximately 40% of pediatric RCC and 5% of adult RCC, afflicting a larger number of adult patients due to higher absolute prevalence 1,2. MiTF-RCC comprises the Xp11 translocation RCC harboring TFE3 gene fusions involving multiple 5’ gene fusion partners, t(6;11) translocation RCC mostly harboring MALAT1-TFEB gene fusion, and RCC with TFEB amplification 3–5. TFE3 and TFEB are members of the melanocyte inducing transcription factor gene family, known to regulate the differentiation of melanocytes and osteoclasts. These genomic aberrations drive overexpression of TFE3 or TFEB, leading to the transcriptional activation of multiple targeted genes and promote oncogenicity 3,6. The clinical behavior of Xp11 translocation RCC and TFEB amplification RCC is relatively aggressive with prognosis similar to clear cell RCC (CCRCC) and worse than papillary RCC (PRCC) 7. Interestingly, within the MiTF-RCC category, it was observed that RCC patients harboring TFEB fusion may have better prognosis compared to those with TFEB amplification 8.
MiTF-RCC demonstrate a wide morphologic spectrum. Microscopically, Xp11 TFE3 translocation RCC may display a branching, nested, or papillary architecture with large, epithelioid cells exhibiting clear to eosinophilic cytoplasm. The t(6;11) TFEB translocation RCC, on the other hand, often demonstrate a nested architecture with relatively clear cells and a minor population of small, eosinophilic cells with hyperchromatic nuclei. The most recently described TFEB amplified renal cell carcinoma have been relatively recently described 9, are morphologically heterogeneous, and often enriched for oncocytic and papillary features. Despite the distinct underlying genomic aberrations, the three subtypes of MiTF-RCC demonstrate overlapping morphologic features amongst themselves and may also exhibit a resemblance with CCRCC, PRCC, clear cell papillary RCC (CCPRCC) and other well-described renal tumor entities 2,4. The Cancer Genome Atlas Network (TCGA) reported in their initial study that 5 of the 416 CCRCC samples harbor the SFPQ-TFE3 fusion with wild type VHL 10; in the follow-up pan-RCC study, these tumors were appropriately reclassified as TFE3 translocation RCC based on the presence of these gene fusions 11, suggesting that these cases are actually MiTF-RCC morphologically resembling CCRCC. As morphologic assessment alone often cannot faithfully distinguish MiTF-RCC from other renal tumor subtypes, additional ancillary tools are needed. The current diagnostic workup for patients with tumors clinically and/or morphologically suspicious for MiTF-RCC includes immunohistochemistry (IHC) for markers such as paired box 8 (PAX8), pan-cytokeratin, epithelial membrane antigen (EMA), carbonic anhydrase IX (CAIX), melanocytic markers (Melan-A and HMB-45) 12–14 and osteoclastic protein Cathepsin K 14–16; unfortunately none of the IHC markers listed above, including TFE3 and TFEB 17,18, are very sensitive or specific for a diagnosis of MiTF-RCC19,20. Currently, the gold standard methodology for confirmation of MiTF-RCC diagnosis encompasses a dual-color, break-apart fluorescence in situ hybridization (FISH) assay for TFE3 and TFEB loci rearrangement. However, the assay is labor-intensive and data interpretation is time-consuming, limiting its applicability for routine clinical use in daily surgical pathology practice.
From a clinical standpoint, it is important to distinguish between MiTF-RCC from CCRCC and other RCC subtypes, because MiTF-RCC patients may show variable responsiveness to the standard first-line treatment protocol for CCRCC 4,17 that is invariably used to treat all advanced renal malignancies. Evidence shows that MiTF-RCC might benefit from immune checkpoint therapies or therapies targeting the PI3K/ALT/mTOR pathway 21–23. While clear cell renal cell carcinoma have been traditionally been the main focus of investigation for systemic therapies, recent data from SWOG1500 and other studies indicated that papillary renal cell carcinoma and other renal tumors (including MiTF-RCC) demonstrate better response to alternative therapies like Cabozantinib 24,25. Finally, the precise molecular subtyping of tumors could provide better understanding of the variations in treatment responsiveness and effectiveness with combinatorial therapies. For example, the efficacy is likely to vary when immunotherapy is combined with targeted kinase inhibitors, as the targeted kinases themselves may exhibit subtype specific differential expression.
In order to better characterize MiTF-RCC at the molecular level and identify specific tumor biomarkers, we performed integrative analysis of next-generation RNA sequencing (RNAseq) data from >1000 TCGA RCC specimens, in-house rare RCC subtype, as well as matched normal kidney specimens and nominated candidate biomarkers for MiTF-RCC. Following preliminary evaluation of top 3 candidates by RNA in situ hybridization (RNA-ISH), we chose TRIM63 to characterize in more detail. In this study, we examined the expression levels of TRIM63 in a cohort of 177 RCC cases and 8 renal angiomyolipoma (AML) cases using RNA-ISH and compared results to the TFE3/TFEB FISH assay data.
Materials and methods
RCC Cohorts
This study was performed under Institutional Review Boards-approved protocols (with waiver for informed consent). Patient samples were obtained from the University of Michigan Health System, Johns Hopkins Medical Institutions, and Memorial Sloan Kettering Cancer Center. The cohort contains 31 cytogenetically confirmed MiTF-RCC (age range 3–78 years, median 57); and 70 cases clinically and morphologically suspected to be MiTF-RCC with available confirmatory FISH data for TFE3/TFEB gene aberrations (age range 15–88 years, median 56.5). All the cases from this cohort have not been reported in any previous publications. Amongst the other diverse common and uncommon RCC subtypes, we interrogated 10 CCRCC, 12 PRCC (including 9 historically named type 1 PRCC and 3 historically named type 2 PRCC), 15 classic chromophobe RCC (ChRCC), 6 eosinophilic ChRCC, 5 CCPRCC, 6 oncocytoma, 5 mucinous tubular and spindle cell carcinoma (MTSCC), 3 hereditary leiomyomatosis and renal cell cancer (HLRCC)-associated RCC, 1 succinate dehydrogenase B (SDHB)-deficient RCC, 2 hybrid oncocytic/chromophobe tumor (HOCT), 2 eosinophilic solid and cystic (ESC) RCC, as well as 5 CCRCC and 4 ChRCC metastases (Supplementary Table 1). We also evaluated one type of renal mesenchymal neoplasm (angiomyolipoma/AML) which could be a differential diagnosis of MiTF-RCC, including 3 cases of epithelioid AML and 5 of classic AML. All cases were re-reviewed by multiple study pathologists (R. Mannan, S. Skala and R. Mehra) for diagnostic confirmation by histopathology and immunohistochemistry panels. TFE3/TFEB break-apart FISH assay was performed on duplicate slides for each case and evaluated by multiple study investigators (H. Xiao, B. Betz, N. Brown and R. Mehra). The break-apart signals were evaluated in 200 interphase nuclei per slide. A FISH-positive case was defined as one where more than 30% tumor cells showed break-apart signals; and conversely a FISH-negative case was defined as one where less than 20% tumor cells showed break-apart signals; Cases where break-apart signals were found in 20-30% tumor cells were categorized as FISH indeterminate. 8
Biomarker nomination
MiTF-RCC RNAseq data was collected from 4 in-house cases and 13 published cases in the TCGA papillary renal cell carcinoma cohort 26, and compared to RNAseq data of major RCC subtypes (CCRCC, PRCC and ChRCC) from TCGA (n=998, including matched normal) and rare RCC subtypes (n=51, including matched normal) from the Michigan Center for Translational Pathology (total n=1049). Raw sequencing reads were processed as previously described 27,28. MiTF-RCC specific genes were identified by differential expression analyses performed with limma 29 on voom-transformed count data 30 utilizing R package. Differentially expressed genes with Benjamini-Hochberg (BH) adjusted p<0.05 and fold-change>=2 were selected as candidate MiTF-RCC biomarkers.
RNA in situ hybridization (RNA-ISH)
RNA-ISH was performed using the RNAscope 2.5 HD Brown kit (Advanced Cell Diagnostics/ACD, Newark, CA) and target probe against TRIM63 (532291 Hs-TRIM63 targeting NM_032588.3 270-1396nt) according to the manufacturer’s instructions. RNA quality was evaluated in each case utilizing a positive control probe against human housekeeping gene Peptidylprolyl Isomerase B (PPIB) (313901). Assay background was monitored using a negative control probe against bacillus bacterial gene DapB (310043). Formalin fixed paraffin embedded (FFPE) tissue sections were deparaffinized following a previously utilized and published protocol 27,28. After hydrogen peroxide treatment and target retrieval in citrate buffer, the tissue sections were permeabilized using protease and hybridized with target probe in the HybEZ oven at 40 °C for 2 hours. After a series of signal amplification steps, chromogenic detection was performed using 3,3′-diaminobenzidine (DAB), followed by counterstaining with 50% Gill’s Hematoxylin I (Fisher Scientific, Rochester, NY) and bluing with ammonium hydroxide (RICCA, Arlington, TX).
Stained slides were evaluated under light microscope at 100x and 200x magnification for RNA-ISH signals in neoplastic cells by multiple study investigators (X. Wang, R. Mannan and R. Mehra). Each RNA molecule in this assay result is represented as a punctate brown dot. The expression level was evaluated according to the RNAscope scoring criteria: score 0 = no staining or <1 dot per 10 cells; score 1 = 1-3 dots per cell, score 2 = 4-9 dots per cell and no or very few dot clusters; score 3 = 10-15 dots per cell and <10% dots in clusters; score 4 = >15 dots per cell and > 10% dots in clusters. The H-score was calculated for each examined tissue section as the sum of the percentage of cells with score 0-4 [(A%x0)+(B%x1)+(C%x2)+(D%x3)+(E%x4), A+B+C+D+E=100], using previously published scoring criteria 27,28.
Statistical analysis
All statistical analyses were performed using R, v3.6.0. The area under the receiver operating characteristic (ROC) curve (AUC), which plots percentage sensitivity against 1 minus percentage specificity, was used to evaluate the diagnostic performance of the TRIM63 RNA-ISH assay. Clinical diagnosis based on FISH assessment and sequencing analysis was used as the gold standard in the ROC analysis. The optimal cutoff of H-score to define positive and negative cases was chosen to yield the highest specificity. The ROC analysis was implemented with R package pROC. 31 The statistical significance of H-score between positive and negative cases defined by TFE3/TFEB FISH was determined using Wilcoxon signed-rank test. Statistical significance was defined as a p-value <0.05.
Results
Nomination of Cancer-specific Biomarkers in MiTF-RCC
First, we compared RNAseq data from MiTF-RCC with other RCC subtypes and benign kidney tissues and identified 734 up- and 355 down-regulated genes (fold-change >2, BH adjusted p-value < 0.05) (Figure 1A); the up-regulated genes were observed to be highly specific to MiTF-RCC (Figure 1B) with TRIM63, NMRK2, and HHATL ranked as the top candidates. According to the violin plot, TRIM63 showed the best specificity among the top up-regulated genes (Figure 1C). The expression profile in normal human tissues (www.GTEXportal.org) showed all 3 genes to be enriched in benign muscle tissues, but absent in benign kidney tissue (Supplementary Figure 1).
Figure 1.
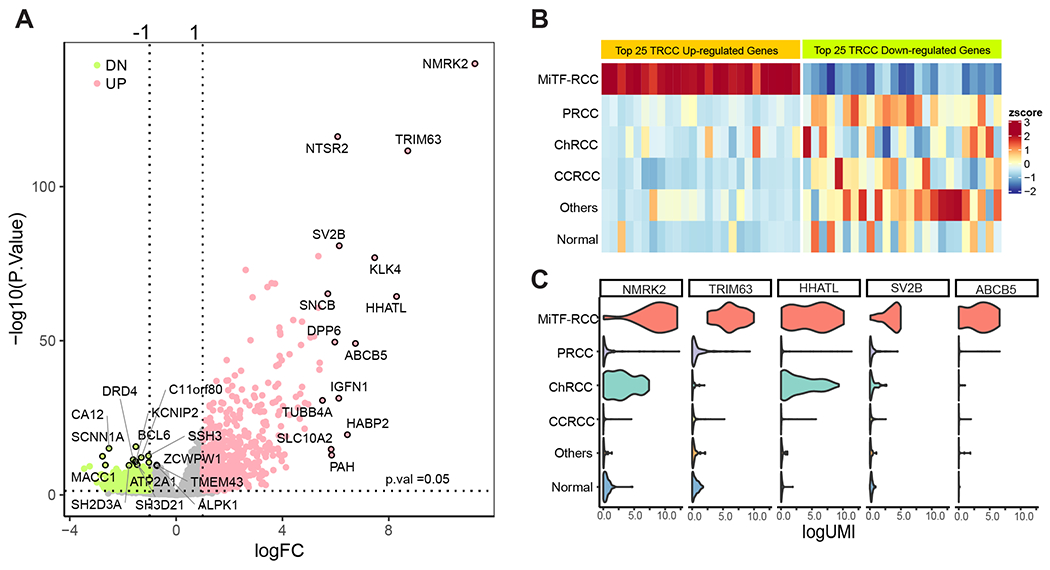
Nomination of cancer-specific biomarkers for MiTF-RCC. A) Volcano plot demonstrating significantly differentially expressed genes (fold-change >2, BH adjusted p-value < 0.05) in MiTF-RCC compared to other RCC subtypes and normal kidney. Pink dots: up-regulated genes (n=734); green dots: down-regulated genes (n=355); Selected top-ranking up- and down-regulated genes were circled and labeled. TRIM63, NMRK2, and HHATL were among the top-ranked up-regulated genes. B) Heatmap revealed top 25 candidate biomarkers that are highly specific to MiTF-RCC. RCC diagnoses from the TCGA RCC cohort were annotated on the left side of the heatmap. Cancer samples with high expression of candidate biomarkers were almost exclusively MiTF-RCC. C) Violin plot exhibiting the expression of top MiTF-RCC cancer-specific genes across major RCC subtypes. TRIM63 showed highest specificity to MiTF-RCC among the top candidates. MiT Family Aberration-Associated Renal Cell Carcinoma (MiTF-RCC), Papillary renal cell carcinoma (PRCC), chromophobe renal cell carcinoma (ChRCC), clear cell renal cell carcinoma (CCRCC) and benign renal parenchyma (normal).
TRIM63 expression is highly enriched in MiTF-RCC
Next, we confirmed the expression of TRIM63, NMRK2, and HHATL in MiTF-RCC and absence in adjacent benign kidney or other RCC subtypes by RNA-ISH in a pilot cohort (n=55) where TRIM63 expression showed maximal enrichment for this disease. Hence, based on the violin plot and pilot RNA-ISH observations, we chose to evaluate TRIM63 expression by RNA-ISH on whole tissue sections from 185 samples in an expanded renal neoplasm cohort representing both common and rare RCC subtypes as detailed in the methods section. 172 cases were included in the final analysis; 5 cases were excluded as they did not pass quality control parameters for RNA-ISH analyses. The TRIM63 expression by RNA-ISH staining and scoring results are summarized in Supplementary Table 1.
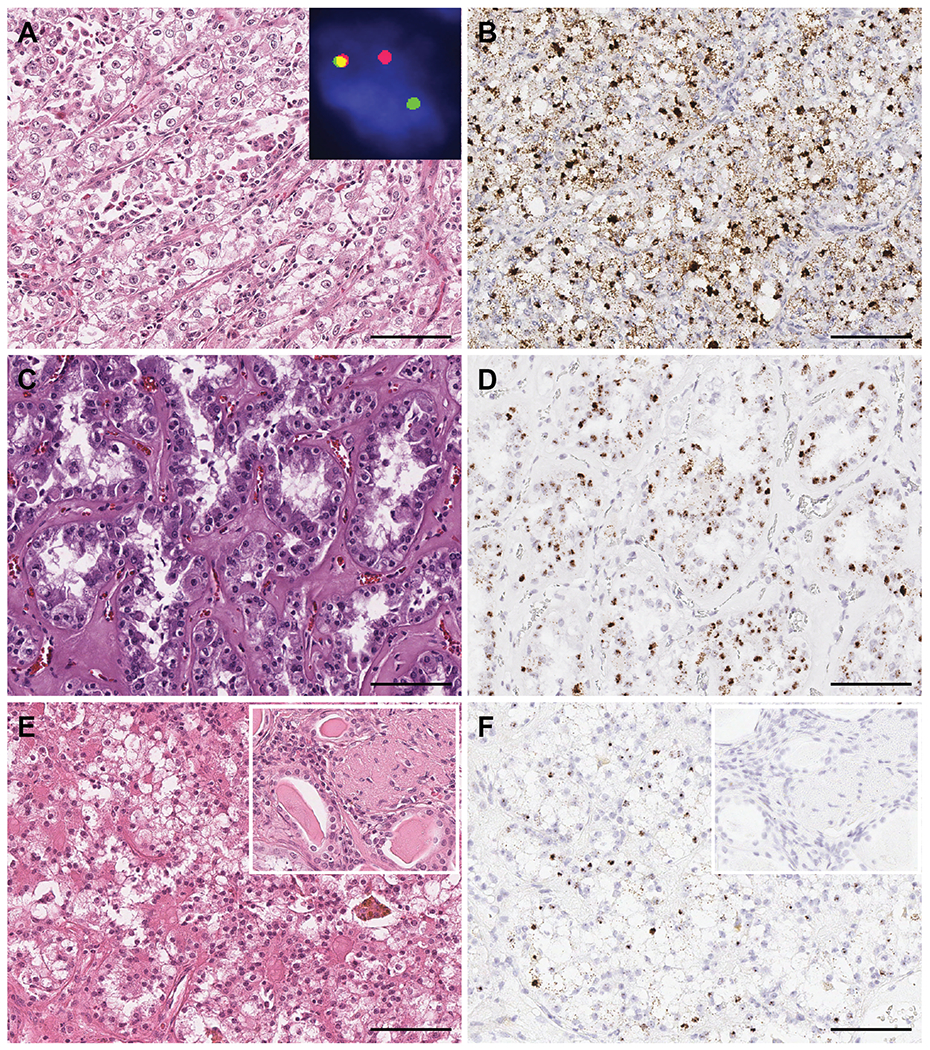
TRIM63 RNA-ISH signals presented as strong, punctate, brown dots in both the nucleus and cytoplasm of MiTF-RCC tumor cells (Figures 2–5). In contrast, no signals were detected in the adjacent background benign renal parenchyma (Figure 2 C, D). High level TRIM63 transcripts were detected in 25/28 (89%) cytogenetically confirmed MiTF-RCC cases, including 15/16 TFE3 translocation RCC (average H-score = 340) (Figures 2 and 3), 7/7 TFEB translocation RCC (average H-score = 359) (Figure 4), and 3/5 TFEB amplification RCC (average H-score = 315) (Figure 5).
Figure 2.
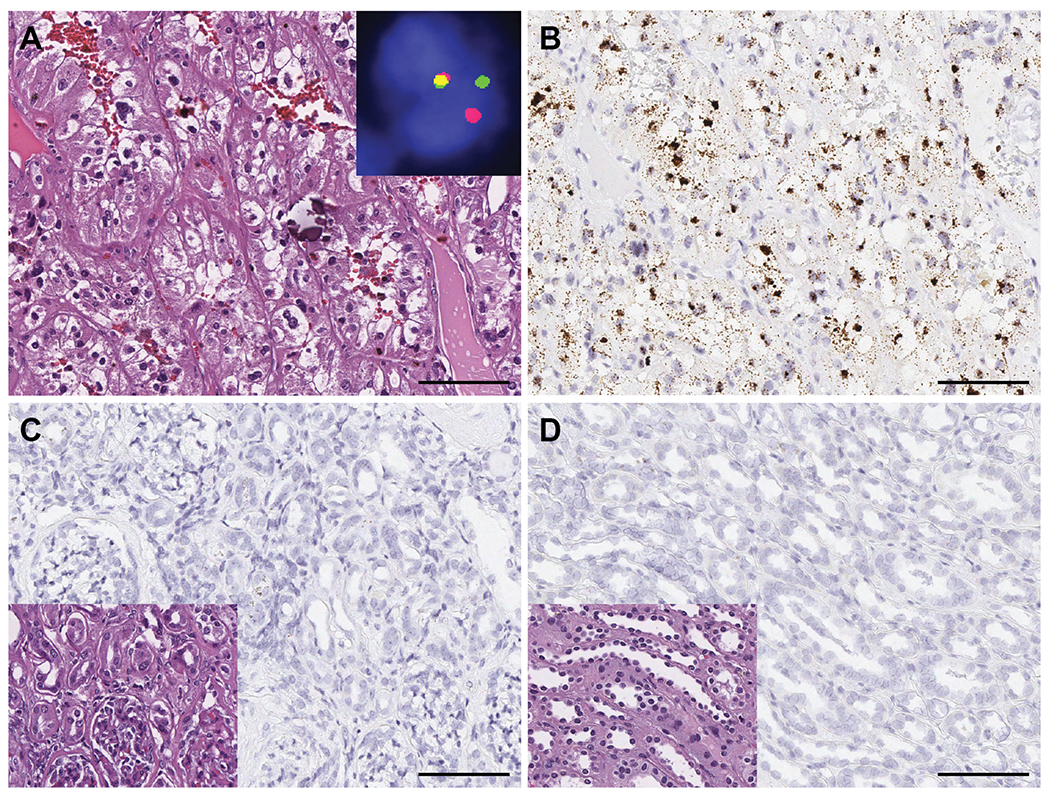
TRIM63 expression in TFE3 translocation RCC. A) TFE3 translocation RCC showing typical alveolar to nested growth pattern and clear to eosinophilic cells with voluminous cytoplasm, high grade nuclei and psammomatous calcification (H&E); inset demonstrated a TFE3 gene rearrangement by dual-color, break-apart FISH. B) TRIM63 over-expression in TFE3 translocation RCC by RNA-ISH. TRIM63 signals were enriched in nuclei and also observed in cytoplasm. C) and D) Absence of TRIM63 expression in renal cortex and medulla, respectively; inset: H&E. Scale bars = 100 microns.
Figure 5.
TRIM63 expression in TFEB amplification RCC and TFE3 FISH false-negative RBM10-TFE3 RCC. TRIM63 was highly expressed in A) and B) TFEB amplification RCC with oncocytic and papillary features; inset demonstrates TFEB gene amplification by dual-color, break-apart FISH; C) and D) TFEB amplification RCC with oncocytic and focal pleomorphic features; E) and F) TFEB amplification RCC with clear cell and eosinophilic features. H&E and TRIM63 RNA-ISH, respectively. G) and H) TRIM63 was highly expressed in two RBM10-TFE3 RCC cases with false-negative TFE3 FISH. Scale bars = 100 microns.
Figure 3.
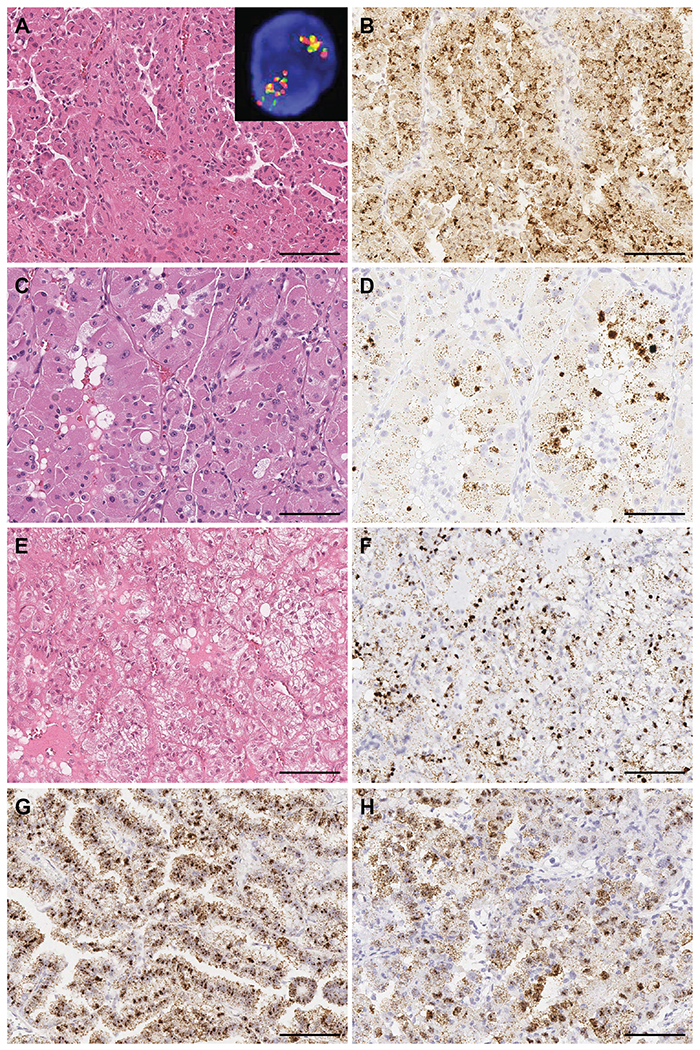
TRIM63 expression in TFE3 translocation RCC with various morphological features. TRIM63 was highly expressed in A) and B) TFE3 translocation RCC with clear cell features; C) and D) TFE3 translocation RCC with cystic pattern and clear cell features; E) and F) TFE3 translocation RCC resembling clear cell papillary RCC; and G) and H) TFE3 translocation RCC exhibiting nested pattern with individual tumor cells showing rhabdoid morphology. Showing H&E and TRIM63 RNA-ISH, respectively. Scale bars = 100 microns.
Figure 4.
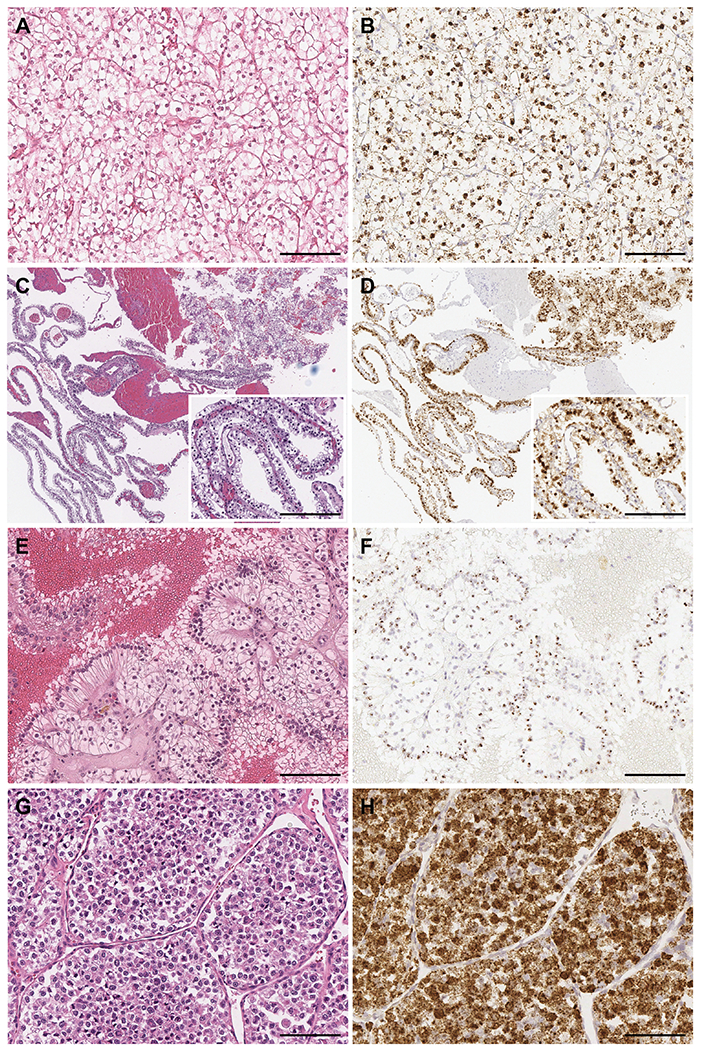
TRIM63 in TFEB translocation RCC with various morphological features. TRIM63 was highly expressed in A) and B) TFEB translocation RCC showing classical morphology of larger epithelioid cells with interspersed smaller eosinophilic cell clusters; inset demonstrates a TFEB gene rearrangement by dual-color, break-apart FISH; C) and D) TFEB translocation RCC exhibiting predominant tubular features; and E) and F) TFEB translocation RCC resembling clear cell RCC arising in a background of end stage renal disease (ESRD); inset in E: H&E of areas showing ESRD and inset in F: negative TRIM63 RNA-ISH in the ESRD kidney tissue. Showing H&E and TRIM63 RNA-ISH, respectively. Scale bars = 100 microns.
TRIM63 overexpression was observed consistently in a variety of TFE3 translocation RCC demonstrating a wide spectrum of morphologic features, including tumor cells with typical clear to eosinophilic cytoplasm with prominent nucleoli and psammomatous calcification (Figure 2 A, B), tumors enriched with clear cell features (Figure 3 A, B), cystic features (Figure 3 C, D), CCPRCC-like features (Figure 3 E, F), or rhabdoid features (Figure 3 G, H).
TRIM63 was also highly expressed in MiTF-RCC with TFEB rearrangements. Within the TFEB translocation RCC category, strong TRIM63 RNA-ISH signals were detected in tumors with typical biphasic features composed of nests of larger polygonal cells with abundant clear to eosinophilic cytoplasm and smaller epithelioid cells clustered around the basement membrane (Figure 4 A, B), as well as tumors enriched with tubular features (Figure 4 C, D). A patient with end-stage renal disease (ESRD) and a renal neoplasm consistent with TFEB translocation RCC exhibited strong TRIM63 signals in the neoplastic cells comprising the tumor otherwise seen to mimic a CCRCC; no signal was observed in the background renal parenchyma exhibiting ESRD changes (Figure 4 E, F). Among TFEB amplification RCC cases, TRIM63 overexpression was observed in tumors demonstrating oncocytic and papillary features (Figure 5 A, B), oncocytic and pleomorphic features (Figure 5 C, D), or clear cell and eosinophilic features (Figure 5 E, F).
No TRIM63 signals were detected by RNA-ISH in 90% (9/10) primary CCRCC, 91% (11/12) PRCC, 100% (5/5) CCPRCC, 100% (21/21) ChRCC, 100% (6/6) oncocytoma, 100% (5/5) MTSCC, 100% (3/3) HLRCC-associated RCC, one SDHB deficient RCC or one of two HOCT cases investigated in this cohort. TRIM63 signals were also absent in all evaluated cases of metastatic CCRCC and 75% (3/4) metastatic ChRCC. Very low TRIM63 signals were observed in one CCRCC (H-score = 13.5), one PRCC type 1 (H-score = 35), and one HOCT (H-score = 10); one muscle metastasis of chromophobe RCC showed focal TRIM63 signals with an H-score of 150; one ESC RCC showed low level of TRIM63 expression with an H-score of 45 and the other exhibited moderate expression with an H-score of 154 (Supplementary Figure 2 and 3). Besides the RCC cohort described above, we also evaluated TRIM63 expression in renal AML. We observed various levels of TRIM63 expression among AML (Supplementary Figure 4) where moderate to strong TRIM63 signals were observed in 2/3 epithelioid AMLs (average H-score = 203) and 5/5 classic AMLs (average H-score = 269) (Supplementary Table 1).
Strong TRIM63 expression is seen in TFE3 FISH false negative MiTF-RCC harboring RBM10-TFE3 gene fusion
We investigated TRIM63 expression in two TFE3 translocation RCC cases known to harbor cryptic intrachromosomal Xp11.2 inversion resulting in RBM10-TFE3 gene fusion. This genetic alteration has been shown to be missed by routine TFE3 break-apart FISH strategy 32. These two cases were diagnosed as MiTF-RCC by sequencing and hence included in the 28 cytogenetically confirmed cases. The TRIM63 RNA-ISH assay revealed strong and homogeneous signals in both of these cases (H-score of 395 and 338) (Figure 5 G, H).
TRIM63 overexpression can augment diagnosis among cases clinically and morphologically suspicious for MiTF aberrations
In order to systematically examine TRIM63 staining among cases previously evaluated by FISH, we purposefully tested 70 RCC cases that were clinically and morphologically suspected to be MiTF-RCC and hence further interrogated for MiTF aberrations. These suspicious cases were rendered a final diagnosis based on TFE3/TFEB break-apart FISH testing which demonstrated 16 cases to be FISH-positive, 49 cases FISH-negative, and 3 indeterminate cases. All 16 FISH-positive cases within this cohort showed high levels of TRIM63 expression, including 10 TFE3 translocation RCC (average H-score = 319), 3 TFEB translocation RCC (average H-score = 286), and 3 TFEB amplification RCC (average H-score = 332). Intriguingly, 8/49 FISH-negative and 2/3 FISH-indeterminate cases also displayed high levels of TRIM63 expression. (Supplementary Table 1)
To further characterize the genetic status of the FISH-negative/TRIM63-positive cases and to assess whether these cases also harbor subtle or novel TFE3/TFEB rearrangements, like RBM10-TFE3 RCC, we performed whole exome sequencing and RNAseq on two FISH-negative/TRIM63-positive cases where adequate matched tumor and benign kidney samples were available. Sequencing studies demonstrated one case with low level copy number gain (3 copies) on the short arm of chromosome 6 (6p), which is known to house TFEB and VEGFA genes. The other case had a rearrangement between chromosome X and 19 (t(X:19)(p11.23;q13.32)) resulting in a ZC3H4-TFE3 gene fusion, a novel fusion subtype involving TFE3 which has not been previously reported in the literature (data not shown).
Diagnostic performance of TRIM63 RNA-ISH for MiTF-RCC
The TRIM63 RNA-ISH signals were scored for all 172 RCC cases and are illustrated in Figure 6A. Like previously described 27, we conducted ROC analysis to evaluate the diagnostic value of TRIM63 expression in MiTF-RCC and to determine the RNA-ISH H-score cutoff value with the maximal specificity. TRIM63 demonstrated superior diagnostic performance with AUC of 98.5%. Utilizing an H-score cutoff of 168, the specificity and sensitivity of detecting MiTF-RCC were 100% and 90.2%, respectively (Figure 6B). We also compared the RNA-ISH results and the clinical TFE3/TFEB FISH assay results (Figure 6C, 6D) to better evaluate the diagnostic value of TRIM63 expression in MiTF-RCC and found 25/28 (89%) cytogenetically confirmed MiTF-RCC cases were TRIM63 positive. Among 68 clinically and morphologically suspicious cases that passed quality control, all 16 (100%) FISH-positive cases were TRIM63 positive; 41/49 (83.7%) FISH negative cases were TRIM63 negative; and 2/3 (66.7%) of FISH indeterminate cases were TRIM63 positive. Overall, 41/44 (93.2%) FISH-positive cases were TRIM63 positive as shown in the Venn diagram (Figure 6C); and 41/49 (83.7%) FISH-negative cases were TRIM63 negative. There was a significant difference in TRIM63 RNA-ISH H-scores between RCC categorized to be positive and negative cases as defined by TFE3/TFEB FISH, utilizing the Wilcoxon signed-rank test. The TRIM63 RNA-ISH assay results were highly concordant to the TFE3/TFEB results in the FISH positive RCC cases; furthermore, TRIM63 RNA-ISH H-scores provided valuable confirmation of the FISH negative cases including identification of the false negative cases (with RBM10-TFE3 fusion) and identification of a FISH negative case with a novel and previously unknown ZC3H4-TFE3 gene fusion. We also checked the expression of Cathepsin K and melanogenic markers, HMB45 and Melan-A, by immunohistochemistry in selected MiTF-RCC cases in the cohort. We observed that the MiTF-RCC cases with positive TRIM63 expression demonstrated variable staining patterns of these 3 IHC markers and those cases with low to none TRIM63 expression were mostly negative for these IHC markers (Supplementary Table 2).
Figure 6.
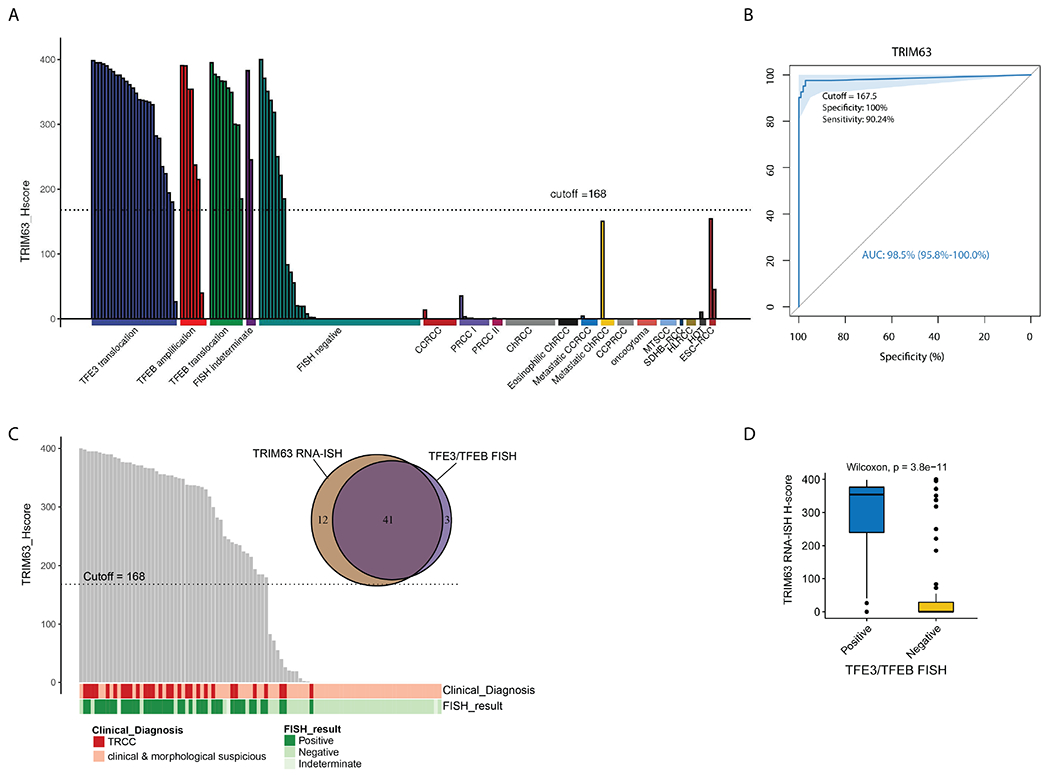
TRIM63 overexpression was highly specific to MiTF-RCC among all major and rare RCC subtypes and TRIM63 RNA-ISH results were highly concordant to the TFE3/TFEB FISH results. A) Bar plot of TRIM63 expression in diverse RCC subtypes represented by H-score. The majority of MiTF-RCC cases overexpressed TRIM63 as reflected by high H-score. The other RCC subtypes exhibited low to none TRIM63 expression in most cases. B) The area under the receiver-operating-characteristic (ROC) curve (AUC) showing the diagnostic values of TRIM63 expression in MiTF-RCC. An H-score cutoff value of 168 (rounded off from 167.5) yielded 100% specificity and 90% sensitivity with superior diagnostic performance (AUC:98.5%). C) Comparison between TRIM63 RNA-ISH and TFE3/TFEB FISH results by Bar plot and Venn diagram showed high concordance between the two assays. Overall, 41/44 (93.2%) FISH positive cases were TRIM63 positive; 41/49 (83.7%) FISH negative cases were TRIM63 negative. The Bar plot included all 31 cytogenetically confirmed MiTF-RCC cases and 70 cases clinically and morphologically suspected to be MiTF-RCC with confirmatory FISH data. In the Venn diagram, purple area (in the middle) represents TRIM63 RNA-ISH and TFE3/TFEB FISH double positive cases, light purple (on the right) area represented TFE3/TFEB FISH positive, TRIM63 RNA-ISH negative cases, and brown area (on the left) represents TRIM63 RNA-ISH positive, TFE3/TFEB FISH negative cases. D) Comparison between TRIM63 RNA-ISH and TFE3/TFEB FISH by Box plot and Wilcoxon test showed significant difference in TRIM63 RNA-ISH H-scores between TFE3/TFEB FISH positive and negative cases.
Discussion
In this study, we performed RNAseq analysis to compare the MiTF-RCC transcriptome to that of other RCC subtypes and benign kidney and identify specific biomarkers for MiTF-RCC. Among the top-ranking candidates, we selected TRIM63 for further experimental validation by RNA-ISH on a comprehensive RCC cohort representing various renal tumor subtypes. Importantly, our results demonstrated that TRIM63 transcripts were highly enriched amongst all classes of MiTF-RCC including those with TFE3 rearrangement, TFEB rearrangement and TFEB amplification. Other categories of renal tumors showed either an absence or low expression of TRIM63.
Interestingly, in our recent study with the Clinical Proteomic Tumor Analysis Consortium (CPTAC) where we characterized proteogenomic aberrations of CCRCC, among the 110 tumors, one case had histomorphology of CCRCC but revealed to contain SFPQ-TFE3 fusion by RNAseq and whole genome sequencing, and was hence reclassified as MiTF-RCC. As expected, only this case showed outlier expression of TRIM63 at both levels of RNA (by RNAseq data) and protein (by Mass spectrometry data) (data not shown) 33. In two previous reports, TRIM63 was found to be overexpressed in RCC with TFE3 and TFEB rearrangement based on microarray data, but failed to be further explored for its specificity or sensitivity, due to lack of TRIM63 antibody for IHC 34,35. The RNA-ISH assays helped overcome shortfalls in antibody availability and enabled us to characterize and clearly demonstrate TRIM63 as a MiTF-RCC marker with superior diagnostic performance.
Clinically, MiTF-RCC present frequently as a differential diagnosis for renal tumors in younger patients or those presenting with loco-regional advanced disease (for example, involving the regional lymph nodes). For the surgical pathologists, MiTF-RCC may be considered within the differential diagnosis for renal tumors with clear cell features, papillary features, oncocytic cytoplasm, or those that do not fit well into the well-described renal tumor subtypes. 7,36 The current ancillary workup for MiTF-RCC include IHC for pan-cytokeratin, CAIX, Melan-A, HMB-45 and Cathepsin K. MiTF-RCC classically show under-expression of pan-cytokeratin with negative CAIX and variably focal to positive Melan-A, HMB-45, and Cathepsin K expression. Unfortunately, this expression pattern, utilizing a broad panel of markers, is observed only in a subset of cases and often this panel may not help resolve or confirm a diagnosis of MiTF-RCC. The TFE3 and TFEB break-apart FISH assays are currently considered to be the gold standard for MiTF-RCC diagnosis. While these FISH assays have become valuable, the analysis process is time consuming, labor intensive and the fluorescent assay staining results are not permanent. Thus, an ambiguous clinicopathologic read-out coupled with the requirement of extensive clinical workup for a diagnosis of MiTF-RCC may result in under-reporting of this family of renal tumors.
Amongst the immunohistochemical markers listed above, the osteoclastic protein Cathepsin K has been considered a potential biomarker for diagnosing MiTF-RCC 15. However, several studies have demonstrated a limited sensitivity (approximately 50%) and specificity for this marker 16,37–39. The expression of melanocytic markers Melan-A and HMB-45 is variable with negative to diffuse positive expression, relatively more common in MiTF-RCC with TFEB rearrangement. IHC for melanocytic markers suffers from poor sensitivity and can also cause diagnostic dilemma for other tumors with a melanogenic phenotype, especially in metastatic setting with unknown primary/tumor origin. While pan-cytokeratin is generally under-expressed in MiTF-RCC, it is not uncommon to see this category of renal tumors demonstrate patchy or diffuse pan-cytokeratin expression 40. TFE3 and TFEB protein immunohistochemistry has been utilized in some studies but suffers from sensitivity, specificity and specimen fixation issues 19. Overall, there is currently no single biomarker that can confirm, exclude or confidently suggest a diagnosis of MiTF-RCC. Hence, the discovery of new markers such as TRIM63, that is highly enriched in MiTF-RCC, could increase our ability to accurately classify these tumors.
TRIM63 is known to encode an E3 ubiquitin ligase enriched in skeletal, cardiac, and smooth muscle 41. TRIM63, also known as muscle-specific RING finger protein 1 (MuRF1), is involved in muscle remodeling and muscle protein homeostasis. It is a key regulator in muscle atrophy 41 and also plays a role in hypertrophic cardiomyopathy 42. TRIM63 was recently identified as an oncogene that promotes cell proliferation and migration in breast cancer via WNT/β-catenin signaling pathway 43. It was reported that TRIM63 is transcriptionally regulated by TP63 44 and the protein is post-translationally modified by SUMO1 45. A meta-microarray-analysis identified TRIM63 as a regulator in skin pigmentation 46, is up-regulated after repetitive UV treatment 47, and promotes differentiation of osteoblastic cells 48, consistent with the regulatory roles of MiT family genes in the melanocyte and osteoclast development, thus indicating an underlying relationship between MiTF genes and TRIM63. Further functional studies are warranted to explore the role of TRIM63 in MiTF-RCC and whether it is a direct transcriptional target of MiT family of transcription factors.
In this cohort, we established TRIM63 RNA-ISH score cutoff of 168 by ROC analysis with high sensitivity (90.2%) and high specificity (100%) for MiTF-RCC. In contrast, most CCRCC, PRCC and CCPRCC cases in our cohort showed no TRIM63 expression. Only 1/10 CCRCC and 1/12 PRCC showed very low level of TRIM63 expression and scored much below the cutoff value; only one case of ESC-RCC demonstrated TRIM63 expression in a comparable range to MiTF-RCC. Hence, TRIM63 may thus help clinically distinguish MiTF-RCC from other renal tumor subtypes in day to day surgical pathology practice; another advantage is its utility as a single marker to help suggest and confirm a diagnosis of MiTF-RCC, in contrast to the currently available strategies (employing pan-cytokeratin, Melan-A, HMB-45, Cathepsin K, etc.) that are not very sensitive, specific or cost effective. Studies of additional cohorts could further help validate these observations. Since the differential diagnosis of MiTF-RCC may include epithelioid AML, we interrogated and found TRIM63 was positive in 2/3 epithelioid AMLs and 4/5 classic AMLs (H-score > 168); we plan to evaluate TRIM63 expression in additional renal tumors of mesenchymal origin in a follow up study. Finally, TRIM63 RNA-ISH for MiTF-RCC adds upon other established and clinically utilized biomarkers for diverse renal tumor subtypes like CA-IX (for CCRCC), CK7/AMACR (for PRCC), CA-IX/CK7 (for CCPRCC), and some of the proven markers under clinical assay development such as VSTM2A (for MTSCC) and LINC01187/FOXI1 (for ChRCC) 27,40.
Another highlight of this study is the identification of TRIM63 overexpression in FISH-negative MiTF-RCC cases, including two cases harboring RBM10-TFE3 inversion, one with a novel ZC3H4-TFE3 fusion, and one with low copy number gain at TFEB loci. Thus, addition of a TRIM63 RNA-ISH assay to the clinical workup would be beneficial for earlier recognition of TFE3/TFEB FISH false-negative cases, especially the MiTF-RCC cases involving gene fusions with a paracentric Xp11 inversion, for example, RBM10-TFE3, RBMX-TFE3, NONO-TFE3, and others. A combination of TRIM63 RNA-ISH and TFE3/TFEB FISH assays would help improve the accuracy and efficiency of MiTF-RCC diagnosis. Addition of TRIM63 in targeted gene expression panels that are so widely used nowadays as a cancer diagnostic tool is also warranted. Positive cases can then be recommended for a full NGS profiling if need be.
By Next-generation sequencing, we identified novel rearrangement between chromosome X and 19 resulting in a ZC3H4-TFE3 gene fusion in one of the FISH-negative/TRIM63-positive cases. It is not clear why this case with interchromosomal rearrangement was seen to be negative upon conventional TFE3 FISH testing. One explanation may be the tumor heterogeneity which results in a low count of break-apart signals. Alternatively, based on NGS whole exome sequencing analysis, the tumor content of this case is 26%, which is relatively low; we were able to detect this gene fusion despite the low tumor content as the RNAseq technique is highly sensitive.
Strengths of this study include the use of RNAseq data from common and rare renal tumors, as well as use of whole tissue sections allowing for a comprehensive evaluation of the marker in tumor and adjacent benign renal tissue. One limitation of TRIM63 as a diagnostic marker is that TRIM63 cannot distinguish between MiTF-RCC subtypes with TFE3 rearrangement, TFEB rearrangement, and TFEB amplification.
In conclusion, TRIM63 is specifically overexpressed in the high majority of MiTF-RCC. Future functional studies will further explore the role of TRIM63 in MiTF-RCC tumorigenesis and tumor progression and determine if TRIM63 is a direct transcriptional target of MiT family of transcription factors. Our results support that TRIM63 can serve as a diagnostic marker to clinically distinguish MiTF-RCC from other renal tumor subtypes with overlapping morphologic features. A combination of TRIM63 RNA-ISH and TFE3/TFEB FISH assays would improve the accuracy and efficiency of MiTF-RCC diagnosis.
Supplementary Material
Acknowledgements
We thank Jyoti Athanikar for her help with manuscript editing and proofreading. We further thank Christine Betts for the administrative support.
Funding Statement
Research reported in this publication was supported by the University of Michigan Anatomic Pathology Funding Committee and the National Cancer Institutes of Health P30CA046592 by the use of the following Cancer Center shared resource(s): Tissue and Molecular Pathology.
Footnotes
Ethics Approval
This study was performed under Institutional Review Boards (IRBMED)-approved protocols with waiver for informed consent.
Date Availability Statement
The datasets used and/or analyzed during the current study are available from the corresponding author on reasonable request.
Conflict of interest
The authors declare no conflict of interest.
References
- 1.Udager AM & Mehra R Morphologic, Molecular, and Taxonomic Evolution of Renal Cell Carcinoma: A Conceptual Perspective With Emphasis on Updates to the 2016 World Health Organization Classification. Arch Pathol Lab Med 140, 1026–1037 (2016). [DOI] [PubMed] [Google Scholar]
- 2.Moch H, Cubilla AL, Humphrey PA, Reuter VE & Ulbright TM The 2016 WHO Classification of Tumours of the Urinary System and Male Genital Organs-Part A: Renal, Penile, and Testicular Tumours. Eur Urol 70, 93–105 (2016). [DOI] [PubMed] [Google Scholar]
- 3.Kauffman EC, Ricketts CJ, Rais-Bahrami S, Yang Y, Merino MJ, Bottaro DP et al. Molecular genetics and cellular features of TFE3 and TFEB fusion kidney cancers. Nat Rev Urol 11, 465–475 (2014). [DOI] [PMC free article] [PubMed] [Google Scholar]
- 4.Magers MJ, Udager AM & Mehra R MiT Family Translocation-Associated Renal Cell Carcinoma: A Contemporary Update With Emphasis on Morphologic, Immunophenotypic, and Molecular Mimics. Arch Pathol Lab Med 139, 1224–1233 (2015). [DOI] [PubMed] [Google Scholar]
- 5.Ellis CL, Eble JN, Subhawong AP, Martignoni G, Zhong M, Ladanyi M et al. Clinical heterogeneity of Xp11 translocation renal cell carcinoma: impact of fusion subtype, age, and stage. Mod Pathol 27, 875–886 (2014). [DOI] [PubMed] [Google Scholar]
- 6.Gupta S, Argani P, Jungbluth AA, Chen YB, Tickoo SK, Fine SW et al. TFEB Expression Profiling in Renal Cell Carcinomas: Clinicopathologic Correlations. Am J Surg Pathol 43, 1445–1461 (2019). [DOI] [PMC free article] [PubMed] [Google Scholar]
- 7.Kennedy JM, Wang X, Plouffe KR, Dhanasekaran SM, Hafez K, Palapattu GS et al. Clinical and morphologic review of 60 hereditary renal tumors from 30 hereditary renal cell carcinoma syndrome patients: lessons from a contemporary single institution series. Med Oncol 36, 74 (2019). [DOI] [PubMed] [Google Scholar]
- 8.Skala SL, Xiao H, Udager AM, Dhanasekaran SM, Shukla S, Zhang Y et al. Detection of 6 TFEB-amplified renal cell carcinomas and 25 renal cell carcinomas with MITF translocations: systematic morphologic analysis of 85 cases evaluated by clinical TFE3 and TFEB FISH assays. Mod Pathol 31, 179–197 (2018). [DOI] [PubMed] [Google Scholar]
- 9.Argani P, Reuter VE, Zhang L, Sung YS, Ning Y, Epstein JI et al. TFEB-amplified Renal Cell Carcinomas: An Aggressive Molecular Subset Demonstrating Variable Melanocytic Marker Expression and Morphologic Heterogeneity. Am J Surg Pathol 40, 1484–1495 (2016). [DOI] [PMC free article] [PubMed] [Google Scholar]
- 10.Cancer Genome Atlas Research, N. Comprehensive molecular characterization of clear cell renal cell carcinoma. Nature 499, 43–49 (2013). [DOI] [PMC free article] [PubMed] [Google Scholar]
- 11.Chen F, Zhang Y, Senbabaoglu Y, Ciriello G, Yang L, Reznik E et al. Multilevel Genomics-Based Taxonomy of Renal Cell Carcinoma. Cell Rep 14, 2476–2489 (2016). [DOI] [PMC free article] [PubMed] [Google Scholar]
- 12.Argani P, Hicks J, De Marzo AM, Albadine R, Illei PB, Ladanyi M et al. Xp11 translocation renal cell carcinoma (RCC): extended immunohistochemical profile emphasizing novel RCC markers. Am J Surg Pathol 34, 1295–1303 (2010). [DOI] [PMC free article] [PubMed] [Google Scholar]
- 13.Argani P, Hawkins A, Griffin CA, Goldstein JD, Haas M, Beckwith JB et al. A distinctive pediatric renal neoplasm characterized by epithelioid morphology, basement membrane production, focal HMB45 immunoreactivity, and t(6;11)(p21.1;q12) chromosome translocation. Am J Pathol 158, 2089–2096 (2001). [DOI] [PMC free article] [PubMed] [Google Scholar]
- 14.Smith NE, Illei PB, Allaf M, Gonzalez N, Morris K, Hicks J et al. t(6;11) renal cell carcinoma (RCC): expanded immunohistochemical profile emphasizing novel RCC markers and report of 10 new genetically confirmed cases. Am J Surg Pathol 38, 604–614 (2014). [DOI] [PMC free article] [PubMed] [Google Scholar]
- 15.Martignoni G, Pea M, Gobbo S, Brunelli M, Bonetti F, Segala D et al. Cathepsin-K immunoreactivity distinguishes MiTF/TFE family renal translocation carcinomas from other renal carcinomas. Mod Pathol 22, 1016–1022 (2009). [DOI] [PubMed] [Google Scholar]
- 16.Martignoni G, Gobbo S, Camparo P, Brunelli M, Munari E, Segala D et al. Differential expression of cathepsin K in neoplasms harboring TFE3 gene fusions. Mod Pathol 24, 1313–1319 (2011). [DOI] [PubMed] [Google Scholar]
- 17.Argani P, Lal P, Hutchinson B, Lui MY, Reuter VE & Ladanyi M Aberrant nuclear immunoreactivity for TFE3 in neoplasms with TFE3 gene fusions: a sensitive and specific immunohistochemical assay. Am J Surg Pathol 27, 750–761 (2003). [DOI] [PubMed] [Google Scholar]
- 18.Argani P, Lae M, Hutchinson B, Reuter VE, Collins MH, Perentesis J et al. Renal carcinomas with the t(6;11)(p21;q12): clinicopathologic features and demonstration of the specific alpha-TFEB gene fusion by immunohistochemistry, RT-PCR, and DNA PCR. Am J Surg Pathol 29, 230–240 (2005). [DOI] [PubMed] [Google Scholar]
- 19.Taylor AS, Spratt DE, Dhanasekaran SM & Mehra R Contemporary Renal Tumor Categorization With Biomarker and Translational Updates: A Practical Review. Arch Pathol Lab Med 143, 1477–1491 (2019). [DOI] [PubMed] [Google Scholar]
- 20.Akgul M, Saeed O, Levy D, Mann SA, Cheng L, Grignon DJ et al. Morphologic and Immunohistochemical Characteristics of Fluorescent In Situ Hybridization Confirmed TFE3-Gene Fusion Associated Renal Cell Carcinoma: A Single Institutional Cohort. Am J Surg Pathol 10.1097/PAS.0000000000001541 (2020). [DOI] [PubMed] [Google Scholar]
- 21.Malouf GG, Camparo P, Oudard S, Schleiermacher G, Theodore C, Rustine A et al. Targeted agents in metastatic Xp11 translocation/TFE3 gene fusion renal cell carcinoma (RCC): a report from the Juvenile RCC Network. Ann Oncol 21, 1834–1838 (2010). [DOI] [PubMed] [Google Scholar]
- 22.Zoumpourlis P, Genovese G, Tannir NM & Msaouel P Systemic Therapies for the Management of Non-Clear Cell Renal Cell Carcinoma: What Works, What Doesn’t, and What the Future Holds. Clin Genitourin Cancer 10.1016/j.clgc.2020.11.005 (2020). [DOI] [PMC free article] [PubMed] [Google Scholar]
- 23.Boileve A, Carlo MI, Barthelemy P, Oudard S, Borchiellini D, Voss MH et al. Immune checkpoint inhibitors in MITF family translocation renal cell carcinomas and genetic correlates of exceptional responders. J Immunother Cancer 6, 159 (2018). [DOI] [PMC free article] [PubMed] [Google Scholar]
- 24.Pal SK, Tangen C, Thompson IM Jr., Balzer-Haas N, George DJ, Heng DYC et al. A comparison of sunitinib with cabozantinib, crizotinib, and savolitinib for treatment of advanced papillary renal cell carcinoma: a randomised, open-label, phase 2 trial. Lancet 397, 695–703 (2021). [DOI] [PMC free article] [PubMed] [Google Scholar]
- 25.Thouvenin J & Kalaassen Z Efficacy of Cabozantinib in Advanced MiT Family Translocation Renal Cell Carcinomas. ASCO Genitourinary Cancers Symposium (2021). [Google Scholar]
- 26.Cancer Genome Atlas Research, N., Linehan WM, Spellman PT, Ricketts CJ, Creighton CJ, Fei SS et al. Comprehensive Molecular Characterization of Papillary Renal-Cell Carcinoma. N Engl J Med 374, 135–145 (2016). [DOI] [PMC free article] [PubMed] [Google Scholar]
- 27.Wang L, Zhang Y, Chen YB, Skala SL, Al-Ahmadie HA, Wang X et al. VSTM2A Overexpression Is a Sensitive and Specific Biomarker for Mucinous Tubular and Spindle Cell Carcinoma (MTSCC) of the Kidney. Am J Surg Pathol 42, 1571–1584 (2018). [DOI] [PMC free article] [PubMed] [Google Scholar]
- 28.Skala SL, Wang X, Zhang Y, Mannan R, Wang L, Narayanan SP et al. Next-generation RNA Sequencing-based Biomarker Characterization of Chromophobe Renal Cell Carcinoma and Related Oncocytic Neoplasms. Eur Urol 10.1016/j.eururo.2020.03.003 (2020). [DOI] [PMC free article] [PubMed] [Google Scholar]
- 29.Ritchie ME, Phipson B, Wu D, Hu Y, Law CW, Shi W et al. limma powers differential expression analyses for RNA-sequencing and microarray studies. Nucleic Acids Res 43, e47 (2015). [DOI] [PMC free article] [PubMed] [Google Scholar]
- 30.Law CW, Chen Y, Shi W & Smyth GK voom: Precision weights unlock linear model analysis tools for RNA-seq read counts. Genome Biol 15, R29 (2014). [DOI] [PMC free article] [PubMed] [Google Scholar]
- 31.Robin X, Turck N, Hainard A, Tiberti N, Lisacek F, Sanchez JC et al. pROC: an open-source package for R and S+ to analyze and compare ROC curves. BMC Bioinformatics 12, 77 (2011). [DOI] [PMC free article] [PubMed] [Google Scholar]
- 32.Argani P, Zhang L, Reuter VE, Tickoo SK & Antonescu CR RBM10-TFE3 Renal Cell Carcinoma: A Potential Diagnostic Pitfall Due to Cryptic Intrachromosomal Xp11.2 Inversion Resulting in False-negative TFE3 FISH. Am J Surg Pathol 41, 655–662 (2017). [DOI] [PMC free article] [PubMed] [Google Scholar]
- 33.Clark DJ, Dhanasekaran SM, Petralia F, Pan J, Song X, Hu Y et al. Integrated Proteogenomic Characterization of Clear Cell Renal Cell Carcinoma. Cell 179, 964–983e931 (2019). [DOI] [PMC free article] [PubMed] [Google Scholar]
- 34.Camparo P, Vasiliu V, Molinie V, Couturier J, Dykema KJ, Petillo D et al. Renal translocation carcinomas: clinicopathologic, immunohistochemical, and gene expression profiling analysis of 31 cases with a review of the literature. Am J Surg Pathol 32, 656–670 (2008). [DOI] [PubMed] [Google Scholar]
- 35.Pflueger D, Sboner A, Storz M, Roth J, Comperat E, Bruder E et al. Identification of molecular tumor markers in renal cell carcinomas with TFE3 protein expression by RNA sequencing. Neoplasia 15, 1231–1240 (2013). [DOI] [PMC free article] [PubMed] [Google Scholar]
- 36.Argani P MiT family translocation renal cell carcinoma. Semin Diagn Pathol 32, 103–113 (2015). [DOI] [PubMed] [Google Scholar]
- 37.Rao Q, Williamson SR, Zhang S, Eble JN, Grignon DJ, Wang M et al. TFE3 break-apart FISH has a higher sensitivity for Xp11.2 translocation-associated renal cell carcinoma compared with TFE3 or cathepsin K immunohistochemical staining alone: expanding the morphologic spectrum. Am J Surg Pathol 37, 804–815 (2013). [DOI] [PubMed] [Google Scholar]
- 38.Zheng G, Martignoni G, Antonescu C, Montgomery E, Eberhart C, Netto G et al. A broad survey of cathepsin K immunoreactivity in human neoplasms. Am J Clin Pathol 139, 151–159 (2013). [DOI] [PMC free article] [PubMed] [Google Scholar]
- 39.Ye H, Qin S, Li N, Lin M, Xu Y & Li X A Rare Partner of TFE3 in the Xp11 Translocation Renal Cell Carcinoma: Clinicopathological Analyses and Detection of MED15-TFE3 Fusion. Biomed Res Int 2019, 5974089 (2019). [DOI] [PMC free article] [PubMed] [Google Scholar]
- 40.Skala SL, Wang X, Zhang Y, Mannan R, Wang L, Narayanan SP et al. Next-generation RNA Sequencing-based Biomarker Characterization of Chromophobe Renal Cell Carcinoma and Related Oncocytic Neoplasms. Eur Urol 78, 63–74 (2020). [DOI] [PMC free article] [PubMed] [Google Scholar]
- 41.Bodine SC & Baehr LM Skeletal muscle atrophy and the E3 ubiquitin ligases MuRF1 and MAFbx/atrogin-1. Am J Physiol Endocrinol Metab 307, E469–484 (2014). [DOI] [PMC free article] [PubMed] [Google Scholar]
- 42.Chen SN, Czernuszewicz G, Tan Y, Lombardi R, Jin J, Willerson JT et al. Human molecular genetic and functional studies identify TRIM63, encoding Muscle RING Finger Protein 1, as a novel gene for human hypertrophic cardiomyopathy. Circ Res 111, 907–919 (2012). [DOI] [PMC free article] [PubMed] [Google Scholar]
- 43.Li K, Pan W, Ma Y, Xu X, Gao Y, He Y et al. A novel oncogene TRIM63 promotes cell proliferation and migration via activating Wnt/beta-catenin signaling pathway in breast cancer. Pathol Res Pract 215, 152573 (2019). [DOI] [PubMed] [Google Scholar]
- 44.von Grabowiecki Y, Abreu P, Blanchard O, Palamiuc L, Benosman S, Meriaux S et al. Transcriptional activator TAp63 is upregulated in muscular atrophy during ALS and induces the pro-atrophic ubiquitin ligase Trim63. Elife 5 (2016). [DOI] [PMC free article] [PubMed] [Google Scholar]
- 45.Heras G, Namuduri AV, Traini L, Shevchenko G, Falk A, Bergstrom Lind S et al. Muscle RING-finger protein-1 (MuRF1) functions and cellular localization are regulated by SUMO1 post-translational modification. J Mol Cell Biol 11, 356–370 (2019). [DOI] [PMC free article] [PubMed] [Google Scholar]
- 46.Yin L, Coelho SG, Valencia JC, Ebsen D, Mahns A, Smuda C et al. Identification of Genes Expressed in Hyperpigmented Skin Using Meta-Analysis of Microarray Data Sets. J Invest Dermatol 135, 2455–2463 (2015). [DOI] [PMC free article] [PubMed] [Google Scholar]
- 47.Choi W, Miyamura Y, Wolber R, Smuda C, Reinhold W, Liu H et al. Regulation of human skin pigmentation in situ by repetitive UV exposure: molecular characterization of responses to UVA and/or UVB. J Invest Dermatol 130, 1685–1696 (2010). [DOI] [PMC free article] [PubMed] [Google Scholar]
- 48.Azuma K, Urano T, Ouchi Y & Inoue S Glucocorticoid-induced gene tripartite motif-containing 63 (TRIM63) promotes differentiation of osteoblastic cells. Endocr J 57, 455–462 (2010). [DOI] [PubMed] [Google Scholar]
Associated Data
This section collects any data citations, data availability statements, or supplementary materials included in this article.