

Abstract
Ending hunger and ensuring food security are among targets of 2030’s SDGs. While food trade and the embedded (virtual) water (VW) may improve food availability and accessibility for more people all year round, the sustainability and efficiency of food and VW trade needs to be revisited. In this research, we assess the sustainability and efficiency of food and VW trades under two food security scenarios for Iran, a country suffering from an escalating water crisis. These scenarios are (1) Individual Crop Food Security (ICFS), which restricts calorie fulfillment from individual crops and (2) Crop Category Food Security (CCFS), which promotes “eating local” by suggesting food substitution within the crop category. To this end, we simulate the water footprint and VW trades of 27 major crops, within 8 crop categories, in 30 provinces of Iran (2005–2015). We investigate the impacts of these two scenarios on (a) provincial food security (FSp) and exports; (b) sustainable and efficient blue water consumption, and (c) blue VW export. We then test the correlation between agro-economic and socio-environmental indicators and provincial food security. Our results show that most provinces were threatened by unsustainable and inefficient blue water consumption for crop production, particularly in the summertime. This water mismanagement results in 14.41 and 8.45 billion m3 y−1 unsustainable and inefficient blue VW exports under ICFS. “Eating local” improves the FSp value by up to 210% which lessens the unsustainable and inefficient blue VW export from hotspots. As illustrated in the graphical abstract, the FSp value strongly correlates with different agro-economic and socio-environmental indicators, but in different ways. Our findings promote “eating local” besides improving agro-economic and socio-environmental conditions to take transformative steps toward eradicating food insecurity not only in Iran but also in other countries facing water limitations.
Subject terms: Environmental social sciences, Hydrology, Climate sciences
Introduction
Food security is a global challenge under an ever-increasing population and ever-shrinking finite resources. Currently, about one billion (16%) of the world’s population are undernourished, 80% of which live in the global south1. Globally, fulfilling food demand is facing two main challenges concerning land and water availability2,3. On one hand, global croplands are significantly reduced by urbanization growth, the overexploitation of fertile lands and deforestation4. On the other hand, food production within the remaining croplands is also restricted by ever-shrinking finite water resources. This is resulting in an intensification of management strategies, such as improving agricultural practices or water management to enhance the productivity of cropping systems5. However, the food security achieved under these strategies is, in some nations, mainly at the expense of the environment; in particular of freshwater resources3. These strategies cannot last long, unless they are systematically revisited based on the availability and sustainability of resources1,6.
Among numerous quantitative indicators, water footprint (WF)7 is known as a multidimensional indicator of water consumption, which can be used to formulate pathways to achieve sustainable water resource development in agriculture. Along with WF assessment (WFA), recent studies proved that water scarcity could be alleviated through efficient water use in croplands by mulching and efficient irrigation systems8,9, changing cropping patterns9, or benchmarking10,11. Virtual water (VW) trade is another concept that was developed to monitor and manage embedded water in crop trades. Water-smart food trade in water-scarce regions, i.e. importing water-intensive crops instead of domestic production, has the potential to achieve higher levels of food and water security compared to localized food production from a water management point of view12,13. On the contrary, water scarcity in exporting regions could be escalated when VW flows are issued in the opposite direction14,15.
Many countries in the world are involved in VW trade and satisfy their food demand through the import/export process. Additionally, increasing water trades become problematic since they, not only decrease already scarce water resources, but also reduce the resilience of communities toward unanticipated crises16. Indeed, a VW trade is labeled sustainable when the products are not produced at and exported from hotspots, where the water consumption exceeds the sustainable availability of water. Crop-related VW trade is efficient when the WFs of the produced crops in the exporting regions are lower than their benchmark levels. The literature review reveals that little research has been done on the sustainability and efficiency of inter- or intra-national VW trade. In Iran, relocating wheat cultivation may modify crop and VW trade direction to reduce consumption in water-scarce provinces17. In the UK, for example, it was claimed that about 50% of the imported VW was unsustainable and inefficient since it originated from countries with blue water scarcity (BWS) > 1 and WF values beyond the benchmark levels18. Another study revealed that cotton consumption in Germany exacerbates water scarcity in Pakistan, and deteriorates the quality of drinking water. Hence, a global effort should raise awareness on the impacts of externalizing the water consumption of a nation and its repercussions on water resources of another nation19. A crop-related WF assessment of Iran demonstrated that the direction of provincial VW trade occurred from the water-scarce provinces to the water-abundant ones20.
Here, and for the first time, we assessed the efficiency and sustainability of the inter-provincial crop-related VW export under different food security scenarios as a case study for Iran, the second largest country in the most water scarce region of the world, The Middle East and North Africa (MENA)21. Iran is facing a severe BWS, and irrigated agriculture contributes to 97% in the total net blue water abstraction13,22. Agriculture plays a key role in Iran’s economy with a contribution of 13% in the national gross domestic production, 20% in employment rate, 23% in the non-oil export, 82% in total food consumed by the residents, and 90% in total raw materials used by the food-processing factories17. In 1979, self-sufficiency in food production was implemented in the center of Iran’s food policies which promoted national self-sufficiency in terms of agricultural production, mainly for cereal production20. Nevertheless, the national self-sufficiency plan has not yet been achieved and Iran relies on other countries' water bodies to meet its food demand20. Due to the substantial contribution of agriculture in the national water consumption, we assessed the potentials for improving crop-related blue water consumption and trade in the hopes of getting sustainable self-sufficient food security in Iran while reducing water-related challenges.
In this study, we first evaluated the provincial food security levels from domestic agricultural production; the influence of current production patterns on the efficiency and sustainability of blue water consumption and VW trade. Thereafter, we tested the relationship between efficiency/suitability and self-sufficient food security levels; and suggested potentials for improving the current conditions. These potentials were extracted from agro-economic and socio-environmental assessments using different agricultural, economic, environmental, and social indicators.
Results
Food security and export
Table 1 shows the FSp values obtained from each crop category and from all 27 crops, under ICFS and CCFS scenarios. Considering all 27 selected crops, the overall FSp value varies in the range of 11–98% and 16–100% under ICFS and CCFS scenarios, respectively. Indeed, considering crop substitution within a specific crop category increases the provincial FSp values by 1–210%.
Table 1.
Provincial level of self-supplied crop-related food security under ICFS and CCFS scenarios.
| Province | Self-supplied food security level (%) under ICFS scenarioa | Self-supplied food security level (%) under CCFS scenario | ||||||||||||||||
|---|---|---|---|---|---|---|---|---|---|---|---|---|---|---|---|---|---|---|
| Cereals | Root and tubers | Sugar crops | Pulses | Nuts | Oil crops | Vegetables | Fruits | All cropsb | Cereals | Root and tubers | Sugar crops | Pulses | Nuts | Oil crops | Vegetables | Fruits | All crops | |
| Ardebil | 82 | 38 | 100 | 58 | 25 | 9 | 52 | 17 | 76 | 100 | 38 | 100 | 84 | 25 | 9 | 56 | 40 | 92 |
| AzarGharbi | 82 | 78 | 69 | 6 | 42 | 28 | 41 | 41 | 76 | 100 | 78 | 69 | 6 | 90 | 28 | 41 | 100 | 94 |
| AzarSharghi | 83 | 82 | 100 | 4 | 6 | 70 | 100 | 41 | 81 | 100 | 100 | 100 | 4 | 6 | 70 | 100 | 100 | 99 |
| Bushehr | 41 | 83 | 4 | 4 | 0 | 100 | 0 | 70 | 44 | 50 | 100 | 4 | 4 | 0 | 100 | 0 | 100 | 54 |
| Chaharmahal | 88 | 6 | 100 | 16 | 33 | 100 | 100 | 41 | 83 | 100 | 6 | 100 | 16 | 33 | 100 | 100 | 85 | 96 |
| Esfahan | 77 | 68 | 100 | 6 | 42 | 60 | 0 | 24 | 71 | 100 | 100 | 100 | 6 | 46 | 60 | 0 | 32 | 90 |
| Fars | 99 | 100 | 91 | 19 | 42 | 100 | 100 | 88 | 98 | 100 | 100 | 91 | 32 | 75 | 100 | 100 | 100 | 100 |
| Ghazvin | 85 | 69 | 77 | 12 | 42 | 100 | 46 | 41 | 80 | 100 | 100 | 77 | 12 | 51 | 100 | 46 | 100 | 97 |
| Ghom | 18 | 2 | 1 | 6 | 0 | 100 | 7 | 10 | 20 | 39 | 2 | 1 | 6 | 0 | 100 | 7 | 10 | 36 |
| Guilan | 24 | 10 | 8 | 2 | 0 | 54 | 100 | 17 | 26 | 100 | 10 | 8 | 2 | 0 | 54 | 100 | 17 | 81 |
| Gorgan | 100 | 67 | 100 | 100 | 0 | 0 | 26 | 18 | 86 | 100 | 100 | 100 | 100 | 0 | 0 | 26 | 20 | 87 |
| Hamedan | 82 | 69 | 100 | 18 | 42 | 100 | 100 | 41 | 80 | 100 | 69 | 100 | 37 | 52 | 100 | 100 | 100 | 99 |
| Hormozgan | 16 | 100 | 56 | 1 | 0 | 51 | 1 | 49 | 23 | 30 | 100 | 56 | 1 | 0 | 51 | 1 | 100 | 37 |
| Ilam | 88 | 49 | 4 | 9 | 2 | 49 | 10 | 9 | 75 | 100 | 49 | 4 | 9 | 2 | 49 | 11 | 9 | 85 |
| Kerman | 57 | 33 | 100 | 1 | 13 | 100 | 16 | 65 | 59 | 94 | 33 | 100 | 1 | 13 | 100 | 16 | 100 | 92 |
| Kermanshah | 82 | 47 | 15 | 6 | 42 | 100 | 39 | 40 | 75 | 100 | 47 | 15 | 6 | 42 | 100 | 39 | 72 | 91 |
| Khuzestan | 96 | 100 | 26 | 5 | 78 | 9 | 62 | 37 | 82 | 100 | 100 | 26 | 5 | 100 | 9 | 62 | 77 | 88 |
| Kohgiluieh | 83 | 28 | 1 | 18 | 10 | 39 | 76 | 52 | 67 | 100 | 28 | 1 | 23 | 10 | 39 | 77 | 100 | 83 |
| Kordestan | 82 | 29 | 100 | 6 | 1 | 100 | 19 | 37 | 78 | 100 | 29 | 100 | 6 | 1 | 100 | 19 | 45 | 92 |
| Lorestan | 86 | 71 | 100 | 23 | 26 | 100 | 100 | 40 | 84 | 100 | 100 | 100 | 23 | 26 | 100 | 100 | 47 | 97 |
| Markazi | 81 | 81 | 100 | 19 | 16 | 100 | 100 | 41 | 81 | 100 | 100 | 100 | 24 | 16 | 100 | 100 | 100 | 100 |
| Mazandaran | 42 | 25 | 26 | 100 | 1 | 16 | 32 | 19 | 39 | 100 | 25 | 26 | 100 | 1 | 16 | 32 | 100 | 90 |
| North-Khorasan | 82 | 100 | 100 | 7 | 42 | 67 | 70 | 41 | 80 | 100 | 100 | 100 | 7 | 100 | 67 | 71 | 100 | 98 |
| Razavi-Khorasan | 50 | 75 | 22 | 3 | 0 | 100 | 9 | 41 | 50 | 73 | 100 | 22 | 3 | 0 | 100 | 9 | 100 | 72 |
| Semnan | 81 | 91 | 100 | 4 | 42 | 100 | 100 | 34 | 80 | 100 | 100 | 100 | 6 | 56 | 100 | 100 | 100 | 100 |
| Sistan | 42 | 59 | 10 | 1 | 0 | 100 | 0 | 79 | 42 | 53 | 82 | 10 | 1 | 0 | 100 | 0 | 100 | 53 |
| South-Khorasan | 82 | 100 | 100 | 6 | 42 | 100 | 100 | 49 | 82 | 100 | 100 | 100 | 6 | 100 | 100 | 100 | 49 | 97 |
| Old-Tehran | 10 | 25 | 16 | 1 | 2 | 13 | 7 | 13 | 11 | 16 | 25 | 16 | 1 | 2 | 13 | 7 | 13 | 16 |
| Yazd | 52 | 64 | 15 | 1 | 3 | 100 | 18 | 45 | 52 | 76 | 64 | 15 | 1 | 3 | 100 | 18 | 63 | 72 |
| Zanjan | 86 | 100 | 100 | 12 | 40 | 100 | 100 | 41 | 85 | 100 | 100 | 100 | 12 | 40 | 100 | 100 | 100 | 100 |
ICFS is Individual Crop Food Security, which restricts calorie fulfillment from individual crops and CCFS is Crop Category Food Security, which promotes “eating local” by suggesting food substitution within the crop category.
aFor a specific crop category, a province with a food security level of 100% is entirely self-sufficient in supplying domestic demand; and could be a food exporter to provinces with deficit production.
bA province could have an overall food security level of < 100%, although being food exporter for some specific crop categories.
For both scenarios, the overall FSp value strongly correlates with cereal’s FSp values, where provinces with higher contributions in cereal production have higher FSp values. Irrigated agriculture has a crucial role in satisfying food security in Iran since roughly 66–100% of the overall FSp value is supplied by the irrigated crops (Table 2).
Table 2.
Total and unit irrigated-crop, blue VW export, and unsustainable blue VW export for different crop categories under the ICFS and CCFS scenarios over the study period (2005–2015).
| Crop category | ICFS scenario | CCFS scenario | ||||||||||
|---|---|---|---|---|---|---|---|---|---|---|---|---|
| Crop export | Blue VW export | Crop export | Blue VW export | |||||||||
| Total export | Unit export | Total export | Unit export | Unsustainable export | Unit unsustainable export | Total export | Unit export | Total export | Unit export | Unsustainable export | Unit unsustainable export | |
| (106 t y−1) | (t ha−1) | (109 m3 y−1) | (m3 ha−1) | (109 m3 y−1) | (m3 ha−1) | (106 t y−1) | (t ha−1) | (109 m3 y−1) | (m3 ha−1) | (109 m3 y−1) | (m3 ha−1) | |
| Cereals | 9.51 | 1.82 | 12.21 | 2343 | 6.18 | 1185 | 7.41 | 1.42 | 9.75 | 1872 | 5.19 | 996 |
| Root and tuber | 2.56 | 12.31 | 0.39 | 1891 | 0.21 | 1006 | 2.56 | 12.31 | 0.39 | 1891 | 0.21 | 1006 |
| Sugar crops | 7.77 | 35.36 | 2.12 | 9655 | 1.61 | 7329 | 7.03 | 32.00 | 1.89 | 8591 | 1.50 | 6844 |
| Pulses | 0.28 | 0.63 | 1.49 | 3352 | 0.66 | 1472 | 0.20 | 0.45 | 0.98 | 2197 | 0.32 | 721 |
| Nuts | 0.56 | 1.00 | 3.08 | 5543 | 1.83 | 3301 | 0.56 | 1.00 | 3.08 | 5543 | 1.83 | 3301 |
| Oil crops | 0.33 | 1.15 | 0.65 | 2267 | 0.45 | 1588 | 0.26 | 0.93 | 0.51 | 1776 | 0.36 | 1268 |
| Vegetables | 3.63 | 13.56 | 1.11 | 4141 | 0.74 | 2772 | 3.21 | 12.00 | 1.00 | 3715 | 0.68 | 2533 |
| Fruits | 5.36 | 7.73 | 5.26 | 7585 | 2.73 | 3942 | 3.60 | 5.19 | 3.87 | 5584 | 2.09 | 3011 |
| All crops | 30.00 | 3.80 | 26.32 | 3337 | 14.41 | 1828 | 24.84 | 3.15 | 21.47 | 2722 | 12.19 | 1546 |
Under the ICFS scenario, a total of 30.0 million tons of irrigated crops are inter-provincially traded per year; cereals and sugar crops have the highest contribution in this export. Under the CCFS scenario, the inter-provincial crop trade decreases 17% compared to the ICFS scenario; noticeably for cereals and fruits.
Sustainability and efficiency of blue water consumption
On the annual scale, 45.5 billion m3 of blue water is consumed to produce these 27 major crops, 78% (35.5 billion m3 y−1) of which is unsustainable consumption, and 34% of which (15.5 billion m3 y−1) is inefficient consumption. Figure 1 shows that cereals are major contributors in both the annual unsustainable and inefficient blue water consumption (m3 y−1, 46% and 35%, respectively). However, by unit measurements of unsustainability and inefficiency (m3 ha−1) indicate that sugar crops have the highest unsustainable blue WF value (10.9 thousand m3 ha1) and that pulses have the highest inefficiency (thousand 10.0 m3 ha−1).
Figure 1.

Annual total (m3 y−1) and unit (m3 ha−1) (a) sustainable/unsustainable and (b) inefficient blue WFs for different crop categories Iran over the study period (2005–2015). The unit unsustainable or inefficient blue WFs (m3 ha−1) was estimated by dividing total unsustainable or inefficient blue WFs (m3 y−1) by the area of croplands (ha) in the specific province. (i.e., The Figure is created in the environment of Microsoft Office—Excel—version 10.).
Provincial unit unsustainable blue WF values (m3 ha−1) vary from 0.71 thousand m3 ha−1 (Esfahan) to 7.1 thousand m3 ha−1 (Yazd) in hotspot provinces depending on their cropping pattern, accessibility to different sources, and agricultural practices and water management (Fig. 2). In seven provinces, blue water consumption is sustainable due to high blue water availability. There is no province in which blue water consumption is fully efficient. Unit inefficient blue WF values vary from 0.2 thousand m3 ha−1 (Kerman) to 5.3 thousand m3 ha−1 (Yazd).
Figure 2.
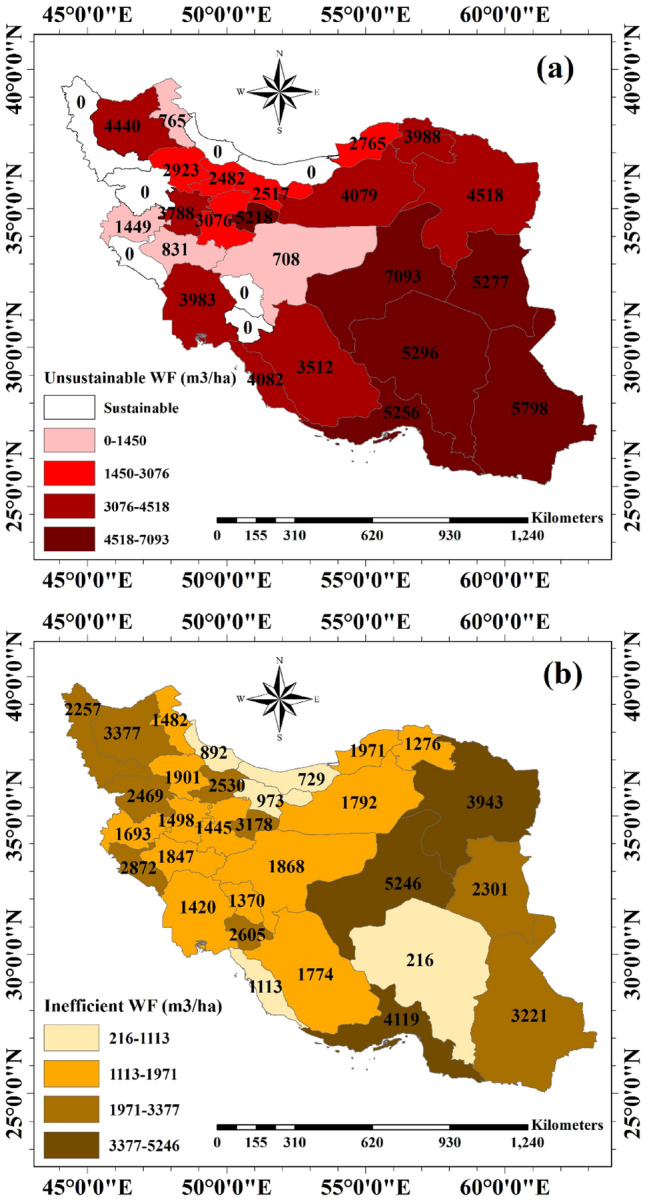
Provincial unit (a) unsustainable and (b) inefficient blue water footprint (WF) per unit of cropland (m3 ha−1) over the study period (2005–2015). Per province, unit unsustainable or inefficient blue WFs was calculated by dividing the total unsustainable or inefficient blue WFs (m3 y−1) by the area of croplands (ha) in the specific province. (i.e., This Figure is created in the environment of ArcMap-GIS version 10.7).
Sustainability and efficiency of blue VW export
Inter-provincial sustainability of blue VW export under the ICFS and CCFS scenarios
ICFS scenario—23 out of 30 provinces have unsustainable blue VW export; accounting for 0.59 billion m3 y−1 to 1.85 billion m3 y−1 (Fig. 3a). Three provinces of Fars, Khuzestan and South-Khorasan, three major crop-growing areas of Iran with a contribution of 12%, 18% and 5% in the national production, have the greatest unsustainable blue VW export; accounting for 1.85, 1.61 and 1.57 billion m3 y−1, respectively. These provinces contribute the most in the inter-provincial irrigated-crop export (11%, 21% and 7%, respectively) while they are classified as severe blue water scarce regions based on the BWS index.
Figure 3.

Inter-provincial values of the total (a and c) and unit (b and d) unsustainable blue virtual water (VW) exports under ICFS (left) and CCFS (right) scenarios. The contribution of eight crop categories in the total irrigated crop export and total unsustainable blue VW export are reported in top-three hotspots of—Fars, Khuzestan, and South-Khorasan provinces. Per province, unit unsustainable blue VW exports (m3 ha−1) were estimated by dividing the total unsustainable blue VW export (m3 y−1) by the area of croplands (ha) in the specific province. (i.e., This Figure is created in the environment of ArcMap-GIS version 10.7).
The exported crop type from a hotspot (i.e., a region with BWS > 1) affects the absolute unsustainable blue VW export. Fars province has a lower contribution to the total inter-provincial crop export (11%) than the Khuzestan province (21%), but its contribution in total unsustainable blue VW export is larger. In the Fars province, cereals and fruits are major exports and both have higher unsustainable blue WF values compared to sugar crops (Table 2), which are major exports in the Khuzestan province. South-Khorasan province, however, has a lower unsustainable blue VW export value because of its smaller contribution in the total inter-provincial crop export (7%).
In sustainability assessment from the angle of blue VW export per unit of cropland (m3 ha−1), South-Khorasan is the most critical province among thirty provinces of Iran (Fig. 3b). It has the highest unit unsustainable blue WF value (4.53 thousand m3 ha−1), which is 122% and 112% higher than those in the provinces of Fars and Khuzestan. This is why the BWS value in South-Khorasan (9.1) is noticeably higher than those in Khuzestan (3.6) and Fars (2.2). Therefore, the fraction of unsustainable blue WF value for a specific crop in South-Khorasan is larger than the same crop in Fars or Khuzestan. Hence, South-Khorasan is the most vulnerable province to environmental deterioration and agricultural drought, and crop exports from this province is not justified from an environmental point of view.
CCFS scenario—the number of provinces with unsustainable blue VW export decreases from 23 to 22 provinces (Fig. 3c). This one different province is Old-Tehran, which includes New-Tehran as the capital of Iran with the largest population and rate of urbanization, but the smallest contribution in national croplands. As expected, the New-Tehran province consumes its domestic own crop production with little left to export. No export from this province leads to zero unsustainable blue VW export value. In other provinces, the inter-provincial unsustainable blue VW export varies from 0.02 billion m3 y−1 (Esfahan) to 1.76 million m3 y−1 (Fars). Nevertheless, the hotspot provinces remain unchanged; Fars, Khuzestan and South-Khorasan. These provinces have the largest contributions in the total unsustainable blue VW exports; accounting for 1.87 billion m3 y−1, 1.69 billion m3 y−1, and 1.46 billion m3 y−1, respectively. In addition, South-Khorasan has the highest unit of unsustainable blue VW export; although its value decreased by 5.1% to 4.3 thousand m3 ha−1 compared to the one under ICFS scenario (Fig. 3d).
The total and unit unsustainable blue VW export, for different crop categories between ICFS and CCFS scenarios were compared over the period 2005–2015 (Table 2).
Under ICFS scenario, a total of 26.3 billion m3 y−1 of blue VW is interprovincially exported; 55% (14.4 billion m3 y−1) of which is unsustainable. Cereals have the highest contribution (43%), followed by fruits (19%). Such high cereal production rates are due to its dominant contribution to the national croplands and productions (see Fig. S2 in the supplementary information). However, when unit unsustainable blue VW exports (m3 ha−1) are considered, producing sugar crops, fruits and nuts become less sustainable (Table 2).
Under the CCFS scenario, the total blue VW export decreases by 18% (21.5 billion m3 y−1), which in turn results in an 17% reduction in the total irrigated-crops export. Consequently, the total unsustainable blue VW export decreases by 15% (12.2 billion m3 y−1). Crop substitution in food diets also reduces crop-category-specific unsustainable blue VW export by 7% (in sugar crops) to 51% (in pulses). Similarly than in the ICFS scenario, cereals and fruits have major contributions in the overall inter-provincial unsustainable blue VW export, with 43% and 17% respectively. Unit unsustainable blue VW exports also decrease up to 51% while the critical crops remain the same as the values under the ICFS scenario.
Inter-provincial efficiency of blue VW export under the ICFS and CCFS scenarios
Under the ICFS scenario, except for Old-Tehran, the contribution of provinces to inefficient export varies from 0.18 billion m3 y−1 (Bushehr) to 0.92 billion m3 y−1 (Fars), as presented in Fig. 4. Three provinces of Fars, East-Azarbaijan, and South-Khorasan have the largest inefficient blue VW exports (11%, 9% and 8% respectively). In Fars and East-Azerbaijan provinces cereals are major contributors, while in South-Khorasan sugar crops are. The total irrigated-crop export from East-Azerbaijan (1.6 million t y−1) is 28% less than in the South-Khorasan province (2.2 million t y−1); however, its higher contribution in inefficient blue VW export is due to the export of cereals and fruits, both of which have higher inefficient blue WF values (m3 t−1) compared to sugar crops in South-Khorasan.
Figure 4.

Inter-provincial values of the total (a and c) and unit (b and d) inefficient blue virtual water (VW) exports under ICFS (left) and CCFS (right) scenarios. The contribution of eight crop categories in the total irrigated crop export and total inefficient blue VW export are reported in top-three hotspots of Fars, Khuzestan, and South-Khorasan provinces. Per province, unit inefficient blue VW exports (m3 ha−1) were estimated by dividing the total unsustainable blue VW export (m3 y−1) by the area of croplands (ha) in the specific province. (i.e., This Figure is created in the environment of ArcMap-GIS version 10.7).
Regarding unit inefficient blue VW export, the values (m3 ha−1) in Yazd, Homozgan, and Sistan are critical, as these provinces export larger rates of inefficient blue water (3451 m3 ha−1, 3056 m3 ha−1, and 2460 m3 ha−1, respectively).
Under the CCFS scenario, the inter-provincial inefficient blue VW export value is reduced from 0.01 million m3 y−1 (Bushehr, 0.1%) to 371 million m3 y−1 (Razavi-Khorasan, 69%). Hotspot provinces remain unchanged. The unit inefficient blue VW export decreases by 0.1–75% in different provinces compared to those under the ICFS scenario.
The total and unit inefficient blue VW export, for different crop categories between ICFS and CCFS scenarios were compared over the period 2005–2015 (Table 3).
Table 3.
Total and unit inefficient blue VW export for different crop categories under the ICFS and CCFS scenarios over the study period (2005–2015).
| Crop category | ICFS scenario | CCFS scenario | ||
|---|---|---|---|---|
| Inefficient blue VW export | Unit inefficient blue VW export | Inefficient blue VW export | Unit inefficient blue VW export | |
| (109 m3 y−1) | (m3 ha−1) | (109 m3 y−1) | (m3 ha−1) | |
| Cereals | 3.60 | 691 | 2.96 | 568 |
| Root and tuber | 0.13 | 611 | 0.13 | 611 |
| Sugar crops | 0.58 | 2653 | 0.50 | 2263 |
| Pulses | 0.53 | 1198 | 0.34 | 761 |
| Nuts | 0.91 | 1633 | 0.91 | 1633 |
| Oil crops | 0.32 | 1121 | 0.26 | 915 |
| Vegetables | 0.39 | 1451 | 0.36 | 1336 |
| Fruits | 1.99 | 2868 | 1.42 | 2042 |
| All crops | 8.45 | 1071 | 6.86 | 870 |
Under ICFS scenario, a total of 8.45 billion m3 y−1 of inefficient blue VW is inter-provincially exported (32% of total), 43% of which occurred from cereal lands and 24% from fruit lands. By the unit inefficient blue VW export is expressed in terms of m3 ha−1, where sugar- and fruit crops have the highest inefficient blue VW export.
Under CCFS scenario, the total inefficient blue VW export decreases by 19% to 6.86 billion m3 y−1. This reduction is, in turn, caused by 8% (for vegetables) to 37% (for pulses) reductions in crop-category-specific inter-provincial inefficient blue VW exports. Nevertheless, Cereals and fruits still have the highest contributions (43% and 21% respectively). In addition, critical crops regarding their unit inefficient blue VW export value (m3 ha−1) stay the same, as verifiable in the ICFS scenario.
Discussion
The sustainability and efficiency of crop production and VW trades under two food security scenarios of ICFS and CCFS were evaluated. Our results show that eating locally by adopting crop substitutions in food diets under the CCFS scenario improves the FSp value up to 210% compared to the ICFS scenario; this leads to an 17% reduction in the inter-provincial crop trade (Table 1).
Under the CCFS scenario, localized food marketing will be structured more efficiently; which helps farmers economically prosper. When farmers establish their own farm businesses, there is no need to split their incomes with the provincial trade brokers; hence consumers can additionally receive cheaper foods. On the other hand, food availability and accessibility may increase under CCFS scenario when inter-provincial food trade is not feasible. The distance between the trading partners is always a restriction to bilateral trades. Such a barrier could become more severe during circumstances such as the COVID19 pandemic. Indeed, inter-provincial crop trades increase the resilience in handling local shock (i.e., such as drought or the other natural or unnatural hazards which cause agricultural losses), but simultaneously increase the vulnerability to market shocks. Therefore, small-scale farming and local market improvements could serve as tools for reducing food dependency and valuing individual food producers23. At the same time, all provinces can contribute incrementally to local food production by promoting strategies, such as improving crop/water productivities, reducing food losses, and/or changing local food diets in order to increase local food availability.
Simultaneously, the environment benefits from local eating since inter-provincial food transportation is decreased under the CCFS scenario (Table 2), for instance, by reducing energy consumption and transportation-related GHG emissions24. Furthermore, less food transportation is associated with less food losses25,26. Food loss through transportation is translated into eco-environmental resource losses including water, energy and capital losses. Reduced inter-provincial food trade under the CCFS scenario results in a 16% reduction in unsustainable and a 19% reduction in inefficient inter-provincial blue VW export value (Tables 2 and 3). Indeed, the CCFS scenario lessens the pressure of in-need provinces on the exporting regions, in particular in hotspot provinces. An elimination of this pressure allows decision makers to use finite local resources more sustainably and efficiently in order to prioritize their own local demand in a sustainable manner.
Adverse impacts of food trades have been fostering movements towards increasing local food supply provisions, even at a global scale27,28, calling for a power shift from large agricultural companies and global markets to local actors that can lead to a more sustainable crop production23. Furthermore, it has been acknowledged that, ensuring the sustainability and stability of food security requires a broader assessment that is not restricted to technical aspects and includes economic, social and environmental factors. Hence, we tested the relationship between different agro-economic and socio-environmental indicators and FSP values (Fig. 5).
Figure 5.

The correlations between self-supplied provincial food security and the selected (i) environmental, (ii) agricultural, (iii) economic, and (iv) social indicators. (i.e., The Figure is created in the environment of Microsoft Office—Excel—version 10.).
Environmental indicators have various effects on the local FSp values. While FSp values positively correlate with per capita blue water availability (m3 cap−1) (Fig. 5i), they respond adversely to any increase in water availability per unit of cropland (m3 ha−1) (Fig. 5i). In regions with higher blue water availability per unit of cropland, the contribution of cereal production (dominant crops in Iranian’ food basket) into the total production is lower; which in turn results in lower FSp values.. This explains why farmers in these regions are in favor of cash crops (e.g. fruits) rather than staple crops. This finding is in line with the correlation between FSp values and BWS values (Fig. 5i); water-scarce provinces contribute more in staple crop production and have the highest FSp values. The cultivation of water-intensive crops in hotspots intensifies environmental deterioration rates and threatens sustainable agriculture. Consequently, long-term food security plans necessitate an urgent revision in the cropping pattern in these regions. Effective policies need to be implemented to bridge the gap between provincial food demands and supplies while considering environmental protection.
In addition, Fig. 5 shows that reducing the portion of inefficient blue water consumption helps improve FSp. Several researchers demonstrated the positive effects of crop redistribution on efficient water consumption9,29 besides other resilient agricultural practices30,31. Under the condition of climate change, implementing climate-resilient pathways in the agricultural sector is a necessity in attaining food security31. However, the effectiveness of these strategies differs per crop and per region, and should be fully investigated before implementation.
Agricultural indicators correlate well with the FSp values. The FSp value increases in response to a heightened availability of croplands (Fig. 5ii), particularly in irrigated croplands (Fig. 5). Over the study period 2005–2015, 59–100% of the overall FSp value is fulfilled by irrigated production (Table 1), which highlights the vital role of irrigated agriculture in food production in Iran. Smart long-term decisions in both irrigated and rainfed farming improves crop production per capita and smoothens the path for FSp values.
Ownership over farmland also has a positive correlation to food security at a provincial scale (Fig. 5). In Iran, small-scale farmers mainly cultivate staple crops for a higher contribution in their food baskets. Whereas, large-scale farms mostly produce cash crops with a higher unit value ($ t−1) and a smaller contribution in Iranian’s food basket, mainly cultivated for economic gains. This is aligned with the correlation between FSp values and gross income per unit of cropland ($ ha−1).
Economic indicators also correlate with FSp values. FSp value improves in response to gross income decrease ($ ha−1) (Fig. 5iii). Furthermore, gross income per unit of cropland declines when the size of cropland for each farmer increases (Fig. 5). For these farmers, agriculture is an activity catered towards nourishment rather than towards an economic gain. The stakeholders of large-scale farms are mainly commercial farmers who try to turn agriculture into an income-generating enterprise.
Small-scale farmers have key roles in food security provisions across the globe; about 80% of food security in the MENA region is supported by these farmers32. However, the livelihood of small-scale farmers is threatened when they unfairly compete with large-scale market-oriented farmers in national or global markets. Supporting small-scale farmers, the major producers of staple crops worldwide, and equipping them with appropriate skills enhances crop productivity and consequently, the total production of crops and diminishes unsustainable and inefficient water use in the agricultural sector. A comprehensive study conducted on 37 million ha of croplands in 57 developing countries claim that trained small-scale farmers who adopt sustainable agriculture can improve the crop yield by 79%33. Sustainable agriculture by small-scale farmers can terminate the unemployment rate in rural areas and may serve to motivate them in following national food production policies and contribute effectively in supplying local food demand.
Social indicators have a strong relationship with FSp values. An increase in population density (Fig. 5iv), in particular in the proportion of urban population (Fig. 5iv), results in a considerable reduction in food security. This may arise following adverse impacts of urbanization on food security, particularly due to a reduction in the per capita cropland availability and less food production. This is accompanied by changes from small-scale farming in rural areas to market-oriented cash crop farming. Our results illustrate a positive correlation between the proportion of urban population and the gross income obtained per unit of cropland. These findings align with Overman and Venables34, who stated that rapid urbanization in developing countries is a driver for their economic growth and development while posing a considerable threat to several different dimensions of food security35. The rapid growth of urbanization in most provinces of Iran36 requires an urgent and long-term action driven by policy makers to meet the future demands of the nation.
The role of gender in food security is also undeniable37,38. Our results revealed that rural women in each province have strategic roles in satisfying provincial food security. Larger ratio of female to male in rural areas per province reflects positively on the FSp rate (Fig. 5iv). While there are numerous studies which emphasize the key role of female farmers in food production and food security (e.g.39,40), they are rarely recognized in practice. In most developing countries, public policies and social institutes do not appreciate and support female farmers’ efforts adequately since most of the political and socio-economic determinants are extremely gendered (76); hence, female farmers continuingly face severe inequality, in terms of major development indicators, and precarity in many aspects (e.g.40–42). Increasing agricultural productivity therefore requires rethinking the fundamental role of women in providing food security, accompanied by structural and financial support (e.g., the inclusion of women’s empowerment components in food security programs) geared towards constructing gender-equality37. FAO stated that the feminization of agriculture in the Near East countries, including Iran, is less pronounced, and the number of female-headed households is considerably lower than male-headed ones5. Nevertheless, a large number of rural men have migrated to larger cities for higher-income jobs40. This is one of the reasons for the increasing number of female-headed families in recent years. More comprehensive research is required to evaluate the current state of affairs regarding gender relations and the role of female farmers in this matter.
Conclusion
In an attempt to attain food security in water-limited countries, in this research, we adopted two food security scenarios to assess the sustainability and efficiency of crop-related blue water consumption and VW trade in Iran: (1) ICFS, in which required calorie per capita is fulfilled by individual crops, and (2) CCFS scenario, in which eating local food is promoted and the required calorie is fulfilled by the crop category. First, food security, efficiency and sustainability of blue water consumption, and VW trades of each province were determined. Then, the impact of twelve agro-economic and socio-environmental indicators on the provincial food security were tested.
The main concluding remarks of this research are:
Crop production and trade in Iran imply inefficient and unsustainable blue water consumption under both ICFS and CCFS scenarios; this requires an effective, sustainable and long-term plan to meet the food security goal of the nation.
The CCFS scenario (eating locally) lowers the risk of food insecurity, since more provinces bridge the gap between their food supply and demand. However, in the case of Iran, these results can be effective only when present food production policies are revisited in favor of local crop products.
Restricting crop production in hotspot regions and adopting more efficient agriculture will help reduce inefficiency and unsustainability in crop-related water consumption which in turn results in higher levels of local food security.
Rapid urbanization poses a great threat to provincial food security. The number of market-oriented farmers is higher in provinces with higher urban populations; this translates to a diminished contribution in provincial food production and a higher contribution in unsustainable and inefficient blue water consumption.
Staple crops have the highest contribution in the national blue water consumption. Small-scale farmers are largely in favor of staple crops and, as such, could play a predominant role in provincial food security. This calls for action plans (e.g. provincial policies, national regulations, etc.) to support their activities.
Rural women play a key role in fulfilling food demands; gender-equitability programs in the crop production sector are inevitable for increasing provincial food security.
Due to data limitations, our study utilized data from the period 2005–2015, as the data on provincial blue water availability was solely available for this specified time frame. As such, the results can be further complemented as newer and more detailed data becomes available. Despite these unavoidable constrains, this study still makes an important contribution to science and policy making in Iran and many other water-limited countries with similar or worsened conditions in availability or accessibility to regional or national data.
We discussed possible solutions to alleviate inefficiency and unsustainability in crop-related water consumption and trade based on agro-economic and socio-environmental indicators. Further research is required to integrate different aspects of food security, including its governance in order to assess the consequences of implementing these solutions. This encompasses investigating the feasibility of adopting these strategies in practice, and not separate to the socio-political and environmental context in which solutions must arise. Additional studies are needed to assess the impact of climate change and the readiness and capacity of the country to adapt and change.
Materials and methods
Case study
Facing serious water scarcity, Iran was selected as a case study for this research (see Fig. S1 in the supplementary information). Such blue water scarcity is predominantly associated with the fact that Iran is historically a water scarce country43. A warming climate, frequent droughts, and adverse changes in annual precipitation and surface runoff complicate water shortage problems44. Furthermore, political and economic sanctions hampered the technological capacity of the country which had increasing ripple effects on blue water shortages, particularly in the agricultural sector43,45. Previous studies showed that, over the past decades, most water challenges in Iran were man-made due to the incompatibility of national and regional development plans for blue water to become available44,46. In other words, blue water demand had continuously exceeded its availability leading to the overexploitation of water resources20,22,43,47.
Iran spans an area of about 1.64 million km2; divided into 30 provinces up until 2009; and classified into five climatic zones20. The average national population over the study period of 2005–2015 was 75.1 million people, about 29% of which living in the rural area. The provincial population density and the portion of urban population varies in the ranges of 1.2–72.3 people km−2 and 49–95%, respectively. In 2009, Tehran province was divided into two provinces of Tehran and Alborz, dividing Iran into 31 provinces. The larger division of these two embraces 69% of the area and 83% of the population; we called it New-Tehran in this research. New-Tehran is the capital of Iran and the most-populated province; it has about 74% of irrigated area and 71% of crop production of Tehran during 2009–2015. Since there is no data for the Alborz during 2005–2009 (this province did not exist), we carried on with the initial administrative divisions of 30 provinces for the entire study period (2005–2015). This means that what we report for Tehran province after 2009, when it inherently includes the Alborz province.
Our study period is limited to 2005–2015 due to data limitations in one of major drivers in sustainability and efficiency assessment of the agricultural sector, namely the provincial blue water availability. Although other required data was available for longer periods, a short-term record of provincial blue water availability was the largest constraint for a longer study.
Twenty seven major irrigated crops of Iran were studied; they classified into eight categories of cereals (wheat, barley, maize, and rice), vegetables (tomato and onion), pulses (bean, pea, and lentil), roots and tubers (potato), sugar crops (sugar beet and sugar cane), oil crops (cottonseed, soybean, and canola), nuts (pistachio, walnut, almond, and hazelnut), and fruits (apple, banana, date, grape, lime, lemon, tangerine, orange, and grapefruit). Over the study period (2005–2015) a total of 46.7 million t y−1 crops were produced within the 7.9 million ha y−1 irrigated lands under these crops48. Considering all 27 crops, arid and semi-arid regions were main crop producers of the country; arid regions by covering 51% of the total harvested area and 62% of crop production, and semi-arid regions by covering 29% of the total harvested area and 23% of crop production (see Fig. S2 in the supplementary information). Sugar crops and cereals were the main irrigated crop categories in the arid and semi-arid regions, respectively, regarding their contributions in regional production of the irrigated crops (30% and 41%, respectively).
Food security assessment and crop export
To assess the (self-sufficient) food security level of each province (FSP), two scenarios were developed: Individual Crop Food Security (ICFS) and Crop Category Food Security (CCFS).
ICFS: to feed the population of each province, the required calories per capita need to be fulfilled from each crop. FSP value is less than 100%, when at minimum for one crop, the demand (required calorie from a specific crop) is higher than its local supply.
In this scenario, FSP value was estimated per province using Eq. (1):
| 1 |
where is per capita demand (calorie cap−1), is per capita local supply (i.e., supplied through production within the considered province, calorie cap−1), i is the number of a specific crop (i = 1–27), and p denotes the province.
A province exports a specific crop when its per capita production is higher than its per capita demand. Then the volume of annual export of each crop from each province (, t y−1) is estimated by multiplying per capita surplus production and province population. Per province, surplus calorie production (per capita) for each crop (, t y−1) is estimated under ICFS using Eq. (2):
| 2 |
where is a ratio for converting calorie to kilogram for crop i in province p (kg cal−1), and i is the number of a specific crop.
CCFS: to feed the population of each province, the required calories per capita are fulfilled by each crop or a substituted crop within the crop category. In this scenario, the deficit production for a specific crop is compensated by the calorie provided by other crops in that category. For instance, wheat deficit can be compensated by any cereal. The FSP value is less than 100%, when at least for one crop category, the required calorie is less than its local supply.
In this scenario, the FSP value was estimated per province using Eq. (3):
| 3 |
where j is the number of crop category (j = 1–8), p denotes the province. Per province, surplus calorie production (per capita) for each crop (, t y−1) is estimated the CCFS scenarios using Eq. (4):
| 4 |
| 5 |
where j is the number of the crop category in which crop i is located.
Due to lack of data on inter-provincial crop trade, this study does not incorporate real conditions, as an individual scenario. This modeling exercise is limited with the best knowledge and data we have in the time of publication. We assessed possible pathways under certain assumptions to explore the extent and magnitude of their impacts in the case of implementation. Our findings inform decision-makers about their options and how likely each option affects agro-economic and socio-environmental settings from a water and food security perspective on provincial or national scales.
Since our main focus is on assessing internal trades and introducing opportunities to optimize the utilization of internal water resources in favor of food security in a sustainable manner, external trades were excluded from our assessments.
Sustainability and efficiency assessment
The sustainability of blue water consumption or VW trade is assessed based on two key indices of (1) water stress index (WSI), developed by Pfister et al.49, and (2) blue water scarcity (BWS), developed by Hoekstra et al.7,50. The WSI combines the utilization of water resources with their environmental impacts to qualify water resource sustainability. It ranges from 0 to 100%, indicating the percentage of freshwater use which was consumed at the expense of depriving the other users from freshwater. The applicability of this index was demonstrated through a global life cycle assessment of cotton production by Pfister et al.49. The BWS is defined as the ratio of total blue water consumption (i.e., total blue WF value) to the local blue water availability. The BWS = 1 indicates that the sustainable available blue water has been fully consumed. A BWS > 1 denotes that blue water has been consumed at the expense of violating environmental flow requirements; hence, the portion of the consumptive blue WF value beyond its sustainable level is labelled “unsustainable consumption”. We applied BWS in the current research to assess the sustainability of water consumption and VW trade.
To assess the efficiency of blue water consumption and VW trade, we applied the concept of WF benchmarking. Earlier researchers indicated that WF benchmarking is a promising strategy for reducing the inefficient blue water consumption through the crop production process22,51,52.
WF of crop production
WF calculations were done per crop, per province and per year. Crop’s daily ET was simulated by the AquaCrop model53. The following daily soil water balance is simulated by the model for the rooting zone using Eq. (6).
| 6 |
where and are the soil water content at the end of day t and t − 1, respectively, is precipitation, is irrigation, is capillary rise, is evapotranspiration, is surface runoff, and is deep percolation on day t. All parameters are in mm day−1.
Green and blue WF values were estimated by dividing the seasonal green and blue evapotranspiration (ET, m3 ha−1) by crop yield (t ha−1), respectively7. I and CR were considered blue water; and P was considered green water. CR was divided into green and blue CR based on the ratio of P and I into P + I, respectively. DP and ET were divided into green and blue components based on the fraction of Sgreen and Sblue in total S at the end of the previous day. Finally, soil green and blue water contents were estimated as follows54:
| 7 |
| 8 |
Seasonal green and blue ET were then calculated by aggregating the daily green and blue ET over the whole growing period of the crop.
To take the variation of per capita water demand across provinces into account, the total blue water consumption of a specific crop (, m3 y−1) for each province was calculated as follows by Eq. (9).
| 9 |
where is blue WF value of crop i in province p (m3 t−1), and is the provincial production volume of crop i (t y−1). Summing up all crops grown in a specific province, provincial blue water consumption of crop production was then estimated.
Sustainability and efficiency of blue WFs
Sustainability of blue WFs—Provincial blue water scarcity (BWS) is calculated by dividing by local blue water availability in a province50. Per province, local water availability was calculated as local natural runoff minus environmental flow requirement7. The latter was assumed as 80% of the local natural runoff following Richter et al.55. BWS ≤ 1 implies that part of the local water availability is still left for the environmental flow; hence, is sustainable. When BWS > 1, then part of the will be unsustainable and could be calculated as follows:
| 10 |
where is local water availability in province p (m3 y−1).
Efficiency of blue WFs—To assess the efficiency of WFs related to crop production, the blue WF benchmarks levels were considered as references. If the provincial blue WF value of a specific crop is less than its blue WF benchmark, that crop’s production will be efficient18. Here, the climate-specific blue WF benchmarks calculated by Karandish et al.22 for the 27 crops grown in the study area were considered in the efficiency assessment. Per crop and per province, the inefficient (, m3 y−1) were then calculated using Eq. (11).
| 11 |
where is the blue WF benchmark for crop i in province p. Summing up all crops grown in the considered province, the total inefficient blue WF values related to crop production were calculated.
Sustainability and efficiency of inter-provincial VW export
Per province, the total gross inter-provincial blue VW export (, m3 y−1) related to the 27 selected crops was estimated as follows:
| 12 |
where is the volume of annual export of crop i from province p (t y−1), and is the provincial blue WF value per unit production of crop i (m3 t−1). Having the , the unsustainable and inefficient (i.e., and , respectively, expressed in m3 y−1) was determined as follows.
| 13 |
| 14 |
Normalizing the results
Since different provinces have different areas and resources, we provided normalized values per provincial crop export, blue WF value and blue VW export (i.e., total, unsustainable, and inefficient) to make them comparable. In this regard, we divided the given results by provincial harvested area. For instance, for a specific province, the unit unsustainable blue WF value (m3 ha−1) was estimated by dividing the unsustainable blue WF value (m3) by the harvested area of 27 crops in that province (ha−1). The same procedure was adopted for other indices.
Agricultural, economic, environmental and social indicators
We assessed the relationship between provincial food security level, agro-economic and socio-environmental factors. Considering limitations in data availability and the available literature, we shortlisted key agro-economic and socio-environmental indicators and studied the relationship between food security and these indicators at a province scale (see Table S1 in the supplementary information). These indicators include:
Agricultural indicators: cropland availability, irrigated land availability, and cropland authorship.
Social indicators: population density, urban/rural portion, and female/male portion.
Economic indicators: gross income from cropland, gross income per capita, and gross income per rural capita.
Environmental indicators: water availability per unit of cropland, per capita water availability, and BWS.
Data
The required data was obtained per crop, per province and per year over the study period (2005–2015). Meteorological data was obtained from 52 synoptic stations spread over the study area56. The provincial averages were then acquired from local and national organizations and fed into the AquaCrop model. Soil features were extracted from the 5 × 5 arc min raster maps provided by Batjes57 and were then converted into provincial average values. Provincial natural runoff received from national reports were provided by the Water Resource Management Company (WRM)58. All agricultural data including cropping calendars (i.e., the growing periods), agricultural practices and water management were supplied by the Ministry of Agriculture Jihad of Iran (IMAJ)48 which were compiled from provincial reports. Producer prices for each crop in each province were procured from the IMAJ48. Provincial per capita crop demands were derived from data published by the Statistical Center of Iran59. More details are available in Table S2 in the supplementary information.
Supplementary Information
Acknowledgements
We would like to thank the reviewers of the manuscript for their constructive comments. Thanks to Ms. Manuela Rosso—Brugnach for proofreading the article. This Project has received funding from the European Research Council (ERC) under the European Union’s Horizon 2020 research and innovation program (Earth@lternatives Project, Grant agreement No 834716). Brugnach is supported by the Spanish Government through María de Maeztu excellence accreditation 2018–2022 (Ref. MDM-2017-0714) of BC3.
Author contributions
F.K. and H.N. conceived and designed the research. F.K. performed the modeling work. F.K., H.N., and M.B. analyzed the results and wrote and revised the paper.
Competing interests
The authors declare no competing interests.
Footnotes
Publisher's note
Springer Nature remains neutral with regard to jurisdictional claims in published maps and institutional affiliations.
Supplementary Information
The online version contains supplementary material available at 10.1038/s41598-021-93928-9.
References
- 1.Mc Carthy U, Uysal I, Badia-Melis R, Mercier S, O'Donnell C, Ktenioudaki A. Global food security—Issues, challenges and technological solutions. Trends Food Sci. Technol. 2018;77:11–20. doi: 10.1016/j.tifs.2018.05.002. [DOI] [Google Scholar]
- 2.Meza I, Siebert S, Döll P, Kusche J, Herbert C, Rezaei EE, Nouri H, Gerdener H, Popat E, Frischen F, Naumann G, Vogt JV, Walz Y, Sebesvari Z, Hagenlocher M. Global-scale drought risk assessment for agricultural systems. Nat. Hazards Earth Syst. Sci. (NHESS) 2020;20:695–712. doi: 10.5194/nhess-20-695-2020. [DOI] [Google Scholar]
- 3.Fitton N, Alexander P, Arnell N, Bajzelj B, Calvin K, Doelman J, Gerber JS, Havlik P, Hasegawa T, Herrero M, Krisztin T, van Meijl H, Powell T, Sands R, Stehfest E, West PC, Smith P. The vulnerabilities of agricultural land and food production to future water scarcity. Global Environ. Chang. 2019;58:101944. doi: 10.1016/j.gloenvcha.2019.101944. [DOI] [Google Scholar]
- 4.d'Amour CB, Reitsma F, Baiocchi G, Barthel S, Guneralp B, Erb KH, Haberl H, Creutzig F, Seto KC. Future urban land expansion and implications for global croplands. Proc. Natl. Acad. Sci. U.S.A. 2017;114:8939–8944. doi: 10.1073/pnas.1606036114. [DOI] [PMC free article] [PubMed] [Google Scholar]
- 5.Karandish F. Improved soil–plant water dynamics and economic water use efficiency in a maize field under locally water stress. Arch. Agron. Soil Sci. 2016;62(9):1311–1323. doi: 10.1080/03650340.2015.1135326. [DOI] [Google Scholar]
- 6.WEF. World Economic Forum: Water Crises are a Top Global Riskhttps://www.weforum.org/agenda/2015/01/why-world-water-crises-are-a-top-global-risk/ (2015).
- 7.Hoekstra AY, Chapagain AK, Aldaya MM, Mekonnen MM. The Water Foot-print Assessment Manual: Setting the Global Standard. Earthscan; 2011. [Google Scholar]
- 8.Nouri H, Stokvis B, Galindo A, Hoekstra AY. Water scarcity alleviation through water footprint reduction in agriculture: The effect of soil mulching and drip irrigation. Sci. Total Environ. 2019;653:241–252. doi: 10.1016/j.scitotenv.2018.10.311. [DOI] [PubMed] [Google Scholar]
- 9.Nouri H, Stokvis B, Chavoshi S, Hoekstra AY. Reduce blue water scarcity and increase nutritional and economic water productivity through changing the cropping pattern in a catchment. J. Hydrol. 2020 doi: 10.1016/j.jhydrol.2020.125086. [DOI] [Google Scholar]
- 10.Nouri, H., Chavoshi S. & Hoekstra, A. Y. The Blue Water Footprint of Urban Green Spaces: An Example for Adelaide, Australia, Landscape and Urban Planning, 190-103690 (2019b).
- 11.Mekonnen MM, Hoekstra AY. Water footprint benchmarks for crop production: A first global assessment. Ecol. Indic. 2014;46:214–223. doi: 10.1016/j.ecolind.2014.06.013. [DOI] [Google Scholar]
- 12.Liu WF, Antonelli M, Kummu M, Zhao X, Wu PT, Liu JG, Zhuo L, Yang H. Savings and losses of global water resources in food-related virtual water trade. WIREs Water. 2019;6:e1320. doi: 10.1002/wat2.1320. [DOI] [Google Scholar]
- 13.Hoekstra AY, Mekonnen MM. The water footprint of humanity. Proc. Natl. Acad. Sci. 2012;109(9):3232–3237. doi: 10.1073/pnas.1109936109. [DOI] [PMC free article] [PubMed] [Google Scholar]
- 14.Konar M, Dalin C, Hanasaki N, Rinaldo A, Rodriguez-Iturbe I. Temporal dynamics of blue and green virtual water trade networks. Water Resour. Res. 2012;48:7509. doi: 10.1029/2012WR011959. [DOI] [PMC free article] [PubMed] [Google Scholar]
- 15.Zhao X, Li YP, Yang H, Liu WF, Tillotson MR, Guan D, Yi Y, Wang H. Measuring scarce water saving from interregional virtual water flows in China. Environ. Res. Lett. 2018;13:054012. doi: 10.1088/1748-9326/aaba49. [DOI] [Google Scholar]
- 16.Berger M, Campos J, Carolli M, Dantas I, Forin S, Kosatica E, Kramer A, Mikosch N, Nouri H, Schlattmann A, Schmidt F, Schomberg A, Semmling E. Advancing the water footprint into an instrument to support achieving the SDGs—Recommendations from the “Water as a Global Resources” research initiative (GRoW) Water Resour. Manag. 2021 doi: 10.1007/s11269-021-02784-9. [DOI] [Google Scholar]
- 17.Faramarzi M, Yang H, Mousavi J, Schulin R, Binder CR, Abbaspour KC. Analysis of intra-country virtual water trade strategy to alleviate water scarcity in Iran. HESS. 2010;14:1417–1433. [Google Scholar]
- 18.Hoekstra AY, Mekonnen MM. Imported water risk: the case of the UK. Environ. Res. Lett. 2016;11:055002. doi: 10.1088/1748-9326/11/5/055002. [DOI] [Google Scholar]
- 19.Micosch N, Becker R, Schelter L, Berger M, Usman M, Finkbeiner M. High resolution water scarcity analysis for cotton cultivation areas in Punjab, Pakistan. Ecol. Indic. 2020;109:669. [Google Scholar]
- 20.Karandish F, Hoekstra AY. Informing national food and water security policy through water footprint assessment: The case of Iran. Water. 2017;9:831. doi: 10.3390/w9110831. [DOI] [Google Scholar]
- 21.EcoMENA. Water Scarcity in MENAhttps://www.ecomena.org/water-scarcity-in-mena/ (2020).
- 22.Karandish F, Hoekstra AY, Hogeboom RJ. Groundwater saving and quality improvement by reducing water footprints of crops to benchmarks levels. AdWR. 2018;121:480–491. [Google Scholar]
- 23.Burnett K, Murphy S. What place for international trade in food sovereignty? J. Peasant. Stud. 2014;41:1065–1084. doi: 10.1080/03066150.2013.876995. [DOI] [Google Scholar]
- 24.Kreidenweis U, Lautenbach S, Koellner T. Regional or global? The question of low-emission food sourcingaddressed with spatial optimization modelling. Environ. Model. Softw. 2016;82:128–141. doi: 10.1016/j.envsoft.2016.04.020. [DOI] [Google Scholar]
- 25.FAO . Global Food Losses and Food Waste. Study Conducted for the International Congress SAVE FOOD at Interpack2011 Düsseldorf, Germany. Food and Agriculture Organization of the United Nations; 2011. [Google Scholar]
- 26.Karandish F, Hoekstra AY, Hogeboom RJ. Reducing food waste and changing cropping patterns to reduce water consumption and pollution in cereal production in Iran. J. Hydrol. 2020;586:124881. doi: 10.1016/j.jhydrol.2020.124881. [DOI] [Google Scholar]
- 27.DuPuis EM, Goodman D. Should we go "home" to eat?: Toward a reflexive politics of localism. J. Rural Stud. 2005;21:359–371. doi: 10.1016/j.jrurstud.2005.05.011. [DOI] [Google Scholar]
- 28.Hinrichs CC. The practice and politics of food system localization. J. Rural Stud. 2003;19:33–45. doi: 10.1016/S0743-0167(02)00040-2. [DOI] [Google Scholar]
- 29.Chouchane H, Krol MS, Hoekstra AY. Changing global cropping patterns to minimize blue water scarcity in the world's hotspots. Hydrol. Earth Syst. Sci. Discuss. 2020;24:3015–3031. doi: 10.5194/hess-24-3015-2020. [DOI] [Google Scholar]
- 30.Coomes OT, Barham BL, MacDonald GK, Ramankutty N, Chavas JP. Leveraging total factor productivity growth for sustainable and resilient farming. Nat. Sustain. 2019;2:22–28. doi: 10.1038/s41893-018-0200-3. [DOI] [Google Scholar]
- 31.Lipper L, Thornton P, Campbell BM, Baedeker T, Braimoh A, Bwalya M, Caron P, Cattaneo A, Garrity D, Henry K, Hottle R, Jackson L, Jarvis A, Kossam F, Mann W, McCarthy N, Meybeck A, Neufeldt H, Remington T, Sen PT, Sessa R, Shula R, Tibu A, Torquebiau EF. Climate-smart agriculture for food security. Nat. Clim. Change. 2014;4:1068–1072. doi: 10.1038/nclimate2437. [DOI] [Google Scholar]
- 32.FAO. Smallholders and Family Farmers (Food and Agricultural Organization of the United Nations, Fact Sheet) http://www.fao.org/docrep/018/ar588e/ar588e.pdf (2013).
- 33.Pretty J, Bharucha ZP. Sustainable intensification in agricultural systems. Ann. Bot. 2014;114:1571–1596. doi: 10.1093/aob/mcu205. [DOI] [PMC free article] [PubMed] [Google Scholar]
- 34.Overman, H. G. & Venables, A. J. Cities in the Developing World. CEP Discussion Paper No 695 36p (2005).
- 35.Jagannathan R, Patzer RE. Urbanization and kidney function decline in low and middle income countries. BMC Nephrol. 2017;18:1–4. doi: 10.1186/s12882-017-0685-4. [DOI] [PMC free article] [PubMed] [Google Scholar]
- 36.SCI. Statistical Center of Iran, Tehran, Iranhttp://www.amar.org.ir (2016).
- 37.Clement F, Buisson MC, Leder S, Balasubramanya S, Saikia P, Bastakoti R, Karki E, van Koppen B. From women's empowerment to food security: Revisiting global discourses through a cross-country analysis. Global Food Secur. 2019;23:160–172. doi: 10.1016/j.gfs.2019.05.003. [DOI] [Google Scholar]
- 38.OXFAM. Gender Inequalities and Food Insecurity: Ten Years After the Food Price Crisis, Why are Women Farmers Still Food-Insecure? Oxfam Briefing Paper 2019 https://reliefweb.int/sites/reliefweb.int/files/resources/bp-gender-inequalities-food-insecurity-150719-en.pdf (2019).
- 39.Sraboni E, Malapit HJ, Quisumbing AR, Ahmed AU. Women's empowerment in agriculture: What role for food security in Bangladesh? World Dev. 2014;61:11–52. doi: 10.1016/j.worlddev.2014.03.025. [DOI] [Google Scholar]
- 40.Rao N. The achievement of food and nutrition security in South Asia is deeply gendered. Nat. Food. 2020;1:206–209. doi: 10.1038/s43016-020-0059-0. [DOI] [Google Scholar]
- 41.Lentz EC. Complicating narratives of women's food and nutrition insecurity: Domestic violence in rural Bangladesh. World Dev. 2018;104:271–280. doi: 10.1016/j.worlddev.2017.11.019. [DOI] [Google Scholar]
- 42.Chilton MM, Rabinowich JR, Woolf NH. Very low food security in the USA is linked with exposure to violence. Public Health Nutr. 2014;17(1):73–82. doi: 10.1017/S1368980013000281. [DOI] [PMC free article] [PubMed] [Google Scholar]
- 43.Madani K. Water management in Iran: What is causing the looming crisis? J. Environ. Stud. Sci. 2014;4(4):315–328. doi: 10.1007/s13412-014-0182-z. [DOI] [Google Scholar]
- 44.Moshir Panahi D, Kalantari Z, Ghajarnia N, Seifollahi-Aghmiuni S, Destouni G. Variability and change in the hydro-climate and water resources of Iran over a recent 30-year period. Sci. Rep. 2020;10(1):7450. doi: 10.1038/s41598-020-64089-y. [DOI] [PMC free article] [PubMed] [Google Scholar]
- 45.Madani K, AghaKouchak A, Mirchi A. Iran’s socio-economic drought: Challenges of a water-bankrupt nation. Iran. Stud. 2016;49(6):997–1016. doi: 10.1080/00210862.2016.1259286. [DOI] [Google Scholar]
- 46.Maghrebi M, Noori R, Bhattarai R, Mundher Yaseen Z, Tang Q, Al-Ansari N, Danandeh-Mehr A, Karbassi A, Omidvar J, Farnoush H, Torabi-Haghighi A, Klove B, Madani K. Iran's agriculture in the anthropocene. Earth's Future. 2020;8(9):e2020EF001547. doi: 10.1029/2020EF001547. [DOI] [Google Scholar]
- 47.Mirzaei A, Saghafian B, Mirchi A, Madani K. The groundwater–energy–food nexus in Iran's agricultural sector: Implications for water security. Water. 2019;11(9):1835. doi: 10.3390/w11091835. [DOI] [Google Scholar]
- 48.IMAJ. Iran's Ministry of Agriculture Jihad, Tehran, Iranwww.maj.ir (2020).
- 49.Pfister S, Koehler A, Hellweg S. Assessing the environmental impacts of freshwater consumption in LCA. Environ. Sci. Technol. 2009;43:4098–4104. doi: 10.1021/es802423e. [DOI] [PubMed] [Google Scholar]
- 50.Hoekstra AY, Mekonnen MM, Chapagain AK, Mathews RE, Richter BD. Global monthly water scarcity: Blue water footprints versus blue water availability. PLoS ONE. 2012;7:e32688. doi: 10.1371/journal.pone.0032688. [DOI] [PMC free article] [PubMed] [Google Scholar]
- 51.Brauman KA, Siebert S, Foley JA. Improvements in crop water productivity increase water sustainability and food security-a global analysis. Environ. Res. Lett. 2013;8:024030. doi: 10.1088/1748-9326/8/2/024030. [DOI] [Google Scholar]
- 52.Mekonnen MM, Hoekstra AY. The green, blue and grey water footprint of crops and derived crop products. HESS. 2011;15:1577–1600. [Google Scholar]
- 53.Allen, R. G., Pereira, L. S., Raes, D. & Smith, M. Crop Evapotranspiration: Guideline for Computing Crop Water Requirements. FAO No. 56 (FAO, 1998).
- 54.Hoekstra AY. Green-blue water accounting in a soil water balance. Adv. Water Resour. 2019;129:112–117. doi: 10.1016/j.advwatres.2019.05.012. [DOI] [Google Scholar]
- 55.Richter BD, Davis MM, Apse C, Konrad C. A presumptive standard for environmental flow protection. River Res. Appl. 2012;28:1312–1321. doi: 10.1002/rra.1511. [DOI] [Google Scholar]
- 56.IRIMO. Islamic Republic of Iran’s Meteorological Organizationhttp://www.irimo.ir/far/index.php (2020).
- 57.Batjes, N. H. ISRIC-WISE Global Data Set of Derived Soil Properties on a 5 By 5 Arc-Minutes Grid (Version 1.2); Report 2012/01 (ISRIC World Soil Information, 2012).
- 58.WRM. Iran’s Water Resource Management Companyhttp://daminfo.wrm.ir/fa/home (2016).
- 59.SCI. Statistical Center of Iranhttps://amar.org.ir/english (2021).
Associated Data
This section collects any data citations, data availability statements, or supplementary materials included in this article.