INTRODUCTION
In 2001, the Centers for Medicare and Medicaid Services (CMS) introduced the New Technology Add-on Payment (NTAP) program to incentivize utilization of new inpatient technologies in the Medicare population. Technologies are eligible for NTAP if they (1) are new (within 2–3 years of market introduction), (2) substantially improve the diagnosis or treatment relative to currently available technologies, and (3) are inadequately paid otherwise under the current diagnosis-related group (DRG) reimbursement rates.1 Technologies are eligible for a duration of 1–2 years, until the DRG reimbursement rate is recalculated.
Initially, the NTAP amount was set equal to the lesser of 50% of the new technology’s price or total amount of the case above the existing DRG reimbursement rate.2 However, in 2019, CMS increased this to 65%. Furthermore, an alternative path was created for technologies with a Breakthrough Device designation from the US Food and Drug Administration (FDA) to receive NTAP approval without demonstrating substantial clinical improvement.3
The aim of this study was to analyze the adoption and long-term trends in use of technologies approved in the NTAP program.
METHODS
From 2003 to 2019, there were 39 technologies approved for NTAP. We used Healthcare Cost and Utilization Project (HCUP) National Inpatient Sample data to estimate annual counts of each international classification of diseases (ICD) code assigned to these technologies for the Medicare population. We then formally assessed time trends for 9 of the 39 technologies approved for NTAP in earlier years to allow for a follow-up period of at least 4 years. We analyzed utilization rates for the period before (post-FDA approval) and after the start of the NTAP program using a mixed-effects Poisson model. We also assessed utilization before, during, and after the NTAP program. Finally, we used a linear mixed-effects “first difference” model to control for technologies’ unobserved differences and compared the change in utilization after the NTAP start year to annual changes among remaining years. We estimated variance by clustering for technology.
RESULTS
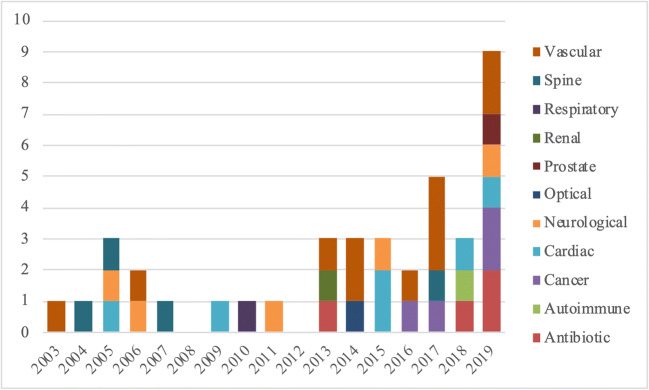
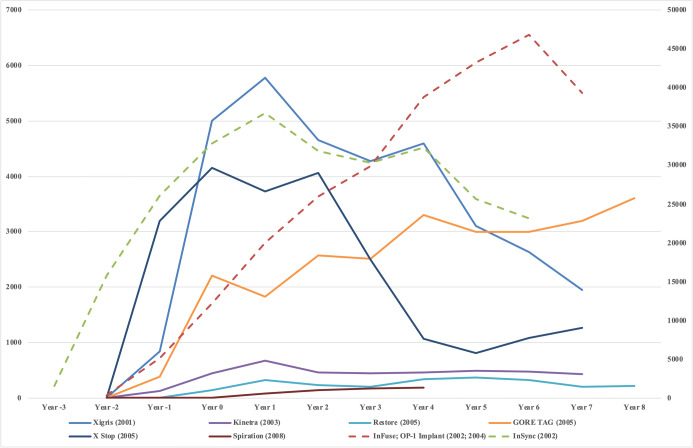
The trend in the number of approved technologies in the NTAP program has increased in recent years, peaking in 2019 (Fig. 1). The largest categories of approved new technologies were vascular (28%), cardiac (15%), and neurological (13%). For the 8 (InFuse and OP-1 Implant have been combined because of product similarity) technologies with long-term utilization data available, 4 technologies had utilization peak during the NTAP period with subsequent decline, 2 technologies had utilization steadily increasing with time since FDA approval, and the remaining 2 technologies had utilization remaining low (Fig. 2).
Figure 1.
NTAP approvals by technology type. The count of NTAP approvals color-coded by technology type from 2003 to 2019.
Figure 2.
Adoption and trends in NTAP-approved technologies. The lifecycle of each NTAP-approved technology starts at the year of FDA approval (year 2 for all technologies, besides InSync). Year 0 designates the start of the NTAP period. The NTAP period consists of years 0 and 1 (2-year duration) for all technologies, except for Restore and X Stop, which only were eligible for NTAP in year 0 (1-year duration). To normalize scale across technologies, we use a different y-axis (the right axis) for InFuse/OP-1 Implant and InSync because they have a magnitude higher utilization; other technologies are shown on the left y-axis. Please note that InFuse and OP-1 Implant have been combined for analysis purposes because of product similarity.
After adjusting for years since FDA approval, there was an increase of 134% in utilization from the period before to after the start of NTAP periods (rate ratio [RR] = 2.34; 95% confidence interval [CI], 1.25–4.40). Each 1-year increase since FDA approval resulted in a 6% increase in utilization (RR = 1.06; 95% CI, 0.94–1.19). The time period before the NTAP program had lower utilization (RR = 0.45; 95% CI, 0.24–0.83) and the time period after NTAP had similar utilization (RR = 1.21; 95% CI, 0.97–1.52) compared with the NTAP time period. The start year of the NTAP period was associated with a significant increase in utilization of 2583 encounters (95% CI, 50–5115) compared with annual changes across other years.
DISCUSSION
Our analysis indicates that CMS’ NTAP program appears to fulfill its objective significantly increasing adoption of new technologies at current add-on payment rates. Furthermore, on average, increases in usage were sustained following the NTAP period, indicating that recalculated DRG-based reimbursements may be appropriate.
To our knowledge, the analysis of adoption and utilization trends of technologies approved in the NTAP program has not been previously published. Other strengths of this study include the large sample size in the HCUP database and robust statistical modeling. Limitations of our study include the restricted number of technologies with long-term utilization data and the inability of making comparisons with similar technologies not eligible for NTAP.
Our findings may impact payer decisions about implementation and expansion of NTAP programs to improve adoption of novel technologies. Further research is warranted to address comparative effectiveness of varying reimbursement rates for NTAPs, impact of DRG payment recalculations resulting in adequate reimbursement following NTAP periods, and cost-effectiveness of NTAP programs.
Compliance with Ethical Standards
Conflict of Interest
The authors declare that they do not have a conflict of interest.
Footnotes
Jacob R. Morey and Margaret Katana contributed equally as co-first authors.
Publisher’s Note
Springer Nature remains neutral with regard to jurisdictional claims in published maps and institutional affiliations.
References
- 1.Medicare Program; Town Hall Meeting on the FY 2021 Applications for New Medical Services and Technologies Add-On Payments. In. Centers for Medicare & Medicaid Services (CMS), HHS. Federal Register; 2019.
- 2.Clyde AT, Bockstedt L, Farkas JA, Jackson C. Experience with Medicare's new technology add-on payment program. Health Affairs (Project Hope). 2008;27(6):1632–1641. doi: 10.1377/hlthaff.27.6.1632. [DOI] [PubMed] [Google Scholar]
- 3.Medicare Program; Hospital Inpatient Prospective Payment Systems for Acute Care Hospitals and the Long-Term Care Hospital Prospective Payment System and Policy Changes and Fiscal Year 2020 Rates; Quality Reporting Requirements for Specific Providers; Medicare and Medicaid Promoting Interoperability Programs Requirements for Eligible Hospitals and Critical Access Hospitals. In: Centers for Medicare & Medicaid Services (CMS) H, ed. Vol 84 FR 42044. Federal Registrar; 2019.


