

Abstract
Memory B cell reserves can generate protective antibodies against repeated SARS-CoV-2 infections, but with unknown reach from original infection to antigenically drifted variants. We charted memory B cell receptor-encoded antibodies from 19 COVID-19 convalescent subjects against SARS-CoV-2 spike (S) and found seven major antibody competition groups against epitopes recurrently targeted across individuals. Inclusion of published and newly determined structures of antibody-S complexes identified corresponding epitopic regions. Group assignment correlated with cross-CoV-reactivity breadth, neutralization potency, and convergent antibody signatures. Although emerging SARS-CoV-2 variants of concern escaped binding by many members of the groups associated with the most potent neutralizing activity, some antibodies in each of those groups retained affinity—suggesting that otherwise redundant components of a primary immune response are important for durable protection from evolving pathogens. Our results furnish a global atlas of S-specific memory B cell repertoires and illustrate properties driving viral escape and conferring robustness against emerging variants.
Keywords: antibody, memory, B cell, COVID-19, SARS-CoV-2, repertoire, breadth, variants, cross-reactivity, neutralization
Graphical abstract
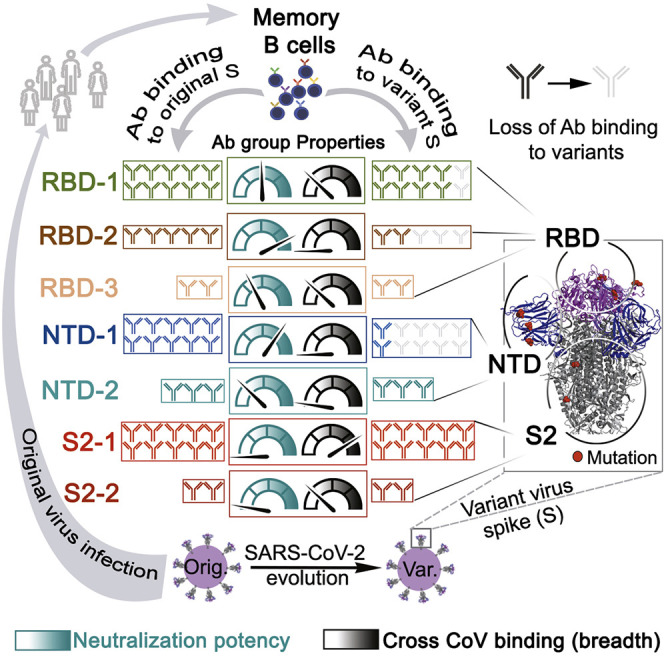
Unbiased charting of memory B cell receptor-encoded antibodies from COVID-19 convalescent subjects identifies seven major antibody competition groups recognizing epitopic regions with group assignment correlating with cross-CoV-reactivity breadth and neutralization potency. SARS-CoV-2 variants tend to escape antibodies from groups with the most potent neutralizers, but many retain affinity, showing that redundant components of a primary immune response establish durable protection from evolving pathogens.
Introduction
Coronavirus (CoV) disease 2019 (COVID-19), caused by the severe acute respiratory syndrome (SARS) CoV-2, has become a pandemic of historic effect. Although vaccines have been developed in record time, new variants continue to emerge and threaten to evade immune responses. We need to understand how SARS-CoV-2 is recognized and remembered by the immune system to illuminate requirements for broad protective immunity in humans. We focus on B cells, because antibodies, a key part of the immune defense, are sufficient to protect against SARS-CoV-2 infection in animal models (Robbiani et al., 2020; Schäfer et al., 2021).
Antibodies are both soluble effector molecules and the antigen-receptor component of the B cell receptor (BCR). BCRs evolve enhanced pathogen binding through immunoglobulin (Ig) gene somatic hypermutation (SHM) and selection in lymphoid tissue germinal centers (GCs), leading to antibody affinity maturation (Victora and Nussenzweig, 2012) and generation of both antibody-secreting plasma cells (PCs) and memory B cells. Higher avidity interactions encourage terminal differentiation of B cells into PCs; memory B cells frequently have lower avidity but more cross-reactive specificities (Akkaya et al., 2020).
Both PC-derived secreted antibody and memory B cells supply immune memory to prevent repeat infection, but with non-redundant roles. Secreted antibodies can prophylactically thwart pathogen invasion with fixed recognition capability, while memory B cells harbor expanded pathogen recognition capacity and can differentiate quickly into PCs to contribute dynamically to the secreted antibody repertoire (Akkaya et al., 2020). Moreover, memory B cells retain plasticity to adapt to viral variants through GC re-entry and SHM-mediated evolution (Turner et al., 2020).
The viral spike (S) glycoprotein binds ACE2 on host cells and mediates viral fusion with the host (Li et al., 2003). Its fusogenic activity depends on a furin-mediated cleavage, resulting in N-terminal S1 and C-terminal S2 fragments (Xia et al., 2020) and on a subsequent cleavage of S2 mediated either by cathepsins or by a serine protease, TMPRSS2 (Hoffmann et al., 2020). The S glycoprotein is the principal neutralizing antibody target and the focus of most vaccines. Secreted SARS-CoV-2 S antibodies available in serum can decline with time (Chen et al., 2020; Dan et al., 2021) and lose reactivity to emerging variants (Garcia-Beltran et al., 2021; Wang et al., 2021a). Antibodies cloned from memory B cells target the S glycoprotein in both distinct and redundant ways—complementary and competitive recognition, respectively (Brouwer et al., 2020; Dejnirattisai et al., 2021; Graham et al., 2021; Hansen et al., 2020; Liu et al., 2020; Wang et al., 2021b). Many of these antibodies have been identified and characterized; their positions within the distribution of practical, complementary recognition of SARS-CoV-2 S in the human memory B cell repertoire have not. Moreover, the recognition reach of memory B cells induced by one SARS-CoV-2 strain toward evolving stains across the major epitopic regions is not yet clear.
We present here an unbiased global assessment of the distribution of memory B cell-encoded antibodies among cooperative and competitive recognition clusters on the SARS-CoV-2 S glycoprotein and examine features that direct their collaborative robustness against emerging SARS-CoV-2 variants. In a comprehensive competition analysis of 152 monoclonal antibodies (mAbs) from 19 subjects for binding with trimeric S ectodomain, we have identified seven recurrently targeted competition groups—three for antibodies with epitopes on the receptor-binding domain (RBD), two for epitopes on the N-terminal domain (NTD), and two for S2 epitopes. We show that these groups represent the major practical antibody footprints, with rare antibodies outside them. We map the clusters onto S by including previously characterized antibodies and new, cryogenic electron microscopy (cryo-EM)-determined structures. Ig repertoire analysis indicates both divergent and convergent clones with the competition groups.
Antibodies mapped to groups we named based on the S domain (i.e., RBD, NTD, and S2) followed by a number corresponding to the abundance, within our population, of mAbs that bind the designated domain. RBD-2 and NTD-1 were the most potent neutralizers, while the S2-1 group had the greatest recognition breadth across CoVs. The emerging SARS-CoV-2 variants, particularly B.1.351, escaped binding by many RBD-2 and NTD-1 antibodies. Nonetheless, because mutations in those variants had varying effects on the affinity of antibodies within a competition group, we conclude that the presence in an individual of otherwise redundant, memory B cells for a given epitopic region can confer recognition breadth for dynamically mutating S.
Results
Anti-S antibody general subunit reactivity and breadth across individuals
To identify the general pattern of SARS-CoV-2 S recognition by memory B cells in convalescent subjects, we sorted single CD19+ CD27+ IgG+ B cells recognizing soluble prefusion-stabilized S trimer (Figures 1 A, S1 A, and S1B) from 19 individuals 24 (median) days (range 13–63 days) following recovery from COVID-19 (Data S1). We also sorted S-reactive B cells that did not bind RBD from three individuals because less is known about these antibodies. S-reactive B cells made up 0.2% (0.07%–0.4%) of the total B cell population (Figure 1A, left panel), with RBD-binding cells representing about a quarter of S-reactive IgG+ B cells (Figure 1A, right panel). We cloned and expressed Ig-heavy (H) and -light (L) chains from individual, sorted memory B cells into human IgG1 and κ or λ vectors. We detected IgG in 255 of the culture supernatants, which we used to screen for binding to SARS-CoV-2 S (Figures 1B, 1C, and S1C–S1E). Of the 255 IgGs, 217 bound SARS-CoV-2 S and/or RBD, as assayed by flow cytometry (157 from the S+ sorting with an additional 1 that bound to RBD but not S, and 59 from S+/RBD− sorting) (Figure 1C); 166 of the 217 bound recombinant SARS-CoV-2 S, as assayed by ELISA (116 from S+ sorting and 50 from S+RBD− sorting).
Figure 1.

SARS-CoV-2 spike-specific mAb binding profiles
(A) Cells recovered from two sorting strategies, shown in dot plots as percentages of total CD19+ cells. Left: IgG+CD27+ cells from 18 donors and the subset of those that expressed S-binding BCRs. Right: cells from three donors expressing S-binding BCRs and sorted to recover principally those that did not bind RBD.
(B) Summary of all productive mAbs (recombinant human IgG1) screened by ELISA (with recombinant S ectodomain trimer) and cell-surface expression assays (both 293T and yeast cells). Total numbers in the center of each of pie chart; numbers and color codes for the indicated populations shown next to each chart. To the right of the charts for the two sorting strategies are bar graphs showing frequencies of SARS-CoV-2 RBD and NTD binding mAbs for those subjects from whom at least ten paired-chain BCR sequences were recovered.
(C) Binding to a panel of S proteins and SARS-CoV-2 subdomains, listed on the left, as determined by both ELISA and by association with S expressed on the surface of 293T cells or with RBD or NTD expressed on the surface of yeast cells, for S+ sorted (left) and S+RBD− sorted cells (right). Left panel, 157 clones bound to S and an additional one bound to only RBD but not S. Pink indicates ELISA screens. Blue indicates cell-based screens. Each short section of a row represents an antibody. The rows labeled VH mutation and VL mutation are heatmaps of counts (excluding CDR3) from alignment by IgBLAST, with the scale indicated.
(D) Dot plots of VH and VL mutation counts in mAbs that bound RBD, NTD, S2, and a “broad CoV group” that included MERS, HKU1, and OC43.
∗∗∗p < 0.001, ∗∗∗∗p < 0.0001; nonparametric Kruskal-Wallis multiple comparison. Horizontal lines show mean ± SEM. See also Figure S1.
Figure S1.

Sorting strategy for SARS-CoV-2-specific memory B cells and characterization of monoclonal antibodies, related to Figure 1
(A) Representative flow cytometry plots showing CD19+, CD27+, SARS-CoV-2 S-binding B cells from a convalescent subject (C12, top row) and a pre-pandemic control (bottom row). PBMCs were pre-enriched with CD19 magnetic beads then gated on live IgD−IgM-IgG+CD27+ and finally on S (B) Representative flow cytometry plots showing S-positive, RBD-negative B cells for three convalescent subjects and a pre-pandemic control, sorted as in (A) except for the S gate. (C) Representative flow plot of mAb supernatant bound to SARS-CoV-2 S on HEK293T cells. Cells were gated on DAPI−GFP+ population. (D) Representative flow plot of mAb supernatant bound to SARS-CoV-2 RBD on yeast. cMyc tag indicated yeast that expressed RBD. (E) Representative flow plot of mAb supernatant bound to SARS-CoV-2 NTD on yeast. cMyc tag indicated yeast that expressed NTD. See Figure 1C for the screening color scheme. (F) Bar graph of Log10(EC50) of antibodies targeting RBD, NTD and S2 using ELISA and cell-based assay. EC50 (μg/mL), RBD (n = 23), NTD clusters (n = 15) and S2 (n = 15). ∗∗∗p < 0.001, ∗∗∗∗p < 0.0001; Paired nonparametric Wilcoxon test. Data are mean values ± SEM (G) Dot plot of Log10(EC50) of antibodies in the indicated bins by cell-based assay. Antibodies are from subjects G32 and C41, sorted with S. Each dot represents one monoclonal antibody. EC50 (μg/mL), 13-39 days (n = 13), 40-63 days (n = 8). No significance; nonparametric Mann-Whitney test. Data are mean values ± SEM.
We estimated, by ELISA and, where possible, yeast display of the subdomains (Figures S1D and S1E), the proportion of mAbs that bound to RBD, NTD, and S2. Recombinant and yeast-displayed S2 protein could have any of several conformations, and all or parts of the polypeptide chain might be disordered; mAbs that bound S2 on ELISA plates might therefore tend to recognize linear epitopes or even the S2 post-fusion conformation. Indeed, most of the S2-binding mAbs had relatively low ELISA-determined affinities for intact, recombinant, prefusion S, although a few bound more tightly to S expression on the surface of 293T cells (Figure S1F). Of the 157 S-reactive mAbs sorted with SARS-CoV-2-stabilized S trimer, a total of 36 (23%) were RBD specific as assayed by ELISA, by yeast display, or both (Figure 1B). We detected 16 (10%) mAbs that bound the NTD and 49 (31%) that bound S2 (Figure 1C). Eleven of the 49 S2 binders bound cell-surface-expressed, but not ELISA-based, SARS-CoV-2 S.
We also assessed mAbs by ELISA for cross-reactivity to other CoV S glycoproteins. Those of SARS, MERS, and common cold β-CoVs HKU1 and OC43 have sequences with 75.8%, 28.6%, 25.1%, and 25.5% amino-acid identity, respectively, with SARS-CoV-2 S; the more distantly related common cold α-CoVs, NL63 and 229E, just 18.3% and 20.2%. Of the 157 S ectodomain-sorted mAbs, 47 (29.9%) bound to SARS-CoV S and 8 to other β-CoV S glycoproteins. These 8 cross-reactive mAbs have higher mutation levels than do RBD, NTD, and the other S2-binding mAbs from our cohort (Figures 1C and 1D). Affinities of mAbs derived from the two individuals that donated twice to this study (G32 and C41) did not differ between time points (spaced 31 and 33 days apart, respectively; the two time points were combined in the analysis) (Figure S1G). Among the 59 S-binding mAbs cloned from the S+RBD− sorted memory B cells, ELISA detected 23 (39%) mAbs that bound NTD (11 of which also bound NTD on yeast), and 14 (23.7%) that bound S2, of which 7 (11.9%) cross-reacted with SARS-CoV S. One mAb bound RBD (Figure 1C).
Unbiased global competition analysis defines seven S epitopic regions
We used a competition ELISA to determine pairwise overlaps of the 105 mAbs in our panel for which we could detect signal at 1 μg/mL. By adding a biotinylated version of each mAb together with excess of each of the other mAbs individually into ELISA plates pre-coated with pre-fusion-stabilized SARS-CoV-2 S (Wrapp et al., 2020), we could detect competition of mAbs with up to 100-fold differences in affinity. We also included 15 published mAbs with known structures as references (Figure S2 A).
Figure S2.

Competition mapping including antibodies from S+RBD− sort and antibodies with published structures, related to Figure 2
(A) Cross competition matrix by ELISA-based competition. Including antibodies from cells gated as S+RBD− increased representation of NTD and S2 clusters. Color and shading scheme, groups defined by hierarchical clustering, and recombinant protein binding as in Fig 2A. Arrows designate antibodies described in the text, including those reported here (green) and those from published work by others (blue). (B) Cross competition matrix for mAbs from S+RBD− sort by ELISA-based competition. (C) Competition in cell-based assay, for antibodies with binding in ELISA format too weak for reliable blocking measurement. See Figure 2B for procedures, heat-map color scheme, etc.
We identified seven major clusters of competing mAbs (Figure S2A). The three RBD clusters overlapped to varying extents, as expected for sites on a relatively small domain. Asymmetric competition (one mAb blocks binding of another, but the second does not block the first) occurred when one had much higher affinity than the other—e.g., S309 (Pinto et al., 2020), which binds more tightly than do most of the RBD-1 mAbs we isolated. The clusters define relatively broad epitopic regions, as the footprints of two mAbs within a cluster might not overlap with each other but both might overlap with the footprint of a third (e.g., REGN10933 and REGN10987, both of which competed with C12A2, although they have completely distinct footprints at either end of the RBD receptor-binding motif (RBM). Some crosstalk between clusters is also evident (e.g., C93D9, which bound the RBD, blocked both RBD-2 and NTD-1 mAbs). The published 4-8, 4A8, and COVA1-22 mAbs (Brouwer et al., 2020; Chi et al., 2020; Liu et al., 2020), which have been shown to bind the NTD, compete with each other and map to NTD-1. NTD-2 mAbs cluster distinctly from NTD-1, indicating minimal spatial overlap of these two NTD regions. One NTD-1 mAb (C81H11) competed strongly with mAbs from S2-1, and a second could be assigned on the basis of competition either to NTD-1 or to S2-1, suggesting structural adjacency of at least some sites in these two clusters (Figure S2A). Several segments of S2 are in contact with either RBD or NTD, some with differential exposure depending on whether the RBD is “up” or “down.”
Inclusion of common mAbs shared among studies reveals how epitopic regions determined here directly by analysis of the competition matrix relate to other classifications, particularly for RBD. For instance, RBD-2 roughly corresponds to recently described class 1 and class 2 (Barnes et al., 2020), RBS-A, B, and C mAbs (Yuan et al., 2021), and RBD-A (Rogers et al., 2020).
Thirty-six mAbs in the ELISA competition analysis cross-reacted with SARS-CoV. These mapped mostly to the RBD-1 (11 mAbs) and S2-1 (17 mAbs) clusters. Four mAbs that mapped to S2-1 (C15C3, C7A4, C7A9, and G32Q1) also bound the common cold β-CoVs, and two of these (C7A9 and C15C3) also bound MERS S. Thus, S2-1 mAbs appear to recognize a region of S2 conserved among SARS-CoV-2, SARS-CoV, MERS, HKU1, and OC43, as shown previously for S2 mAbs (Ng et al., 2020; Song et al., 2020). Isolation of a single mAb (C12B3) that bound S2 but did not map to any of the seven major clusters suggests that the immune system may target additional regions of S2 but that those responses are subdominant.
Memory B cells dominant across individuals in natural infection
We probed the relative distribution of epitopes recognized by SARS-CoV-2-specific memory B cells in the population represented by our cohort by ELISA-based and cell-surface-based assays. We clustered all the S+ mAbs (Figure 2 ) and S+RBD- mAbs from a separate sorting step (Figures S2B and S2C). In the former set, comprising 73 mAbs that bound strongly enough for the ELISA competition assay, the order of epitopic region frequencies was RBD-1 (27.4%), S2-1 (19.2%), NTD-1 (17.8%), RBD-2 (15.1%), and NTD-2 (8.2%) (Figure 2A). There were 36 more mAbs that had insufficient affinity for ELISA competition but that bound cell surface SARS-CoV-2 S (Figures 2B and S3 A). We mapped ELISA-insufficient mAbs to the seven clusters using the cell-based assay. We used 20 mAbs (2 RBD-3, 4 RBD-2, 4 RBD-1, 2 NTD-2, 4 NTD-1, 2 S2-1, and 2 S2-2) from the ELISA-mapped competition clusters as blocking mAbs, a non-COVID-19-related blocking antibody as negative control, and self-blocking as positive control (Figures 2B and S3A). We used an additional 118 mAbs (distributed across the seven clusters) to map the 13 mAbs that failed to be mapped clearly with the initial 20 (Figure S3B).
Figure 2.

Seven recurrently targeted major epitopic regions
(A) Cross competition matrix for 73 S+ mAbs with affinity sufficient for detection by ELISA. Blocking mAbs (columns) added at 100 μg/mL; detection antibodies (rows) at 1 μg/mL. Intensity of color shows strength of blocking, from 0 signal (complete blocking) to 70% full signal (top gradient at right of panel: orange). Hierarchical clustering of mAbs by cross competition into seven groups (plus a singleton labeled S2-3), enclosed in square boxes, with designations shown and in colors from dark blue (NTD-1) to dark red (S2-3). Green arrows on the left designate mAbs newly reported here. The lower parts of the panel show competition of blocking mAbs with soluble, human ACE2 (second gradient at right: dark red); log10 (IC50) (IC50 unit μg/mL) in pseudovirus (614D S) neutralization assay (third gradient at right: violet); area under the curve for ELISA binding (ELISA AUC: brown); and binding (ELISA) to recombinant domains and heterologous S (green).
(B) Competition in cell-based assay for 36 mAbs with binding in ELISA format too weak for reliable blocking measurement (rows). Blocking mAbs (columns) selected from each of the seven clusters in the ELISA assay. Strength of blocking shown as intensity of orange color, as in (A).
(C) Distribution of a mAbs from two individual subjects (expressed as percent of sequence pairs recovered from that subject) into the seven principal clusters, plus a non-assigned (unknown) category (unk) and S2-3. Top row shows mAb distribution from all subjects and the bottom row shows the distribution of all other individuals minus C12 and G32.
See also Figure S2.
Figure S3.

Cell-based competition assay and comparison with ELISA, related to Figure 2
(A) Representative flows plot for competition, by 20 blocking antibodies representing each of the seven principal clusters (from ELISA: Figure S2A), for binding cell-surface expressed S protein by 3 biotinylated antibodies. A non-COVID-19 related antibody and a self-blocking antibody were used as negative and positive controls. (B) Heatmap of 19 mAbs with hierarchical clustering from cell-based competition assay with 118 blocking antibodies. See Figure 2B for procedures, heat-map color scheme, etc. (C) Heatmap of 17 mAbs with hierarchical clustering from ELISA-based (left panel) and cell-surface (right panel) cross-competition. See Figure 2B for procedures, heat-map color scheme, etc. (D) Heatmap of polyclonal IgG with hierarchical clustering from ELISA-based competition with 12 blocking antibodies and a non-COVID-19 control antibody. Intensity of color shows binding intensity of detection polyclonal antibodies, from 0 signal (complete blocking) to 100% full signal.
Cell-based competition showed that mAbs with affinities too low to test by ELISA mapped primarily to S2 and to the NTD (Figures 2B and S2C). Analysis of ELISA-mapped mAbs that were also mapped with the cell-based competition assay showed that the two assays were consistent (Figure S3C) and suggested that cell-surface binding extended the dynamic range of the ELISA competition assay to include less tightly binding mAbs, justifying use of the combined competition results in subsequent analyses. This combined approach showed that frequencies of cluster-targeting mAbs from the two individuals that contributed the most clones (C12 and G32) were largely similar to the aggregate of all others (Figure 2C). In addition, competition analysis of purified polyclonal IgGs indicated that samples from two blood draws one month apart had similar principal targets (Figure S3D).
Spatial distribution of the major RBD and NTD epitopic regions
We included in the competition assays mAbs for which published structures show their interaction with S. By cryo-EM, we determined structures of Fab fragments of six mAbs from the RBD-1, RBD-2, and NTD-1 clusters bound with S ectodomain, to fill gaps in the representation of mAbs from those clusters in published work. Two of those reconstructions are at relatively high resolution (those of Fab C12C9 in NTD-1, and Fab G32R7 in RBD-1), three (C12A2 and C93D9 in RBD-2, and C81C10 at the periphery of NTD-1) at intermediate resolution, and one (C12C11 in NTD-1) at much lower resolution.
RBD-1
The complex with Fab G32R7 (Figure 3 ) has three RBDs in the “up” configuration, each bound with a Fab. The epitope is part of the RBD surface that faces outward in the “down” configuration of the domain, but interference of the bound Fab with the NTD of the anticlockwise neighboring subunit (as viewed from above the S) would prevent binding to a down-oriented RBD. The connection of the RBD allows a range of orientations for the up configuration, and association with the G32R7 Fab does not fix the orientation of the RBD, blurring density in a 3D reconstruction of the intact S. Local refinement of an RBD-Fab subparticle then yielded a map with well-defined features at the interface (Figure 3; Data S3 and S4). RBD contacts are all with the H-chain variable domain (VH), principally CDRH2, framework residues in the C, D, and E strands, and CDRH3. The unusually long CDRH3 (24 residues) also interacts with three glycans—one on RBD Asn343 and the others on NTD Asn122 and Asn165. Although VH approaches the NTD closely enough to interact with the glycans, we could identify just one likely additional contact with an NTD side-chain (Phe157). S309, an RBD-1 neutralizing antibody isolated from a convalescent SARS-CoV donor that also neutralizes SARS-CoV-2 (Pinto et al., 2020), has contacts with the RBD that do not overlap those of G32R7, but the L chain of the latter would collide with it.
Figure 3.

Spatial distribution of the major RBD and NTD epitopic regions
Surface regions of the SARS-CoV-2 S trimer contacted by mAbs in four of the seven principal clusters, according to the color scheme shown, with a representative Fab for all except RBD-3. The C81C10 Fab defines an epitope just outside the margin of NTD-1, but it does not compete with any antibodies in RBD-2. The RBD-2 Fv shown is that of C121 (PDB ID: 7K8X: Barnes et al., 2020), which fits most closely, of the many published RBD-2 antibodies, into our low-resolution map for C12A2. Left: views normal to and along threefold axis of the closed, all-RBD-down conformation; right: similar views of the one-RBD-up conformation. C121 (RBD-2) can bind both RBD down and RBD up; G32R7 (RBD-1) binds only the “up” conformation of the RBD. The epitopes of the several published RBD-3 antibodies are partly occluded in both closed and open conformations of the RBD; none are shown here as cartoons. A cartoon of the polypeptide chain of a single subunit (dark red) is shown within the surface contour for an S trimer (gray).
RBD-2 and RBD-3
Most potently neutralizing mAbs cluster in RBD-2; many published structures show modes of antibody binding within this group (Barnes et al., 2020; Piccoli et al., 2020). Their epitopes include various parts of the ACE2 binding site (i.e., the RBM) at one apex of the domain. For the mAbs characterized here, low-resolution structure of Fab C12A2 showed that its epitope was essentially identical to that of published antibody 2-4 (Data S5) (Liu et al., 2020). The same IGVH encodes the H chains of both mAbs, and the L-chain genes are closely related (overall amino-acid sequence identity). They contact the slight concavity in the center of the RBM, the site for most of the neutralizing mAbs represented by structures in the PDB. The probably immunosubdominant RBD-3 class includes several antibodies for which published structures are available; we included CR3022, an antibody originally isolated from a SARS-CoV convalescent subject that cross-reacts with SARS-CoV-2 (ter Meulen et al., 2006). Its epitope on the RBD is nearly opposite that of G32R7 (Figure 3), in an epitopic region partly occluded in the down configuration of the RBD previously referred to as a cryptic supersite (Piccoli et al., 2020).
NTD-1
NTD-1 cluster includes mAbs with neutralizing activity, including C12C9 and C12C11. The latter, judging from the low-resolution map (Data S5), appears to have a footprint that coincides with that of the published 4A8 antibody (PDB ID: 7C2L; Chi et al., 2020). Like the G32R7 complex, the C12C9 complex also required local subparticle refinement to yield a map interpretable at the level of side-chain contacts at the Fab-NTD interface. Its footprint overlaps that of 4A8, but it is displaced slightly toward the threefold axis of the S trimer. Both mAbs have principal contacts in two NTD surface loops, residues 140–160 and 245–260. The C81C10 mAb, which we have grouped in NTD-1 but which competes with only two of the most weakly binding members of that cluster, appears to represent a distinct and potentially subdominant subset. An 8-Å resolution structure (Data S5) bound with S trimer shows that its epitope is at the bottom of the NTD, well displaced from the epitopes of C12C9, C12C11, and 4A8.
NTD-2
We have no structures of NTD-2 mAbs bound with S, but from non-competition with NTD-1, insensitivity to NTD loop deletions (see below), and exposure of NTD surfaces on the trimer, we suggest that the NTD-2 epitopes may be on one of the lateral faces of the NTD.
Neutralizing function maps largely to RBD-2 and NTD-1 clusters
Using two different pseudovirus assays, we determined neutralization by mAbs from each of the seven clusters and found neutralizing mAbs in five of the seven clusters (RBD-1, -2, and -3, and NTD-1 and NTD-2) (Figure 4 ). The most potent were in RBD-2, as expected from their co-clustering with known strong neutralizers such as REGN10987 and REGN10933, which are used as a mAb drug cocktail (Baum et al., 2020), and from many previous reports (Brouwer et al., 2020; Ju et al., 2020; Liu et al., 2020). Among Abs from that cluster, 52%–58% neutralized with IC50<0.1 μg/mL and 29%–35% with IC80<0.1 μg/mL (Figure 4). Alternate SARS-CoV-2 S pseudotyped virus neutralization protocols showed similar results (Figure 4). The strongest of the RBD-1 mAbs had IC50 in the range of 1 μg/mL; those in RBD-3 were, in general, much weaker. There is strong correlation between pseudotyped and authentic virus (Figure S4 ). NTD-1 mAbs appeared more sensitive to the neutralization assay used, but a few, such as C12C9, approached or exceeded the strongest in RBD-1 (Figure S4A). NTD-2 mAbs were, in general, less potent than NTD-1 mAbs, and none of the S2 mAbs neutralized infection, with the possible exception of very weak neutralization by G32C5 (IC50 of 22 μg/mL) (Figure S4C).
Figure 4.

Distribution of pseudovirus neutralization potency in each competition cluster
Both IC50 (A and C) and IC80 (B and D) shown for infection in two different cell lines. (A) and (B) pair: 293FT cells expressing hACE2 and TMPRSS2. (C) and (D) pair: TZM.bl cells expressing hACE2. Color gradient indicates frequency of the clones in each cluster that have the neutralization potency shown by the vertical scale. See also Figure S4.
Figure S4.

Neutralization profiles for monoclonal antibodies of seven clusters, related to Figure 4
(A) Authentic virus (WA1) neutralization profiles of 9 antibodies. (B) Pseudovirus neutralization profiles in two cell lines for antibodies from NTD-1 cluster. Left panel: neutralization profiles in 293FT cells co-expressing hACE2 and TMPRSS2 as target cells (n = 39). Right panel: neutralization profiles in TZM.bl cells expressing hACE2 as target cells (n = 13). (C) Pseudovirus neutralization profiles in 293FT cells co-expressing hACE2 and TMPRSS2 for antibodies from RBD-1 (n = 22), RBD-2 (n = 23), RBD-3 (n = 5), NTD-2 (n = 16), S2-1 (n = 32) and S2-2 (n = 19) clusters. Data are mean values ± SD for authentic virus assays and pseudovirus assays using 293FT/hACE2/TMPRSS2 cells. Data are mean values ± SEM for assays using TZM.bl/hACE2 cells.
High diversity and some sequence convergence in competition clusters
Variable region exons of IgH and IgL genes are each assembled by V(D)J recombination from a diversity of gene segments. Preference of VH gene segment usage frequencies differed among the seven mAb clusters (Figure 5 A). Enrichment for VH3-53, previously reported to be associated with SARS-CoV-2 S (Yuan et al., 2020), was exclusively within the RBD-2 group. VH3 family mAbs are particularly abundant in all the clusters. VH3-30 and VH3-30-3, which have average frequency in the general human repertoire of 5.4% and 1.3%, respectively, account between them for over 30% of the mAbs in RBD-1, and for 16 of the 19 mAbs in S2-2. The VH1 and VH4 families are co-dominant with VH3 in NTD-1 and NTD-2, respectively (Figure 5A). VH1-69-encoded mAbs are enriched in S2-1, which contains most of the cross-reactive mAbs to other CoVs. VH1-69-encoded mAbs are frequently observed in antiviral responses to influenza virus, HCV, and HIV-1 (Chen et al., 2019), and previous work reported that SARS-CoV-2 S-specific mAbs isolated from SARS-CoV-infected patients also showed an enriched VH1-69 gene segment usage (Wec et al., 2020). VH1-69, which is well represented in H chains of “natural antibodies,” also associates strongly with polyreactivity. VH and VL somatic mutation levels were generally, but not significantly, greater in S2-1 (Figure S5 A)
Figure 5.

High diversity and some sequence convergence in competition clusters
(A) IgH VH gene segments of the 167 mAbs characterized by binding SARS-CoV-2 S in either ELISA or cell-surface expression. Inner ring indicates VH family; the outer ring indicates specific VHs. PBMC repertoire is from 350 million reads of deep sequencing (Briney et al., 2019). S binders include 167 clones in Data S2. ∗p < 0.05, ∗∗p < 0.01, ∗∗∗p < 0.001, ∗∗∗∗p < 0.0001; Bonferroni correction. Red asterisks: comparing to S binders; black asterisks: comparing to a non-selected B cell repertoire from PBMCs.
(B) Maps of pairwise distances of CDRH3 (lower left triangle) and CDRL3 (upper right triangle) for the NTD-2 and S2-1 cluster mAbs from (A). Antibodies in both clusters arranged by VH usage. Clones converging on identical VH/VL and closest distance of CDRL3 from the same cluster are shown. Pairwise distances analyzed by MEGA X. Intensity of color shows the distance from 0 (identical) to 1 (no identity). Sequence alignment for the mAbs from the indicated clusters with identical VH and VL and similar CDR3s. Differences in CDR3s from the reference sequence (bold) are in red; dashes indicate missing amino acids; dots represent identical amino acids.
(C) Summary of convergent sequences of anti-SARS-CoV-2 S and RBD antibodies from independent datasets. Ig sequences derived from binding to DIII of Zika virus E protein, and HA of influenza virus H1N1 were used as control datasets. Convergent sequences had identical VH and VL and >50% identity in CDRH3 and CDRL3.
(D) Representative convergent clones from different individuals and independent datasets from (C).
See also Figure S5.
Figure S5.

Diversity of antibody sequences and convergent C93D9 class of antibodies, related to Figure 5
(A) V(D)J and VJ mutation levels in each of the 7 principal competition groups. Mutations in VH and VL (excluding CDR3) counted by IgBLAST. (B) Maps of pairwise distances of CDRH3 (lower left triangle) and CDRL3 (upper right triangle) for the RBD-1, RBD-2, RBD-3, NTD-1 and S2-2 cluster antibodies related to Figure 5B. (C) Two views of 20 Fab structures, listed in (E), bound with SARS-CoV-2 RBD. Structures all superposed on the RBD; heavy-and light-chains of each Fab in a distinct color. The figure includes only the RBD from 6YZ5 (not one of the 20), with the RBM in light orange and the rest of the chain in gray. (D) View as in the right-hand panel in (C), but showing only the Fab from 7B3O (the closest in sequence to C93D9), with CDRs labeled. The most intimate contacts with RBM residues are from CDRH1, CDRH2 and CDRL1, many with residues constrained in potential variability by ACE2 interaction. (E) Maps of pairwise distances of CDRH3 (lower left triangle) and CDRL3 (upper right triangle) for the 21 C93D9 class antibodies in (C) and (D). Pairwise distances analyzed by MEGA X. Intensity of color shows the distance, from 0 (identical) to 1 (no identity). The VH and VL genes encoding the antibodies are shown in the indicated groups. Differences in CDR3s from the reference sequences (bold) are in red; dashes indicate missing amino acids; dots represent identical amino acids. IGHV3-66 and IGHV3-53 are very similar VH gene segments, differing by only one encoded amino-acid residue.
IgH and IgL variable regions each have three complementary determining regions (CDRs), which are the principal contact sites for antigen. CDRs 1 and 2 for H and L chain are encoded within the VH and VL gene segments, respectively. Diverse, non-templated sequences produced by VDJH junctions encode CDRH3 regions, which have dominant roles in most Ab-antigen interactions. CDRL3 is also diverse due to VJL junctional heterogeneity, but it has fewer non-templated sequence additions. Intracluster mAb CDR3 sequence comparisons showed little sequence similarity (Figure S5B). NTD-2 contained a subcluster of identical CDRL3 sequences that were associated with the same VH and VL segments from two different individuals (C81 and C12) (Figure 5B). S2-1 had a small subcluster of CDRH3 and CDRL3 sequence similarities from five different study participants (C83, C102, C163, C12, and C53) (Figure 5B). These data indicate substantial intracluster CDR3 diversity with rare instances of CDR3 sequence similarity between different individuals.
We also asked whether we could find evidence of sequence convergence with other COVID-19 datasets for which paired IgH and IgL sequence data are available. Convergent sequence criteria of (1) same VH and VL, and (2) no less than 50% CDRH3 and CDRL3 identity (Croote et al., 2018), revealed rare sequences very similar to representatives from RBD-1, RBD-2, and NTD-1 in independent datasets for SARS-CoV-2 (Kreer et al., 2020; Liu et al., 2020; Robbiani et al., 2020), but not for mAbs against Zika (Robbiani et al., 2017) or influenza (Wrammert et al., 2011) viruses (Figures 5C and 5D). We also found convergent pairs within our own dataset representing both S2-1 and S2-2 (Figure 5D).
Finally, we note that antibody C93D9 represents a striking example of structural convergence (Figures S5C and S5D). All but two of the 20 mAbs from the literature shown in Figure S5E have the same VH and a non-random selection of VL but divergent CDRH3 sequences and lengths. Nonetheless, all 20, as well as C93D9, bind the RBM in almost identical poses—consistent with germline-encoded CDRs as the principal binding contacts (Yuan et al., 2020).
Escape from RBD-2 and NTD-1 mAbs by viral variants
Emergence of SARS CoV-2 variants that enhance transmissibility, such as the variant B.1.1.7 (Rambaut et al., 2020), and in some cases reduce the neutralization titers of convalescent sera, such as the variant B.1.351 (Tegally et al., 2021), indicates more rapid evolution of the virus than expected from the error-correcting properties of CoV RNA-dependent RNA polymerases. In the case of B.1.351 in particular, the clusters of three substitutions and one deletion in the NTD and three substitutions in the RBD concentrate at contacts of the most potent of the many well-characterized neutralizing mAbs (Figure 6 A). Moreover, recurrent deletions in loops of the NTD appear to accelerate SARS CoV-2 antigenic evolution (McCarthy et al., 2021).
Figure 6.

Influence of mutations found in variants of concern on binding and neutralization by human mAbs
(A) Positions of mutations in amino acid sequences of B.1.1.7, B.1.351 and P.1. Left panel: RBD (gray backbone cartoon) and Fvs representing each of the three RBD clusters (green, yellow, and orange backbone cartoons for RBD-1, -2, and -3, respectively). Red spheres show side chains at positions of RBD mutations N501Y (found in all three variants of concern), E484K, and K417N/T (found in B.1.351 and P.1). Right panel: NTD (gray backbone cartoon) and Fvs representing the NTD-1 cluster (blue backbone cartoon) and the C81C10 non-neutralizing antibody (cyan backbone cartoon). Spheres show side chains at positions of mutations in B.1.1.7 (yellow), B.1.351 (orange), and P.1 (red). One NTD substitution, L18F (brown), is in both B.1.351 and P.1. Although Δ242-244 is a deletion within a β strand, its effect will be to reconfigure the 248–260 loop (orange asterisk), as residues 245–247 will shift into the positions of the deleted residues in the strand. See also Figure S6.
(B) Heatmap showing binding of 119 mAbs to Nextstrain cluster 20A.EU1 (A222V), Danish mink variant (Δ69-70 and Y453F), B.1.1.7 (Δ69-70, Δ144, N501Y, A570D, P681H, T716I, S982A, and D1118H), B.1.351 (L18F, D80A, D215G, Δ242-244, K417N, E484K, N501Y, and A701V), and P.1 (L18F, T20N, P26S, D138Y, R190S, K417T, E484K, N501Y, H655Y, T1027I, and D1176F) (top), and NTD deletion variants (bottom). Variants include D614G. Relative binding intensities of the tested mAbs for each variant are shown in shades of blue.
(C) Heatmap showing neutralization potency of 119 mAbs to D614G, B.1.1.7, B.1.351, and P.1. Log10 transformed IC50 shown in shades of dark red. IC50, μg/mL.
See also Figure S6.
We examined the effects of naturally occurring mutant S protein on binding of mAbs in each competition group (Figures 6B and 6C). B.1.1.7 had lower affinity for various mAbs in the RBD-1 and NTD-1 cluster. None of the RBD-1 mAbs lost binding completely, and testing a variant with just the deletion at position 144 in the NTD showed that this single mutation caused loss of binding by nearly two-thirds of the mAbs in the NTD-1 cluster. Mutations in B.1.351 S had more pronounced effects, particularly on mAbs in the RBD-2 and NTD-1 clusters, as expected from the positions of the sequence changes. In addition to the N501Y substitution also present in the variant B.1.1.7, an E484K mutation lies at the center of the epitope for many of the most potent RBD-2 neutralizing mAbs (Figure 6A). About one-third of the RBD-2 mAbs retained modest to high affinity, but the variant S failed to bind any of the NTD-1 cluster (excluding C81C10—a peripheral NTD-1 member as discussed above), with the marginal exception of 4A8. The P.1 variant escaped RBD-2 mAbs in a manner mirroring B.1.351, but with much less escape from NTD-1 mAbs (Figures 6B and S6 A). mAbs in S2-related groups were not affected by B.1.1.7, B.1.351, or P.1, despite the presence of some mutations within S2. One exception is the singleton S2-3 mAb C12B3, an S2 binder that loses binding to B.1.1.7 (Figure 6B). Loss of neutralization potency tracked with loss of binding (Figures 6B, 6C, S6B, and S6C).
Figure S6.

Representative flow plots for mAb binding and neutralization of indicated variants, related to Figure 6
Flow plots for binding of 7 mAbs to Nextstrain cluster 20A.EU1 (A222V), Danish mink variant (Δ69-70 and Y453F), B.1.1.7 (Δ69-70, Δ144, N501Y, A570D, P681H, T716I, S982A, D1118H), B.1.351 (L18F, D80A, D215G, Δ241-243, K417N, E484K, N501Y, A701V), P.1 (L18F, T20N, P26S, D138Y, R190S, K417T, E484K, N501Y, H655Y, T1027I, D1176F) and NTD deletion variants. All variants contain the D614G mutation. Plasmids with variant S co-expressed with pmaxGFP in HEK293T cells. Cells were gated on DAPi−GFP+. mAb C81E2 was used as positive control, and PBS, as negative control. (B) Authentic B.1.1.7 virus neutralization profiles for 6 antibodies. (C) Authentic B.1.351 virus neutralization profiles for 6 antibodies. Data are mean values ± SD for authentic virus assays.
Differential effects on antibodies with overlapping but still distinct epitopes illustrate the potential importance of a redundant, polyclonal response. Although C12C9, C12C11, and 4A8 all contact the 140–160 loop (Figure 3) and all are sensitive to the recurrent multi-position deletions at Δ141-144 and Δ243-244, only the latter two are sensitive to the recurrent single-position deletions at 144 or 146 (Figures 6B and S6A). Moreover, although they are in the same convergent structural class whose members bind the RBM in nearly identical poses (Figures S5C and S5D), CC12.1 (Yuan et al., 2021) nearly fails to recognize B.1.351 (∼7%) while C93D9 retains some marginal affinity (∼29%) (Figure 6B). Thus, apparently redundant memory B cell clones can have non-redundant functional roles.
Discussion
Our results illustrate the landscape of memory B cell coverage of the SARS-CoV-2 S glycoprotein in convalescent donors. Unlike the terminally differentiated plasma cells that determine the profile of serum antibodies, memory B cells clonally expand upon re-exposure to antigen, some differentiating into fresh antibody-secreting cells and others re-entering GCs to undergo further SHM-mediated diversification and affinity maturation. These outcomes offer a layer of flexibility for adaptation to drifted or related viral strains, if available secreted antibodies fail to prevent initial infection. Loss of protection against overt or severe disease is not an inevitable consequence of a waning serum antibody titer. This atlas of B cell memory therefore maps, systematically, a crucial component of the long-term immune response to SARS-CoV-2 infection.
The donors for this study experienced COVID-19 symptom onset between March 3 and April 1, 2020, and blood draws analyzed here were between April 2 and May 13, 2020, early in the pandemic. Immune responses in these SARS-CoV-2-naive donors were to early and relatively homogeneous variants circulating well before emergence of the B.1.1.7 and B.1.351 strains first reported in December 2020, and probably before the spread in New England of the D614G variant that did not substantially alter antigenicity (Muik et al., 2021; Xie et al., 2021). This set of BCR sequences and corresponding mAbs thus represents responses to a relatively homogeneous infectious virus and provides a valuable tool for examining the degree to which these antibodies retain recognition of emerging variants and for studying the extent to which loss of neutralizing titer correlates with loss of longer-term protection.
Finding that the same regions of S are targeted across multiple individuals may confer pressure for viral escape. This may be a downside of what appears to be a consistent and robust representation of germline antibodies against neutralizing SARS-CoV-2 targets in the human antibody repertoire. The fact that mAbs that lose reactivity to emerging variants tend to be members of the most potent neutralizing mAb clusters is consistent with in vivo protection by these antibody groups.
The competition clusters we have identified are roughly analogous to genetic complementation groups. Competition can result from overlapping binding footprints or non-overlapping but neighboring footprints that lead to mutual exclusion of IgGs bound at the two adjacent epitopes. Competition can also result from stabilization by one antibody of a conformation (e.g., the up-down conformational isomerism of the RBD) that excludes or lowers affinity of the other. Any of these mechanisms may contribute to the clusters we have mapped, but the outcome in all cases is an apparent redundancy of binding capacity in a broadly polyclonal response that may nonetheless impart recognition breadth toward an evolving pathogen within a single individual.
Complementary recognition of non-overlapping viral targets by non-competing antibodies in the repertoire can reduce the likelihood of viral escape (Keeffe et al., 2018). Our data suggest an additional mechanism for preventing viral escape: competing antibodies may help retain recognition of a rapidly evolving antigen by their differential sensitivity to specific mutations. The potential dynamic reach of otherwise redundant mAb recognition, illustrated by selective retention of affinity for variants by some antibodies within a cluster but not by others, may give selective advantage to immune mechanisms that yield multiple competing antibodies to critical epitopes, as those that retain adequate affinity can then re-activate, expand, and potentially undergo further affinity maturation. The presence of some antibodies that retain cross-strain neutralizing activity suggests that protection from variants may depend upon robustness of B cell responses to parent S. Escape from neutralization is a likely feature of variant emergence. It will be important to determine the degree to which antibodies with retained affinity for immunodominant neutralizing S protein targets influence protection from variant-driven clinical disease.
Limitations of study
The participants in this study suffered from mild COVID-19. While this represents the majority of cases, it will be important for future studies to examine the degree to which antigen recognition may differ in cases of more severe disease. In addition, our study only includes adults. Inclusion of children in future studies will illuminate how SARS-CoV-2 S recognition may differ in this age group.
STAR★Methods
Key resources table
| REAGENT or RESOURCE | SOURCE | IDENTIFIER |
|---|---|---|
| Antibodies | ||
| Goat anti-human IgG-alkaline phosphatase (AP) | Southern Biotech | Cat# 2040-04; RRID:AB_2795643 |
| Streptavidin-alkaline phosphatase | BD Biosciences | Cat# 554065, RRID:AB_10053566 |
| Human CD19 MicroBeads | Miltenyi Biotec | Cat# 130-050-301, RRID:AB_2848166 |
| Anti-flag-APC | BioLegend | Cat# 637307; RRID:AB_2561496 |
| Anti-flag-PE | BioLegend | Cat# 637310; RRID:AB_2563148 |
| Anti-His-PE | BioLegend | Cat# 362603, RRID:AB_2563634 |
| Anti-human-IgG-PerCP-Cy5.5 | BioLegend | Cat# 410710; RRID:AB_2565788 |
| Anti-human-CD27-APC-Cy7 | BioLegend | Cat# 356424; RRID:AB_2566773 |
| Anti-human-CD19-BV510 | BioLegend | Cat# 302242; RRID:AB_2561668 |
| Anti-human-IgD-FITC | BioLegend | Cat# 348206; RRID:AB_10612567 |
| Anti-human-IgM-BV605 | BioLegend | Cat# 314524; RRID:AB_2562374 |
| Anti-human-IgG- Alexa Fluor 647 | Thermo Fisher Scientific | Cat# A-21445, RRID:AB_2535862 |
| anti-c-Myc IgY | Thermo Fisher Scientific | Cat# A-21281, RRID:AB_2535826 |
| DyLight™ 649 Streptavidin | BioLegend | Cat#405224 |
| goat anti-chicken IgG Alexa Fluor 488 | Thermo Fisher Scientific | Cat# A-11039, RRID:AB_142924 |
| Bacterial and virus strains | ||
| E.coli TOP10 | Thermo Fisher Scientific | Cat# C404003 |
| E.coli Stbl3 | Thermo Fisher Scientific | Cat# C737303 |
| SARS-CoV-2, isolate USA-WA1/2020 | University of Texas Medical Branch | N/A |
| SARS-CoV-2, Isolate hCoV-19/USA/CA_CDC_5574/2020 | BEI Resources | NR-54011 |
| SARS-CoV-2, Isolate hCoV-19/South Africa/KRISP-K005325/2020 | BEI Resources | NR-54009 |
| Biological samples | ||
| COVID-19 convalescent PBMC | This paper | N/A |
| Pre-COVID19 PBMC (collected before 10/01/2019) | This paper | N/A |
| Chemicals, peptides, and recombinant proteins | ||
| SARS-CoV-2 S (sorting) | GeneScript | Cat# Z03481 |
| SARS-CoV-2 S (ELISA) | Obtained from the lab of Dr. Bing Chen | N/A |
| SARS-CoV-2 RBD | Obtained from the lab of Dr. Aaron Schmidt | N/A |
| SARS-CoV-2 S2 | Sino Biological | Cat# 40590-V08B |
| SARS-CoV-2 NTD | Sino Biological | Cat# 40591-V49H |
| SARS-CoV RBD | Obtained from the lab of Dr. Aaron Schmidt | N/A |
| MERS RBD | Obtained from the lab of Dr. Aaron Schmidt | N/A |
| HKU1 RBD | Obtained from the lab of Dr. Aaron Schmidt | N/A |
| SARS-CoV S | Sino Biological | Cat# 40634-V08B |
| MERS S | Sino Biological | Cat# 40069-V08B |
| HKU1 S | Sino Biological | Cat# 40606-V08B |
| OC43 S | Sino Biological | Cat# 40607-V08B |
| NL63 S | Sino Biological | Cat# 40604-V08B |
| 229E S | Sino Biological | Cat# 40605-V08B |
| Human ACE2 | Obtained from the lab of Dr. Bing Chen | N/A |
| Bovine serum albumin (BSA) | Sigma | Cat# A2153 |
| Triton X-100 | Fisher Scientific | Cat# 9002-93-1 |
| 10x phosphate buffered saline (PBS) | Boston BioProducts | Cat# BM-220-10XS |
| Glycine | Sigma-Aldrich | Cat# G7126 |
| Zinc chloride | Sigma-Aldrich | Cat# 793523 |
| Magnesium chloride | Sigma-Aldrich | Cat# M0250 |
| Tween-20 | Sigma-Aldrich | Cat# P1379 |
| Ficoll-Paque PLUS | Cytiva | Cat# 17144003 |
| 4’,6-diamidino-2-phenylindole, dihydrochloride (DAPI) | Thermo Fisher Scientific | Cat# D1306 |
| Dithiothreitol (DTT) | Thermo Fisher Scientific | Cat# R0861 |
| RNaseOUT | Thermo Fisher Scientific | Cat# 10777-019 |
| Random hexamer primer | Thermo Fisher Scientific | Cat# FERSO142 |
| 10 mM dNTPs | Promega | Cat# U1515 |
| IGEPAL CA-630 | Sigma-Aldrich | Cat# I8896 |
| SuperScript III reverse transcriptase | Thermo Fisher Scientific | Cat# 18080085 |
| HotStarTaq DNA polymerase | QIAGEN | Cat# 203205 |
| Protein A agarose beads | Thermo Fisher Scientific | Cat# 20334 |
| Papain resin | Thermo Fisher Scientific | Cat# 20341 |
| Talon cobalt resin | Takara bio | Cat# 635503 |
| Strep-Tactin Sepharose resin | IBA Life Sciences | Cat# 2-1201-010 |
| 4-20 % Tris-Glycine SDS-PAGE | Thermo Fisher Scientific | Cat# XP04200BOX |
| 1M Tris-HCl (pH8.0) | Boston BioProducts | Cat# BBT-80-500 |
| Gentian Violet | RICCA Chemicals | Cat# 3233-4 |
| Deposited data | ||
| Primary data | This paper | Mendeley Data: https://doi.org/10.17632/tfvsfg47c7.1 |
| Heavy and light chain sequences | This paper | GenBank: MW718328-MW718631 |
| Atomic structure | This paper | PDB: 7N62 and 7N64 |
| Cryo-EM structure | This paper | EMDB: EMD-24192 to EMD-24194 and EMD-24196 to EMD-24198 |
| Critical commercial assays | ||
| Fab preparation kit | Thermo Fisher Scientific | Cat# 44985 |
| Lipofectamine 3000 transfection reagent | Thermo Fisher Scientific | Cat# L3000008 |
| ExpiFectamine Kit | Thermo Fisher Scientific | Cat# A14525 |
| ONE-Glo luciferase assay system | Promega | Cat# E6120 |
| EZ-Link™ Sulfo-NHS-LC-Biotin | Thermo Fisher Scientific | CAT# 21338 |
| Experimental models: Cell lines | ||
| HEK293T | ATCC | Cat# CRL-3216 |
| VERO C1008 (E6) | BEI Resources | Cat# NR-596 |
| EBY100 S. cerevisiae Strain | Thermo Fisher Scientific | Cat# C83900 |
| ACE2/TMPRSS2-expressing HEK293T | Obtained from the lab of Dr. Marc Johnson | N/A |
| Expi293F | Thermo Fisher Scientific | Cat# A14527 |
| ACE2-expressing TZM.bl | Obtained from the lab of Dr. Michael S. Seaman | N/A |
| Oligonucleotides | ||
| Primer set for Ig PCR (Tiller et al., 2008) | IDT DNA | N/A |
| Recombinant DNA | ||
| pCHA vector | Obtained from the lab of Dr. K. Dane Wittrup | N/A |
| pmaxGFP | Lonza | Cat#: VDC-1040 |
| Plasmid encoding 2p | Obtained from the lab of Dr. Jason McLellan | N/A |
| Plasmid encoding hexapro | Obtained from the lab of Dr. Jason McLellan | N/A |
| HDM-SARS2-spike-delta21-D614G | Addgene | Cat# 158762 |
| HDM-SARS2-spike-Δ69-70-delta21-D614G | Obtained from the lab of Dr. W. Paul Duprex | N/A |
| HDM-SARS2-spike-Δ141-144-delta21-D614G | Obtained from the lab of Dr. W. Paul Duprex | N/A |
| HDM-SARS2-spike-Δ144-delta21-D614G | Obtained from the lab of Dr. W. Paul Duprex | N/A |
| HDM-SARS2-spike-Δ146-delta21-D614G | Obtained from the lab of Dr. W. Paul Duprex | N/A |
| HDM-SARS2-spike-Δ210-delta21-D614G | Obtained from the lab of Dr. W. Paul Duprex | N/A |
| HDM-SARS2-spike-Δ243-244-delta21-D614G | Obtained from the lab of Dr. W. Paul Duprex | N/A |
| HDM-SARS2-spike-A222V-delta21-D614G | This paper | N/A |
| HDM-SARS2-spike-Δ 69-70 Y453F-delta21-D614G | This paper | N/A |
| HDM-SARS2-spike-B.1.1.7-delta21-D614G (Pseudovirus) | This paper | N/A |
| HDM-SARS2-spike-B.1.351-delta21-D614G (Pseudovirus) | This paper | N/A |
| HDM-SARS2-spike-P.1-delta21-D614G (Pseudovirus) | This paper | N/A |
| Plasmid encoding B.1.1.7 (Flow cytometry) | Obtained from the lab of Dr. Bing Chen | N/A |
| Plasmid encoding B.1.351 (Flow cytometry) | Obtained from the lab of Dr. Bing Chen | N/A |
| Plasmid encoding P.1 (Flow cytometry) | Obtained from the lab of Dr. Bing Chen | N/A |
| HDM-SARS2-Spike-delta21 | Addgene | Cat#155130 |
| pLenti CMV Puro LUC (w168-1) | Addgene | Cat#17477 |
| psPAX2 | Addgene | Cat#12260 |
| Software and algorithms | ||
| GraphPad Prism 8 and 9 | GraphPad Software | https://www.graphpad.com/scientific-software/prism/ |
| IgBLAST | NCBI | https://www.ncbi.nlm.nih.gov/igblast/ |
| Clustal Omega | EMBL-EBI | https://www.ebi.ac.uk/Tools/msa/clustalo/ |
| R | Free Software Foundation/GNU | R v4.0.0 |
| Bioconductor software in R | Bioconductor | https://www.bioconductor.org/ |
| MEGAX | Molecular Evolutionary Genetics Analysis | https://www.megasoftware.net/ |
| FlowJo 9.9.6 and 10.7.1 | BD | https://www.flowjo.com/ |
| UCSF Chimera | UCSF | https://www.cgl.ucsf.edu/chimera/ |
Resource availability
Lead contact
Further information and requests for resources and reagents should be directed to and will be fulfilled by the Lead Contact, Duane R. Wesemann. dwesemann@bwh.harvard.edu
Materials availability
Reagents and materials presented in this study are available upon request, in some cases after completion of a material transfer agreement.
Experimental model and subject details
Human study participants
The study and protocol were approved by Partners Institutional Review Board. Volunteers aged 18 and older with a history of COVID-19 were enrolled between March and May 2020. COVID-19 was diagnosed by a healthcare professional based on symptoms and a positive nasopharyngeal swab RT-PCR test except for G32, who was diagnosed by an antibody test. Participants self-reported data for body-mass index (BMI), symptom onset and recovery dates and self-rated the severity of their COVID-19 symptoms on a 1-10 scale, with 1 describing very mild symptoms and 10 describing very severe symptoms. Blood samples were collected at least 2 weeks after symptom resolution. Symptom duration is the time between symptom onset and recovery dates. Detailed information about the cohort is in Data S1. BMI was calculated as participant’s weight in kilograms divided by the square of their height in meters. Blood samples were processed within 4 h of sample collection. PBMCs and plasma samples were isolated by density gradient centrifugation with Ficoll-Paque PLUS (GE Healthcare) and stored at −80°C until use.
Method details
SARS-CoV-2 S-specific single B cell sorting
B cells, enriched from PBMCs with human CD19 MicroBeads (Miltenyi), were incubated with 2 μg/ ml flag-tagged S protein or mixture of flag-tagged S protein (Genscript, Cat. Z03481) and His-tagged RBD (Chen et al., 2020) on ice for 30 min. Cells were then washed with 2% fetal bovine serum (FBS) (Hyclone) in PBS and stained with mixture of anti-human IgG (Percpcy5.5; Biolegend Cat. 410710), anti-human IgD (FITC; Biolegend Cat. 348205), anti-human IgM (Bv605; Biolegend Cat. 314524), anti-CD27 (APCcy7; Biolegend Cat. 356404). A mixture of PE- and APC-conjugated anti-flag antibodies (Biolegend Cat. 637309 and 637307) was also added for gating S-specific double positive cells, or a mixture of PE-conjugated anti-His (Biolegend Cat. 362603) and APC-conjugated anti-flag, for S positive and RBD negative cells. Memory B cells were gated on DAPI-CD19+IgM-IgD-IgG+CD27+. Individual S double positive or S+RBD- cells were sorted with a FACSAria Fusion (BD Biosciences) into each well of 96-well microplates containing 4 μl/well of lysis buffer (0.5X PBS, 10 mM dithiothreitol, and 4U RNaseOUT). Lysed cells were immediately frozen and stored at −80°C until use.
Antibody cloning and production
Cloning and expression of mAbs from single, SARS-CoV-2 S-specific B cells were performed as described previously (Chen et al., 2020). In brief, mRNA from lysed B cells was reverse transcribed with SuperScript III (ThermoFisher) and random hexamers. Two rounds of PCR were performed to amplify heavy and light chain transcripts. Amplified products from the second round PCR were detected by agarose gel and further verified by Sanger sequencing. Sequences were analyzed with IgBlast (https://www.ncbi.nlm.nih.gov/igblast/), and sequence confirmed PCR products were then amplified with gene specific primers containing restriction enzyme sites for cloning into human IgG1, κ and λ expression vectors (gifts from Michel C. Nussenzweig, Rockefeller University). For small scale antibody production, paired heavy and light chains were co-transfected into HEK293T cells (ATCC, Cat. CRL-3216) in 6-well plates with Lipofectamine 3000 (ThermoFisher, Cat. L3000015) following manufacturer’s instructions. Cells were cultured in DMEM supplemented with 10% FBS and incubated at 37°C with 5% CO2. The medium was replaced with fresh medium at 12 h post-transfection and the supernatant harvested after 48 h. Cell debris were removed by centrifugation at 2000 g for 10 min and the cleared supernatant stored at 4°C for further use.
For large scale antibody production, paired heavy chain and light chain were co-transfected in Expi293F cells (ThermoFisher, Cat. A14527) with ExpiFectamine (ThermoFisher, Cat. A14525) in 250 mL Erlenmeyer flasks following manufacturer’s instructions. Cells were cultured in Expi293 expression medium at 37°C and 8% CO2 with shaking at 125 RPM. On day 7, cells were removed by centrifuging at 2000 RPM for 10 min. Clear supernatants were incubated overnight at 4°C with protein A agarose beads (ThermoFisher, Cat. 20334), followed by washing with PBS, elution with 0.1 M Glycine (pH 2.7) and neutralization with 1 M Tris-HCl (pH 8.0). Purified antibodies were dialyzed against PBS for further use.
Monoclonal antibody screening with ELISA
SARS-CoV-2 S protein and the RBD proteins of other coronaviruses were prepared as described (Chen et al., 2020). SARS-CoV-2 S2 and NTD proteins were purchased from Sino biological (PA, USA). ELISA was carried out as described (Chen et al., 2020). Briefly, MaxiSorp 96-well ELISA plates (ThermoFisher) were coated with 50 ng/well of the antigen in PBS at 4°C overnight. Plates were blocked with 150 μL of 4% BSA in PBS for at least 2 h. Supernatant of antibody-expressing cells was diluted 10-fold for the first well and 4-fold serial diluted for subsequent wells, applied to the plates, and incubated at 4°C overnight. Plates were washed 4 times with PBS supplemented with 0.05% Tween-20 (PBST). Anti-human IgG-alkaline phosphatase (Southern Biotech, Birmingham, AL) at a final concentration of 1 μg/mL in 1% BSA and 0.05% Tween-20 was added at 50 μl/well and incubated for 1 h at room temperature. Plates were washed three times with PBST. Developing solution (0.1 M lycine, pH 10.4, with 1 mM MgCl2 and 1 mM ZnCl2, containing alkaline phosphatase substrate p-nitrophenyl phosphate (Sigma-Aldrich) at final concentration of 1.6 mg/mL) was then added to the plates at 100 μl/well, and incubated for 2 h at room temperature. Absorbance was measured at 405 nm by microplate reader (Biotek Synergy H1).
For median effective concentration (EC50) and area under curve (AUC) analysis of antibody binding by ELISA, 5-fold serial dilutions were produced from an initial concentration of 10 μg/mL of purified antibody in the ELISA procedure described above. EC50 and AUC were calculated with GraphPad Prism 9.
Cell surface binding assays
Antibodies were tested for binding to surface-expressed SARS-CoV-2 spike, RBD, and NTD on HEK293 T cells (spike) and on yeast (RBD, NTD). For yeast expression assays, RBD (aa 319-529) and NTD (aa 17-286) were cloned into a pCHA vector (gift of K. Dane Wittrup, Koch Institute for Integrative Cancer Research, MIT, Cambridge, MA). Plasmids were chemically transformed into yeast cell line EBY100 to display RBD or NTD as previously described (Chen et al., 2020). Briefly, single clones were cultured in SDCAA selection medium for 48 h at 30°C and 250 RPM. Cells were pelleted and resuspended in SGCAA medium to an absorbance of 0.5-1 at 600 nm, cultured at 20°C with shaking at 250 RPM for another 48 h to induce expression. RBD and NTD were detected by anti-c-Myc IgY antibody (ThermoFisher, Cat. A21281). Yeast expressing RBD or NTD were incubated with antibody supernatant and anti-c-Myc IgY on ice for 30 min and then washed with PBS with 2% FBS twice. Cells were then stained with goat anti-chicken IgG (Alexa Fluor 488, ThermoFisher, A11039) and goat anti-human IgG (Alexa Fluro 647, ThermoFisher, A21445) on ice for 15 min, followed by washing twice with PBS supplemented with 2% FBS (FACS buffer). Cells were resuspended in FACS buffer and detected by flow cytometry (BD Canto II). Data were analyzed by FlowJo 10.7.1. For analysis of antibody binding to SARS-CoV-2 S on HEK293T cells, a plasmid containing Wuhan-Hu-1 S (HDM-SARS2-spike-delta21, Addgene, Cat. 155130) was co-transfected with pmaxGFP (Lonza) in HEK293T cells using Lipofectamine 3000. Fresh medium was added at 24 h, and cells were harvested at 48 h post-transfection in PBS with 2 mM EDTA. Cells were stained with antibody supernatant on ice for 1 h, washed twice with FACS buffer, and stained with goat anti-human IgG (Alexa Fluro 647 ThermoFisher, A21445) and DAPi (to distinguish dead and live cells). After washing twice with FACS buffer, cells were resuspended in FACS buffer and detected by flow cytometry (BD Canto II). S+ cells were identified by gating on DAPi-GFP+. Data were analyzed in FlowJo 10.7.1. For median effective concentration (EC50) of antibody binding to SARS-CoV-2 S in the cell-based assay, eight three-fold serial dilutions of purified antibody were produced starting from 10 μg/mL, followed by flow cytometric binding analysis as above. EC50 was calculated with GraphPad Prism 9.
ELISA-based antibody competition
The competition assay was performed as described (Liu et al., 2020). Briefly, detection antibodies were biotinylated with EZ-Link Sulfo-NHS-LC-Biotin (ThermoFisher) according to manufacturer’s protocol. 50 ng/well of SARS-CoV-2 S protein were coated on ELISA plates at 4°C overnight. Plates were blocked with 150 μL of 4% BSA in PBS for 2 h. 30 μL of 2 μg/mL biotinylated antibody were mixed with 30 μL of 200 μg/mL blocking antibody and added to ELISA plates. For purified polyclonal IgG competition, biotinylated polyclonal IgGs at saturated concentration were used to compete with 100 μg/mL blocking antibody. For antibody competition with hACE2 (aa18-615), 100 ng/well hACE2 were coated on ELISA plates at 4°C overnight. Plates were blocked with 4% BSA, and a mixture of 30 μL of 2 μg/mL Twin-Strep-tag HexaPro S (Hsieh et al., 2020) and 30 μL of 200 μg/mL blocking antibody was then added. Plates were incubated for 2 h at 37°C and washed 4 times with PBST. 50 μl/well of streptavidin-alkaline phosphatase (BD Biosciences, Cat. 554065) was added to the wells using a dilution of 1:1000 dilution of the stock solution according to the manufacturer’s instructions, and incubated for 1 h at room temperature. Plates were washed 5 times with PBST and developed at room temperature for 2 h. Absorbance was measured at 405 nm by microplate reader (Biotek Synergy H1). The detection signal was calculated by (OD value of mixture antibodies-OD value of PBS)/ (OD value of biotinylated antibody alone-OD value of PBS) x100%. Negative values were treated as 100% competition.
Cell-based antibody competition
S (HDM-SARS2-spike-delta21, Addgene, Cat. 155130) and GFP (pmaxGFP) were co-expressed in HEK293T cells. 30 μL of 2 μg/mL biotinylated antibody were mixed with 30 μL of 200 μg/mL blocking antibody and added to cells. After 1 h incubation on ice, followed by washing twice with FACS buffer, cells were stained with 50 μL of 1:1000 diluted DyLight 649 Streptavidin (BioLegend, Cat. 405224) and DAPi. After washing twice with FACS buffer, cells were resuspended in FACS buffer and detected by flow cytometry (BD Canto II). S+ cells were gated on DAPi-GFP+. Data were analyzed by FlowJo 10.7.1. The detection signal was calculated by (MFI of mixture antibodies-MFI of PBS)/ (MFI of biotinylated antibody alone-MFI of PBS) x100%. Negative values were treated as 100% competition.
Antibody binding to S variants
Variants included: Wuhan-Hu-1-D614G S (HDM-SARS2-spike-delta21-D614G, Addgene, Cat. 158762), recurring NTD deletions as described (McCarthy et al., 2021) (Δ69-70, Δ141-144, Δ144, Δ146, Δ210, Δ243-244), Nextstrain cluster 20A.EU1 (A222V), Danish mink variant (Δ 69-70 and Y453F), UK B.1.1.7 (Δ69-70, Δ144, N501Y, A570D, P681H, T716I, S982A, D1118H), SA B.1.351 (L18F, D80A, D215G, Δ242-244, K417N, E484K, N501Y, A701V) and P.1 (L18F, T20N, P26S, D138Y, R190S, K417T, E484K, N501Y, H655Y, T1027I, D1176F). We note that plasmids with Δ144 and Δ145 have the same coding sequence due to the presence of tyrosine at both sites. All variants contain D614G. For binding, 10 μg/mL of antibody were incubated with cells, with goat anti-human IgG as secondary antibody for detection by flow cytometry (BD Canto II). S+ cells were gated on DAPi-GFP+. Data were analyzed by FlowJo 10.7.1. Binding for each mAb was first normalized (“normalized IgG MFI”) by dividing the MFI for that mAb by the MFI for GFP. The normalized MFI for binding the D614G spike was used as a reference (normalized D614G spike IgG MFI). The relative binding intensities of the tested mAbs for each variant, calculated as the ratio of the normalized variant IgG MFI and the normalized D614G spike IgG MFI. Relative binding signal > 1 was treated as no loss of binding and set to 1.
Pseudovirus production and neutralization assay
Pseudovirus particles were produced as described (Chen et al., 2020). HEK293T cells were co-transfected with spike envelope plasmid (HDM-SARS2-spike-delta21, Addgene, Cat. 155130) or plasmids encoding variant spike (HDM-SARS2-spike-delta21-D614G, HDM-SARS2-spike-B.1.1.7-delta21-D614G, HDM-SARS2-spike-B.1.351-delta21-D614G, HDM-SARS2-spike-P.1-delta21-D614G) package plasmid (psPAX2, Addgene, Cat. 12260) and backbone plasmid (pLenti CMV Puro LUC, Addgene, Cat. 17477) with Lipofectamine 3000. Medium was replaced with fresh medium at 24 h, and supernatants were harvested at 48 h post-transfection and clarified by centrifugation at 300 g for 10 min before aliquoting and storing at −80°C. SARS-Cov-2 pseudovirus neutralization assay was performed as described (Johnson et al., 2020), with target cell line 293FT expressing human ACE2 and serine protease TMPRSS2 (provided by Marc C. Johnson, University of Missouri) or TZM.bl expressing human ACE2. Cells at 1.8 × 10⁴ cell/well were seeded in 96-well plates 16 h in advance. Serial diluted mAb was mixed with pseudovirus and incubated for 1 h at 37°C before adding to cells. Cells infected without mAb were scored as 100% infection; cells cultured without pseudovirus or mAb as blank controls. After 48 h incubation at 37°C with 5% CO2, cells were processed with luminescent regent (ONE-Glo™, Promega) according to manufacturer’s instructions, and luminescence (RLU) was measured with a microplate reader (Biotek Synergy H1). Inhibition was calculated by 100-(RLU of mAb-RLU of blank)/ (RLU of pseudovirus -RLU of blank) x100%. Values for half inhibition (IC50) and 80% inhibition (IC80) were calculated with GraphPad Prism 9.
Authentic virus propagation and neutralization assay
SARS-CoV-2 propagation: All work with infectious SARS-CoV-2 was performed under Biosafety Level-4 conditions at the National Emerging Infectious Diseases Laboratories (NEIDL). Passage 4 SARS-CoV-2 USA-WA1/2020 was received from the University of Texas Medical Branch. SARS-CoV-2, isolate USA/CA_CDC_5574/2020 (from the B1.1.7 lineage) was isolated from a nasopharyngeal swab on December 29, 2020 in San Diego County, California, USA. Passage 3 master stock material was received at NEIDL from BEI Resources (Cat. NR-54011, Lot: 70041598). SARS-CoV-2, isolate hCoV-19/South Africa/KRISP-K005325/2020 (also referred to as 501Y.V2.HV and 501Y.V2.HV001) was isolated from an oropharyngeal swab from a 40-year-old human male in Ugu district, KwaZulu-Natal, South Africa on November 16, 2020. Passage 4 master stock material was received at NEIDL from BEI Resources (Cat. NR-54009, Lot: 70041942). Viruses were amplified in T225 flasks of VeroE6 cells infected at an approximate MOI of 0.001 plaque forming units (PFU)/cell in DMEM + 2% HI-FBS. Infected cells were observed daily for progression of cytopathic effect (CPE). Stock supernatant was harvested and clarified by centrifugation at 5,250 RCF at 4°C for 10 min and heat inactivated FBS concentration (GIBCO) was increased to a final concentration of 10% prior to cryopreservation at −80°C. Stocks were characterized to include negative sterility testing using trypic soy broth and thioglycolate medium with dextrose (negative for growth out to 14 days) and analysis for mycoplasma species from DNA using the MycoSEQ detection system (ThermoFisher), which is able to detect > 90 mycoplasma species if present (none identified). Endotoxin levels were determined using the Lonza QCL-1000 endpoint chromogenic LAL assay and were 0.164 EU/mL for NSU-V014 and 0.156 EU/mL for NSU-V015.
Cell Culture: NR-596 VeroE6 cells (BEI Resources) were maintained in Dulbecco’s modified Eagle medium (DMEM) (GIBCO) with 10% heat inactivated FBS (GIBCO), GlutaMAX (GIBCO), non-essential amino acids (GIBCO) and sodium pyruvate (GIBCO). One day prior to the assay, VeroE6 cells were seeded at a density of 8.0 × 10⁵ cells per well of a 6-well plate (Falcon Polystyrene Microplates, Cat. 353934) in 2 mL media.
Viral neutralization reduction assays: An Avicel plaque reduction assay was used to quantify plaques. Antibody samples were serially diluted in Dulbecco’s Phosphate Buffered Saline (DPBS)(GIBCO) using two-fold dilutions. Dilutions were prepared in triplicate per antibody and plated in triplicate. Each dilution was incubated at 37°C and 5% CO2 for 1 h with 1000 PFU/mL of SARS-CoV-2. Controls included DPBS as a negative control and 1000 PFU/mL SARS-CoV-2 incubated with DPBS. The maintenance medium was removed from each plate and 200 μL of each inoculum dilution was added to confluent monolayers of NR-596 Vero E6 cells (including a positive and mock negative control) in triplicate and incubated for 1 h at 37°C/5% CO2 with gentle rocking every 10-15 min to prevent monolayer drying. The overlay was prepared by mixing by inversion Avicel 591 overlay (DuPont Nutrition & Biosciences, Wilmington, DE) and 2X Modified Eagle Medium (Temin’s modification, GIBCO) supplemented with 2X antibiotic-antimycotic (GIBCO), 2X GlutaMAX (GIBCO) and 10% FBS (GIBCO) in a 1:1 ratio. After 1 h, 2 mL of overlay was added to each well and the plates was incubated for 48 h at 37°C/5% CO2. 6-well plates were then fixed using 10% neutral buffered formalin prior to removal from BSL-4 space. The fixed plates were then stained with 0.2% aqueous Gentian Violet (RICCA Chemicals, Arlington, TX) in 10% neutral buffered formalin for 30 min, followed by rinsing and plaque counting. The half maximal inhibitory concentrations (IC50) were calculated using GraphPad Prism 8.
Fab preparation
Fab fragments were expressed with a His-tag heavy chain expression vector and co-transfected with a light chain vector in Expi293F cells. Fab fragments were also produced by papain digestion with a Fab preparation kit (ThermoFisher, Cat. 44985) according to manufacturer’s protocol. In brief, 0.5-1.0 mg of IgG1 antibodies were mixed with 125 μL papain resin (ThermoFisher, Cat. 20341) for 5 h in the digestion buffer provided, containing 20 mM cysteine, pH 7.4. Undigested antibody and Fc fragments were removed by incubating digested products with a protein A column overnight at 4°C, then collecting the Fab-containing flow-through. Fabs were analyzed by 4%–20% Tris-Glycine SDS-PAGE (ThermoFisher, Cat. XP04200BOX). C12C9 and C12A2 Fabs were prepared by expressing Fabs with a 3C-cleavable histag that was removed using 3C protease (Pierce) following Talon resin purification, as described (Schmidt et al., 2015).
Statistical analysis
Competition clusters were processed in two steps. The mAbs were first grouped based on binding to SARS-CoV-2 subdomains (RBD, NTD, S2). These mAbs, together with ungrouped mAbs, were then clustered based on competition in ELISA or in the cell-based assay, taking reduction of signal by 30% as the competition threshold.
In order to determine the presence of epitope dependent, VH-segment preferential usage, we used resampling to bootstrap p values. For each cluster with size n, we resampled n VH segments from the observed VH segments in our dataset m times with replacement. P values were generated by counting the number of resampled clusters for which the frequency of a VH-segment matched or exceeded the frequency observed in the 167 S binders in Data S2, dividing the quantity of these instances by the number of trials m, and performing a Bonferroni correction (e.g., multiplying the p value by the number of unique VH-segments) (Nielsen et al., 2020). For these data, the 7 clusters range from 5 to 39 members, and 1 million resampled clusters were generated for each cluster. We also used the same methods to compare the VH-segment composition of each cluster to the VH-segment composition of the general human PBMC repertoire, exchanging the weights of the unique VH-segments with their representation in the averaged general repertoire from 10 healthy controls (Briney et al., 2019).
Public clones were screened from previously reported clones with a total of 616 SARS-CoV-2 related clones (Chi et al., 2020; Kreer et al., 2020; Liu et al., 2020; Robbiani et al., 2020). We also screened 133 Zika (Robbiani et al., 2017) and 98 Flu (H1N1) (Wrammert et al., 2011) related clones. Public clones converged on identical VH and VL alleles, with at least 50% identity in CDRL3 and 50% identity in CDRH3.
Other analysis
Phylogenetic analysis of CoV spikes was done comparing pairwise identity using Clustal Omega. GenBank accession numbers used are the following: SARS (MN985325.1), MERS (JX869059.2), HKU1 (Q0ZME7.1), OC43 (AAT84362.1), NL63 (AAS58177.1), and 229E (AAK32191.1). MEGA X was used for pairwise distance analysis of CDRH3 and CDRL3s. For CDR3s that exceeded the MEGA X range, we manually set them to the maximum value of 3.
Protein Expression and purification for cryo-EM
Plasmids encoding stabilized variants 2P (Wrapp et al., 2020) and hexapro (Hsieh et al., 2020) of SARS-CoV2 S protein were gifts from Jason McLellan (University of Texas, Austin). Spike proteins for electron microscopy were expressed in Expi293F cells grown in Expi293 medium after transfection with spike-encoded plasmid DNA using the Expifectamine 293 transfection kit (ThermoFisher, Waltham, MA). Cells were grown for 6 days before subjecting conditioned media to affinity chromatography following centrifugation and 0.2 μm filtration. The 2P variant of spike was applied first to a Talon cobalt resin (Takara Bio) and eluted with 200 mM imidazole followed by purification over a S200 size exclusion chromatography column (Cytiva). Alternatively, the hexapro variant of spike was applied to a Streptactin resin (IBA Life Sciences), eluted with 2.5 mM desthiobiotin, and used without further purification.
Cryo-EM grid preparation
Grids were glow discharged (PELCO easiGlow) for 30 s at 15 mA and prepared with a Gatan Cryoplunge 3 by applying 3.5 μL of sample and blotting for 4.0 s in the chamber maintained at a humidity between 86% and 90%. Protein complexes were formed with spike and a 3-fold excess of Fab one h before freezing and applied with without further purification.
Preliminary studies on 2P S protein complexes with C12C11 were performed with 1.2 mg/mL total protein and C-flat 1.2-1.3 400 Cu mesh grids (Protochips). Structures of C12A2 and C12C9 bound with 2P S protein were determined using Quantifoil 1.2-1.3 400 mesh Cu grids and 0.5 mg/mL total protein, the former with 0.1% w/v octyl β-D-glucopyranoside to reduce orientation bias. Structures of C93D9, G32R7, and C81C10 with hexapro S protein were prepared with thick C-flat 1.2-1.3 400 Cu mesh grids and 1.2 mg/mL total protein.
Cryo-EM image recording
Images for C12C11 complexes were recorded on a Talos Arctica microscope operated at 200 keV with a Gatan K3 direct electron detector. Images for C12A2, C12C9, and G32R7 complexes were recorded on a Titan Krios microscope operated at 300 keV with a Gatan BioQuantum GIF/K3 direct electron detector. Images for C93D9 and C81C10 were recorded on an FEI Technai F20 microscope operated at 200 keV with a Gatan K2 Summit direct electron detector. Automated recording was with Serial EM (Mastronarde, 2005) in all cases. Specifications and statistics for images from each of these complexes are in Table S1.
Cryo-EM image analysis and 3D reconstruction
Image analysis for all structures was carried out in RELION (Scheres, 2012). Beam-induced motion correction of micrograph movies was performed with UCSF MotionCor2 (Zheng et al., 2017) followed by contrast transfer function estimation with CTFFIND-4.1 (Rohou and Grigorieff, 2015), both as implemented in RELION. Particles were picked from motion corrected micrographs using crYOLO (Wagner et al., 2019). A general model was used to pick particles from datasets collected on the Talos Arctica and Titan Krios; a specific model was trained to pick particles from F20 micrographs.
Extracted particles were downsampled and subjected to 2D classification, two rounds for the Titan Krios datasets. Initial models were prepared, and the best of three was used as a reference for 3D classification with C3 symmetry imposed. For the Talos Actica and F20 datasets, all particles from reasonable classes were combined and subjected to 3D autorefinement and sharpening, yielding final reconstructions at 8-11Å resolution. The Titan Krios datasets for C12C9 and G32R7 required additional rounds of 3D classification and 3D autorefinement to converge to final C3-symmetric, full particle reconstructions of 3.0 and 3.6 Å nominal resolutions for C12C9 and G32R7, respectively, but with much lower resolution for the Fab-bound domains. We therefore carried out local refinement as follows. Particle stacks from the final C3-symmetric, full particle maps were symmetry expanded and back projected to create a new C3-expanded reconstruction. Models of the most similar heavy and light chains were extracted from the protein data bank and combined to create initial models for the Fabs of C12C9 (heavy: 5ggu, light: 6ghg) and G32R7 (heavy: 4qf1, light: 7byr). Fab models and the NTD (residues 14-290 of 7c2l) were docked into the reconstructed maps; the RBD from 7bz5 was also docked into the G32R7 map. These docked PDB models were used to prepare initial masks with a sphere radius of 8 Å using NCSMASK and a soft edge of 5 pixels, added with relion_mask_create. The soft mask was then used to make a background-subtracted, subparticle stack as implemented in RELION. Fab-occupied and well-resolved subparticles were identified with 3D classification without alignment. Further rounds of 3D classification with and without alignment were carried out along with 3D autorefinement to obtain final sharpened maps with resolutions of ∼4.0 Å for both C12C9 and G32R7 Fabs. Detailed descriptions of the particle processing are in Data S3 and statistics, including model refinement, are in Table S1. Fourier shell correlations are in Data S4 and S5.
Acknowledgments
We thank the study volunteers. We thank Grigoriy Losyev for cell sorting, Tianshu Xiao for ACE2 protein, and Ning (Alexa) Guan, Maia Mesyngier, and Yizhou Joseph He for feedback. This study was supported by NIH grants T32 AI007245 (to J.F.), T32 GM007753 (to B.M.H.), AI146779 (to A.G.S.), AI007512 (to A.Z.), T32 AI007306 (to Y. Chen), and AI121394, AI139538, and AI137940 (to D.R.W.). W.P.D. and K.R.M. were supported by the University of Pittsburgh, the Center for Vaccine Research, and W.P.D. was supported by the Richard King Mellon Foundation, the Henry L. Hillman Foundation, and the Commonwealth of Pennsylvania, Department of Community and Economic Development. Work in the laboratories of A.G.S., B.C., S.C.H., and D.R.W. was funded by the Massachusetts Consortium on Pathogenesis Readiness. D.R.W. acknowledges support from Fast Grant funding for COVID-19 science, the Ragon Institute, and the Mark and Lisa Schwartz and the Schwartz Family Foundation, and acknowledges the interest of Enid Schwartz. Support for the Harvard Cryo-EM Center for Structural Biology came from the Nancy Lurie Marks Family Foundation. The following reagents were obtained through BEI Resources, NIAID, NIH: VERO C1008 (E6), Kidney (African green monkey), Working Cell Bank, NR-596, SARS-CoV-2, Isolate hCoV-19/USA/CA_CDC_5574/2020, NR-54011 (deposited by Centers for Disease Control and Prevention), and SARS-CoV-2, Isolate hCoV-19/South Africa/KRISP-K005325/2020, NR-54009 (contributed by Alex Sigal and Tulio de Oliveira). The SARS-CoV-2 S model in the graphical abstract is from PBD (ID:6XR8).
Author contributions
D.R.W. designed the study. P.T. and A. Gautam conducted ELISA and FACS experiments. I.W.W., S.J., and G.B. conducted cryo-EM experiments. P.T., M.T., A. Gautam, Y. Chen, A.Z., T.Z., and J.L. performed single-cell sorting and antibody cloning. P.T. and J.F. prepared yeast expression constructs. P.T., K.R.M., W.P.D., L.J.R., and Y. Cai prepared S variant expression constructs. P.T., A. Gautam, I.W.W., G.B., N.G., N.B.W., D.N., S.C.H., and D.R.W. analyzed data. S.H., M.T., F.J.N.L., and A. Gautam recruited patients and processed samples. P.T., C.L.L., M.T., and M.S.S. performed pseudovirus neutralization assays and analysis. L.G.A.M., A.N.H., L.E.M., N.S., and A. Griffiths performed authentic virus neutralization assays and analysis. M.T., I.W.W., E.A.M., G.B., J.F., B.M.H., A.G.S., Y. Cai, and B.C. contributed recombinant protein. N.G., N.B.W., and P.T. prepared the first draft. S.C.H. and D.R.W. supervised research and wrote the paper.
Declaration of interests
The authors declare no competing interests.
Published: July 23, 2021
Footnotes
Supplemental information can be found online at https://doi.org/10.1016/j.cell.2021.07.025.
Supplemental information
See STAR Methods for description of procedures.
(A) Maps and models. Because the resolution was too low for de novo modeling, we docked the following structures (identified by PDB IDs) into the reconstructed maps, based on VH and VL similarity: 6B0S and 7KJ5 (for Fab and S, respectively, in C12C11 reconstruction; a single S subunit is shown, and the NTD was adjusted manually after 7KJ5 fitting with Chimera “fit-in-map”); 7B3O (for Fab and RBD, docked together, with 6VXX for the rest of S, in C93D9 reconstruction); 4QF1 and 6VXX (for Fab and S in C81C10 reconstruction; a single S subunit is shown, and the NTD was adjusted manually after 6VXX fitting with Chimera “fit-in-map”); 6XE7 (for Fab and S protomer docked together in C12A2 reconstruction). (B) Fourier shell correlation plots for the corresponding maps. The nominal resolutions (0.143 criterion) are 12 Å, 7.1 Å, 8 Å, and 3.8 Å for C12C11, C93D9, C81C10, and C12A2 respectively.
Electron microscopy imaging statistics and model refinement for S complexes with Fabs C12C9 and G32R7.
Data and code availability
The atomic models have been deposited in the RCSB Protein Data Bank (PDB) under the accession numbers 7N62 (for C12C9) and 7N64 (for G32R7), and the electron microscopy maps have been deposited in the Electron Microscopy Data Bank (EMDB) under the accession numbers EMD-24192 to EMD-24194 (for C12C9, G32R7, C12C11) and EMD-24196 to EMD-24198 (for C93D9, C81C10 and C12A2). Sequences of the monoclonal antibodies characterized are deposited in GenBank, accession numbers: MW718328 - MW718631.
References
- Akkaya M., Kwak K., Pierce S.K. B cell memory: building two walls of protection against pathogens. Nat. Rev. Immunol. 2020;20:229–238. doi: 10.1038/s41577-019-0244-2. [DOI] [PMC free article] [PubMed] [Google Scholar]
- Barnes C.O., Jette C.A., Abernathy M.E., Dam K.A., Esswein S.R., Gristick H.B., Malyutin A.G., Sharaf N.G., Huey-Tubman K.E., Lee Y.E., et al. SARS-CoV-2 neutralizing antibody structures inform therapeutic strategies. Nature. 2020;588:682–687. doi: 10.1038/s41586-020-2852-1. [DOI] [PMC free article] [PubMed] [Google Scholar]
- Baum A., Ajithdoss D., Copin R., Zhou A., Lanza K., Negron N., Ni M., Wei Y., Mohammadi K., Musser B., et al. REGN-COV2 antibodies prevent and treat SARS-CoV-2 infection in rhesus macaques and hamsters. Science. 2020;370:1110–1115. doi: 10.1126/science.abe2402. [DOI] [PMC free article] [PubMed] [Google Scholar]
- Briney B., Inderbitzin A., Joyce C., Burton D.R. Commonality despite exceptional diversity in the baseline human antibody repertoire. Nature. 2019;566:393–397. doi: 10.1038/s41586-019-0879-y. [DOI] [PMC free article] [PubMed] [Google Scholar]
- Brouwer P.J.M., Caniels T.G., van der Straten K., Snitselaar J.L., Aldon Y., Bangaru S., Torres J.L., Okba N.M.A., Claireaux M., Kerster G., et al. Potent neutralizing antibodies from COVID-19 patients define multiple targets of vulnerability. Science. 2020;369:643–650. doi: 10.1126/science.abc5902. [DOI] [PMC free article] [PubMed] [Google Scholar]
- Chen F., Tzarum N., Wilson I.A., Law M. VH1-69 antiviral broadly neutralizing antibodies: genetics, structures, and relevance to rational vaccine design. Curr. Opin. Virol. 2019;34:149–159. doi: 10.1016/j.coviro.2019.02.004. [DOI] [PMC free article] [PubMed] [Google Scholar]
- Chen Y., Zuiani A., Fischinger S., Mullur J., Atyeo C., Travers M., Lelis F.J.N., Pullen K.M., Martin H., Tong P., et al. Quick COVID-19 Healers Sustain Anti-SARS-CoV-2 Antibody Production. Cell. 2020;183:1496–1507.e16. doi: 10.1016/j.cell.2020.10.051. [DOI] [PMC free article] [PubMed] [Google Scholar]
- Chi X., Yan R., Zhang J., Zhang G., Zhang Y., Hao M., Zhang Z., Fan P., Dong Y., Yang Y., et al. A neutralizing human antibody binds to the N-terminal domain of the Spike protein of SARS-CoV-2. Science. 2020;369:650–655. doi: 10.1126/science.abc6952. [DOI] [PMC free article] [PubMed] [Google Scholar]
- Croote D., Darmanis S., Nadeau K.C., Quake S.R. High-affinity allergen-specific human antibodies cloned from single IgE B cell transcriptomes. Science. 2018;362:1306–1309. doi: 10.1126/science.aau2599. [DOI] [PubMed] [Google Scholar]
- Dan J.M., Mateus J., Kato Y., Hastie K.M., Yu E.D., Faliti C.E., Grifoni A., Ramirez S.I., Haupt S., Frazier A., et al. Immunological memory to SARS-CoV-2 assessed for up to 8 months after infection. Science. 2021;371:eabf4063. doi: 10.1126/science.abf4063. [DOI] [PMC free article] [PubMed] [Google Scholar]
- Dejnirattisai W., Zhou D., Ginn H.M., Duyvesteyn H.M.E., Supasa P., Case J.B., Zhao Y., Walter T.S., Mentzer A.J., Liu C., et al. The antigenic anatomy of SARS-CoV-2 receptor binding domain. Cell. 2021;184:2183–2200.e22. doi: 10.1016/j.cell.2021.02.032. [DOI] [PMC free article] [PubMed] [Google Scholar]
- Garcia-Beltran W.F., Lam E.C., St Denis K., Nitido A.D., Garcia Z.H., Hauser B.M., Feldman J., Pavlovic M.N., Gregory D.J., Poznansky M.C., et al. Multiple SARS-CoV-2 variants escape neutralization by vaccine-induced humoral immunity. Cell. 2021;184:2372–2383.e9. doi: 10.1016/j.cell.2021.03.013. [DOI] [PMC free article] [PubMed] [Google Scholar]
- Graham C., Seow J., Huettner I., Khan H., Kouphou N., Acors S., Winstone H., Pickering S., Pedro Galao R., Jose Lista M., et al. Impact of the B.1.1.7 variant on neutralizing monoclonal antibodies recognizing diverse epitopes on SARS-CoV-2 Spike. bioRxiv. 2021 doi: 10.1101/2021.02.03.429355. [DOI] [PMC free article] [PubMed] [Google Scholar]
- Hansen J., Baum A., Pascal K.E., Russo V., Giordano S., Wloga E., Fulton B.O., Yan Y., Koon K., Patel K., et al. Studies in humanized mice and convalescent humans yield a SARS-CoV-2 antibody cocktail. Science. 2020;369:1010–1014. doi: 10.1126/science.abd0827. [DOI] [PMC free article] [PubMed] [Google Scholar]
- Hoffmann M., Kleine-Weber H., Schroeder S., Krüger N., Herrler T., Erichsen S., Schiergens T.S., Herrler G., Wu N.-H., Nitsche A., et al. SARS-CoV-2 Cell Entry Depends on ACE2 and TMPRSS2 and Is Blocked by a Clinically Proven Protease Inhibitor. Cell. 2020;181:271–280.e8. doi: 10.1016/j.cell.2020.02.052. [DOI] [PMC free article] [PubMed] [Google Scholar]
- Hsieh C.L., Goldsmith J.A., Schaub J.M., DiVenere A.M., Kuo H.C., Javanmardi K., Le K.C., Wrapp D., Lee A.G., Liu Y., et al. Structure-based design of prefusion-stabilized SARS-CoV-2 spikes. Science. 2020;369:1501–1505. doi: 10.1126/science.abd0826. [DOI] [PMC free article] [PubMed] [Google Scholar]
- Johnson M.C., Lyddon T.D., Suarez R., Salcedo B., LePique M., Graham M., Ricana C., Robinson C., Ritter D.G. Optimized Pseudotyping Conditions for the SARS-COV-2 Spike Glycoprotein. J. Virol. 2020;94 doi: 10.1128/JVI.01062-20. e01062–20. [DOI] [PMC free article] [PubMed] [Google Scholar]
- Ju B., Zhang Q., Ge J., Wang R., Sun J., Ge X., Yu J., Shan S., Zhou B., Song S., et al. Human neutralizing antibodies elicited by SARS-CoV-2 infection. Nature. 2020;584:115–119. doi: 10.1038/s41586-020-2380-z. [DOI] [PubMed] [Google Scholar]
- Keeffe J.R., Van Rompay K.K.A., Olsen P.C., Wang Q., Gazumyan A., Azzopardi S.A., Schaefer-Babajew D., Lee Y.E., Stuart J.B., Singapuri A., et al. A Combination of Two Human Monoclonal Antibodies Prevents Zika Virus Escape Mutations in Non-human Primates. Cell Rep. 2018;25:1385–1394.e7. doi: 10.1016/j.celrep.2018.10.031. [DOI] [PMC free article] [PubMed] [Google Scholar]
- Kreer C., Zehner M., Weber T., Ercanoglu M.S., Gieselmann L., Rohde C., Halwe S., Korenkov M., Schommers P., Vanshylla K., et al. Longitudinal Isolation of Potent Near-Germline SARS-CoV-2-Neutralizing Antibodies from COVID-19 Patients. Cell. 2020;182:843–854.e12. doi: 10.1016/j.cell.2020.06.044. [DOI] [PMC free article] [PubMed] [Google Scholar]
- Li W., Moore M.J., Vasilieva N., Sui J., Wong S.K., Berne M.A., Somasundaran M., Sullivan J.L., Luzuriaga K., Greenough T.C., et al. Angiotensin-converting enzyme 2 is a functional receptor for the SARS coronavirus. Nature. 2003;426:450–454. doi: 10.1038/nature02145. [DOI] [PMC free article] [PubMed] [Google Scholar]
- Liu L., Wang P., Nair M.S., Yu J., Rapp M., Wang Q., Luo Y., Chan J.F., Sahi V., Figueroa A., et al. Potent Neutralizing Monoclonal Antibodies Directed to Multiple Epitopes on the SARS-CoV-2 Spike. bioRxiv. 2020 doi: 10.1101/2020.06.17.153486. [DOI] [PubMed] [Google Scholar]
- Mastronarde D.N. Automated electron microscope tomography using robust prediction of specimen movements. J. Struct. Biol. 2005;152:36–51. doi: 10.1016/j.jsb.2005.07.007. [DOI] [PubMed] [Google Scholar]
- McCarthy K.R., Rennick L.J., Nambulli S., Robinson-McCarthy L.R., Bain W.G., Haidar G., Duprex W.P. Recurrent deletions in the SARS-CoV-2 spike glycoprotein drive antibody escape. Science. 2021;371:1139–1142. doi: 10.1126/science.abf6950. [DOI] [PMC free article] [PubMed] [Google Scholar]
- Muik A., Wallisch A.K., Sänger B., Swanson K.A., Mühl J., Chen W., Cai H., Maurus D., Sarkar R., Türeci Ö., et al. Neutralization of SARS-CoV-2 lineage B.1.1.7 pseudovirus by BNT162b2 vaccine-elicited human sera. Science. 2021;371:1152–1153. doi: 10.1126/science.abg6105. [DOI] [PMC free article] [PubMed] [Google Scholar]
- Ng K.W., Faulkner N., Cornish G.H., Rosa A., Harvey R., Hussain S., Ulferts R., Earl C., Wrobel A.G., Benton D.J., et al. Preexisting and de novo humoral immunity to SARS-CoV-2 in humans. Science. 2020;370:1339–1343. doi: 10.1126/science.abe1107. [DOI] [PMC free article] [PubMed] [Google Scholar]
- Nielsen S.C.A., Yang F., Jackson K.J.L., Hoh R.A., Röltgen K., Jean G.H., Stevens B.A., Lee J.-Y., Rustagi A., Rogers A.J., et al. Human B Cell Clonal Expansion and Convergent Antibody Responses to SARS-CoV-2. Cell Host Microbe. 2020;28:516–525.e5. doi: 10.1016/j.chom.2020.09.002. [DOI] [PMC free article] [PubMed] [Google Scholar]
- Piccoli L., Park Y.J., Tortorici M.A., Czudnochowski N., Walls A.C., Beltramello M., Silacci-Fregni C., Pinto D., Rosen L.E., Bowen J.E., et al. Mapping Neutralizing and Immunodominant Sites on the SARS-CoV-2 Spike Receptor-Binding Domain by Structure-Guided High-Resolution Serology. Cell. 2020;183:1024–1042.e21. doi: 10.1016/j.cell.2020.09.037. [DOI] [PMC free article] [PubMed] [Google Scholar]
- Pinto D., Park Y.J., Beltramello M., Walls A.C., Tortorici M.A., Bianchi S., Jaconi S., Culap K., Zatta F., De Marco A., et al. Cross-neutralization of SARS-CoV-2 by a human monoclonal SARS-CoV antibody. Nature. 2020;583:290–295. doi: 10.1038/s41586-020-2349-y. [DOI] [PubMed] [Google Scholar]
- Rambaut A., Loman N., Pybus O., Barclay W., Barrett J., Carabelli A., Connor T., Peacock T., Robertson D.L., Volz E. 2020. Preliminary genomic characterisation of an emergent SARS-CoV-2 lineage in the UK defined by a novel set of spike mutations.https://virological.org/t/preliminary-genomic-characterisation-of-an-emergent-sars-cov-2-lineage-in-the-uk-defined-by-a-novel-set-of-spike-mutations/563 [Google Scholar]
- Robbiani D.F., Bozzacco L., Keeffe J.R., Khouri R., Olsen P.C., Gazumyan A., Schaefer-Babajew D., Avila-Rios S., Nogueira L., Patel R., et al. Recurrent Potent Human Neutralizing Antibodies to Zika Virus in Brazil and Mexico. Cell. 2017;169:597–609.e11. doi: 10.1016/j.cell.2017.04.024. [DOI] [PMC free article] [PubMed] [Google Scholar]
- Robbiani D.F., Gaebler C., Muecksch F., Lorenzi J.C.C., Wang Z., Cho A., Agudelo M., Barnes C.O., Gazumyan A., Finkin S., et al. Convergent antibody responses to SARS-CoV-2 in convalescent individuals. Nature. 2020;584:437–442. doi: 10.1038/s41586-020-2456-9. [DOI] [PMC free article] [PubMed] [Google Scholar]
- Rogers T.F., Zhao F., Huang D., Beutler N., Burns A., He W.T., Limbo O., Smith C., Song G., Woehl J., et al. Isolation of potent SARS-CoV-2 neutralizing antibodies and protection from disease in a small animal model. Science. 2020;369:956–963. doi: 10.1126/science.abc7520. [DOI] [PMC free article] [PubMed] [Google Scholar]
- Rohou A., Grigorieff N. CTFFIND4: Fast and accurate defocus estimation from electron micrographs. J. Struct. Biol. 2015;192:216–221. doi: 10.1016/j.jsb.2015.08.008. [DOI] [PMC free article] [PubMed] [Google Scholar]
- Schäfer A., Muecksch F., Lorenzi J.C.C., Leist S.R., Cipolla M., Bournazos S., Schmidt F., Maison R.M., Gazumyan A., Martinez D.R., et al. Antibody potency, effector function, and combinations in protection and therapy for SARS-CoV-2 infection in vivo. J. Exp. Med. 2021;218:e20201993. doi: 10.1084/jem.20201993. [DOI] [PMC free article] [PubMed] [Google Scholar]
- Scheres S.H.W. RELION: implementation of a Bayesian approach to cryo-EM structure determination. J. Struct. Biol. 2012;180:519–530. doi: 10.1016/j.jsb.2012.09.006. [DOI] [PMC free article] [PubMed] [Google Scholar]
- Schmidt A.G., Therkelsen M.D., Stewart S., Kepler T.B., Liao H.X., Moody M.A., Haynes B.F., Harrison S.C. Viral receptor-binding site antibodies with diverse germline origins. Cell. 2015;161:1026–1034. doi: 10.1016/j.cell.2015.04.028. [DOI] [PMC free article] [PubMed] [Google Scholar]
- Song G., He W.T., Callaghan S., Anzanello F., Huang D., Ricketts J., Torres J.L., Beutler N., Peng L., Vargas S., et al. Cross-reactive serum and memory B cell responses to spike protein in SARS-CoV-2 and endemic coronavirus infection. bioRxiv. 2020 doi: 10.1101/2020.09.22.308965. [DOI] [PMC free article] [PubMed] [Google Scholar]
- Tegally H., Wilkinson E., Lessells R.J., Giandhari J., Pillay S., Msomi N., Mlisana K., Bhiman J.N., von Gottberg A., Walaza S., et al. Sixteen novel lineages of SARS-CoV-2 in South Africa. Nat. Med. 2021;27:440–446. doi: 10.1038/s41591-021-01255-3. [DOI] [PubMed] [Google Scholar]
- ter Meulen J., van den Brink E.N., Poon L.L.M., Marissen W.E., Leung C.S.W., Cox F., Cheung C.Y., Bakker A.Q., Bogaards J.A., van Deventer E., et al. Human monoclonal antibody combination against SARS coronavirus: synergy and coverage of escape mutants. PLoS Med. 2006;3:e237. doi: 10.1371/journal.pmed.0030237. [DOI] [PMC free article] [PubMed] [Google Scholar]
- Tiller T., Meffre E., Yurasov S., Tsuiji M., Nussenzweig M.C., Wardemann H. Efficient generation of monoclonal antibodies from single human B cells by single cell RT-PCR and expression vector cloning. J Immunol Methods. 2008;329:112–124. doi: 10.1016/j.jim.2007.09.017. [DOI] [PMC free article] [PubMed] [Google Scholar]
- Turner J.S., Zhou J.Q., Han J., Schmitz A.J., Rizk A.A., Alsoussi W.B., Lei T., Amor M., McIntire K.M., Meade P., et al. Human germinal centres engage memory and naive B cells after influenza vaccination. Nature. 2020;586:127–132. doi: 10.1038/s41586-020-2711-0. [DOI] [PMC free article] [PubMed] [Google Scholar]
- Victora G.D., Nussenzweig M.C. Germinal centers. Annu. Rev. Immunol. 2012;30:429–457. doi: 10.1146/annurev-immunol-020711-075032. [DOI] [PubMed] [Google Scholar]
- Wagner T., Merino F., Stabrin M., Moriya T., Antoni C., Apelbaum A., Hagel P., Sitsel O., Raisch T., Prumbaum D., et al. SPHIRE-crYOLO is a fast and accurate fully automated particle picker for cryo-EM. Communications Biology. 2019;2:218. doi: 10.1038/s42003-019-0437-z. [DOI] [PMC free article] [PubMed] [Google Scholar]
- Wang P., Nair M.S., Liu L., Iketani S., Luo Y., Guo Y., Wang M., Yu J., Zhang B., Kwong P.D., et al. Increased Resistance of SARS-CoV-2 Variants B.1.351 and B.1.1.7 to Antibody Neutralization. bioRxiv. 2021 doi: 10.1101/2021.01.25.428137. [DOI] [PubMed] [Google Scholar]
- Wang Z., Schmidt F., Weisblum Y., Muecksch F., Barnes C.O., Finkin S., Schaefer-Babajew D., Cipolla M., Gaebler C., Lieberman J.A., et al. mRNA vaccine-elicited antibodies to SARS-CoV-2 and circulating variants. Nature. 2021;592:616–622. doi: 10.1038/s41586-021-03324-6. [DOI] [PMC free article] [PubMed] [Google Scholar]
- Wec A.Z., Wrapp D., Herbert A.S., Maurer D.P., Haslwanter D., Sakharkar M., Jangra R.K., Dieterle M.E., Lilov A., Huang D., et al. Broad neutralization of SARS-related viruses by human monoclonal antibodies. Science. 2020;369:731–736. doi: 10.1126/science.abc7424. [DOI] [PMC free article] [PubMed] [Google Scholar]
- Wrammert J., Koutsonanos D., Li G.M., Edupuganti S., Sui J., Morrissey M., McCausland M., Skountzou I., Hornig M., Lipkin W.I., et al. Broadly cross-reactive antibodies dominate the human B cell response against 2009 pandemic H1N1 influenza virus infection. J. Exp. Med. 2011;208:181–193. doi: 10.1084/jem.20101352. [DOI] [PMC free article] [PubMed] [Google Scholar]
- Wrapp D., Wang N., Corbett K.S., Goldsmith J.A., Hsieh C.L., Abiona O., Graham B.S., McLellan J.S. Cryo-EM structure of the 2019-nCoV spike in the prefusion conformation. Science. 2020;367:1260–1263. doi: 10.1126/science.abb2507. [DOI] [PMC free article] [PubMed] [Google Scholar]
- Xia S., Lan Q., Su S., Wang X., Xu W., Liu Z., Zhu Y., Wang Q., Lu L., Jiang S. The role of furin cleavage site in SARS-CoV-2 spike protein-mediated membrane fusion in the presence or absence of trypsin. Signal Transduct. Target. Ther. 2020;5:92. doi: 10.1038/s41392-020-0184-0. [DOI] [PMC free article] [PubMed] [Google Scholar]
- Xie X., Liu Y., Liu J., Zhang X., Zou J., Fontes-Garfias C.R., Xia H., Swanson K.A., Cutler M., Cooper D., et al. Neutralization of SARS-CoV-2 spike 69/70 deletion, E484K and N501Y variants by BNT162b2 vaccine-elicited sera. Nat. Med. 2021;27:620–621. doi: 10.1038/s41591-021-01270-4. [DOI] [PubMed] [Google Scholar]
- Yuan M., Liu H., Wu N.C., Lee C.D., Zhu X., Zhao F., Huang D., Yu W., Hua Y., Tien H., et al. Structural basis of a shared antibody response to SARS-CoV-2. Science. 2020;369:1119–1123. doi: 10.1126/science.abd2321. [DOI] [PMC free article] [PubMed] [Google Scholar]
- Yuan M., Liu H., Wu N.C., Wilson I.A. Recognition of the SARS-CoV-2 receptor binding domain by neutralizing antibodies. Biochem. Biophys. Res. Commun. 2021;538:192–203. doi: 10.1016/j.bbrc.2020.10.012. [DOI] [PMC free article] [PubMed] [Google Scholar]
- Zheng S.Q., Palovcak E., Armache J.-P., Verba K.A., Cheng Y., Agard D.A. MotionCor2: anisotropic correction of beam-induced motion for improved cryo-electron microscopy. Nat. Methods. 2017;14:331–332. doi: 10.1038/nmeth.4193. [DOI] [PMC free article] [PubMed] [Google Scholar]
Associated Data
This section collects any data citations, data availability statements, or supplementary materials included in this article.
Supplementary Materials
See STAR Methods for description of procedures.
(A) Maps and models. Because the resolution was too low for de novo modeling, we docked the following structures (identified by PDB IDs) into the reconstructed maps, based on VH and VL similarity: 6B0S and 7KJ5 (for Fab and S, respectively, in C12C11 reconstruction; a single S subunit is shown, and the NTD was adjusted manually after 7KJ5 fitting with Chimera “fit-in-map”); 7B3O (for Fab and RBD, docked together, with 6VXX for the rest of S, in C93D9 reconstruction); 4QF1 and 6VXX (for Fab and S in C81C10 reconstruction; a single S subunit is shown, and the NTD was adjusted manually after 6VXX fitting with Chimera “fit-in-map”); 6XE7 (for Fab and S protomer docked together in C12A2 reconstruction). (B) Fourier shell correlation plots for the corresponding maps. The nominal resolutions (0.143 criterion) are 12 Å, 7.1 Å, 8 Å, and 3.8 Å for C12C11, C93D9, C81C10, and C12A2 respectively.
Electron microscopy imaging statistics and model refinement for S complexes with Fabs C12C9 and G32R7.
Data Availability Statement
The atomic models have been deposited in the RCSB Protein Data Bank (PDB) under the accession numbers 7N62 (for C12C9) and 7N64 (for G32R7), and the electron microscopy maps have been deposited in the Electron Microscopy Data Bank (EMDB) under the accession numbers EMD-24192 to EMD-24194 (for C12C9, G32R7, C12C11) and EMD-24196 to EMD-24198 (for C93D9, C81C10 and C12A2). Sequences of the monoclonal antibodies characterized are deposited in GenBank, accession numbers: MW718328 - MW718631.