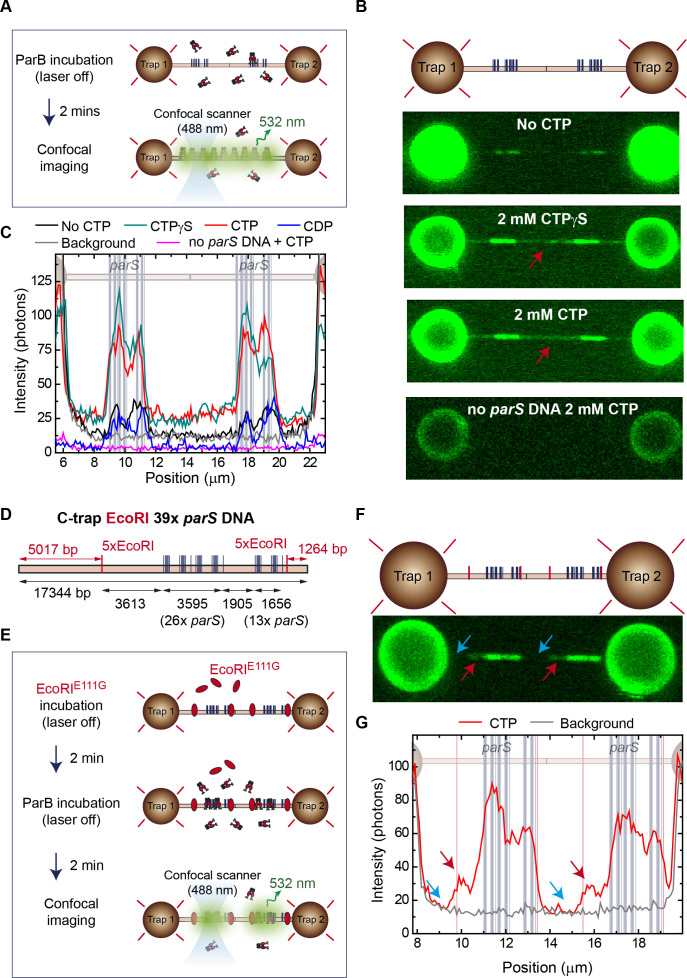
Figure 2. Cytidine triphosphate (CTP) binding promotes ParB spreading from parS.
(A) Cartoon of the experiment. First, a tandem 39× parS DNA molecule is incubated with 20 nM ParB2 and 2 mM CTP-Mg2+. Then, following a 2 min incubation, the confocal laser is turned on and confocal images are taken. (B) Representative confocal images taken after 2 min ParB incubation in the dark using tandem 39× parS DNA under no CTP, CTP, or CTPγS conditions, as well as parS-free DNA (lambda DNA) and 2 mM CTP-Mg2+. ParB appears in non-parS regions only when using parS DNA and under CTP or CTPγS conditions (red arrows). Dark to bright regions correspond to a scale of 0–50 photon counts for parS DNA tethers and 0–25 counts for lambda DNA. (C) Corresponding average profiles (500 nm width) of the fluorescence intensity taken along the DNA axis of the confocal images, including the cytidine diphosphate (CDP) case (scan not shown). Positions of the parS sequences are included to scale in the background. (D) Schematic representation of the single-length EcoRI 39× parS DNA used for C-trap roadblock experiments. The DNA contains 39 parS sequences arranged as in Figure 1C, but also includes two groups of 5× EcoRI sites flanking the parS region. Note that one of the 5× EcoRI groups is located 3613 bp away from the last parS sequence, potentially allowing spreading from the parS region. The positions of the parS sites in the DNA cartoon are represented to scale. (E) Cartoon of the roadblock experiment designed to limit ParB spreading using the EcoRIE111G mutant as a roadblock. The experiment is identical to that described in A, but first includes a 2 min pre-incubation with 100 nM EcoRIE111G, which is capable of DNA binding to EcoRI sites but unable to cleave the DNA, thus acting as a roadblock. (F) Confocal image showing limited spreading due to EcoRIE111G blocking in tandem EcoRI 39× parS DNA. Brighter regions correspond to parS binding and the two dimmed regions correspond to limited spreading up to the EcoRI sites (red arrows). Regions inaccessible to ParB spreading are indicated with blue arrows. (G) Corresponding average profile (500 nm width) of the fluorescence intensity taken along the DNA axis of the confocal image. Positions of the parS sequences and EcoRI sites are included to scale in the background. Red arrows indicate the limited spreading of ParB up to EcoRI sites. Blue arrows indicate inaccessible regions to ParB.


