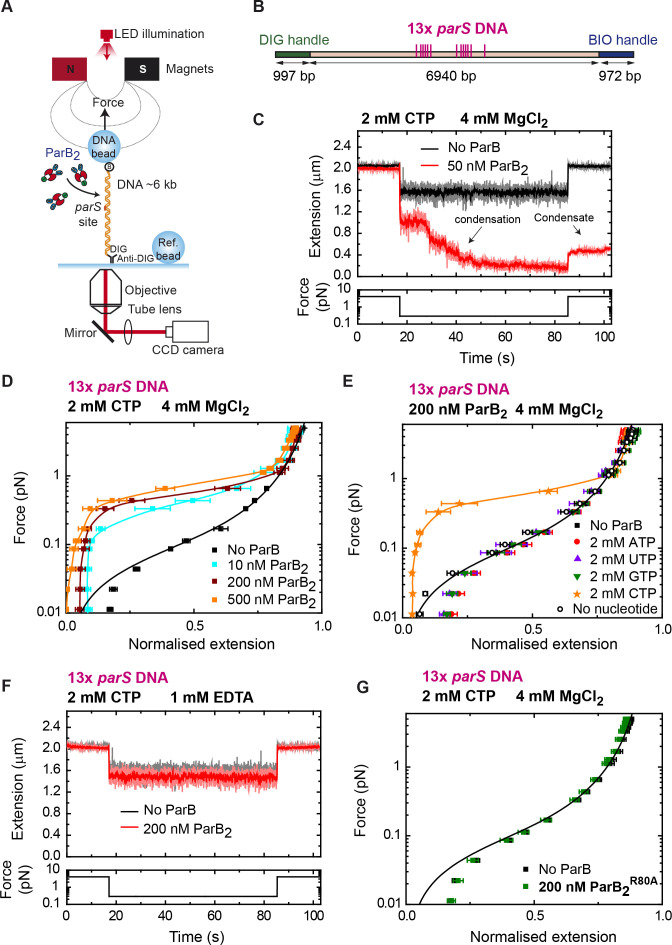
Figure 4. DNA condensation is induced by ParB at nanomolar concentrations in the presence of cytidine triphosphate (CTP).
(A) Cartoon of the basic magnetic tweezers (MT) components and the layout of the experiment. (B) Schematic representation of the 13× parS DNA used for MT experiments. The positions of the parS sites in the DNA cartoon are represented to scale. (C) Condensation assay. DNA is held at 4 pN while 50 nM ParB2 is injected into the fluid cell in the presence of 2 mM CTP and 4 mM MgCl2. Following a 2 min incubation, the force is lowered to 0.3 pN and the extension recorded (red data). The extension in the absence of protein is shown in black. DNA could not recover the original extension by force after condensation at low force. (D) Average force-extension curves of 13× parS DNA molecules in the presence of 2 mM CTP, 4 mM MgCl2, and increasing concentrations of ParB2. A concentration of only 10 nM ParB2 was able to condense the 13× parS DNA. (E) Average force-extension curves of 13× parS DNA taken under the stated conditions and in the presence of different nucleotides or with no nucleotide. Only CTP produces condensation of parS DNA. Solid lines in the condensed data are guides for the eye. Errors are standard error of the mean for measurements taken on different molecules (N ≥ 6). (F) Condensation assay of 13× parS DNA under 2 mM CTP and 1 mM EDTA conditions. DNA condensation by ParB and CTP requires Mg2+. (G) CTP-binding mutant, ParBR80A, does not condense 13× parS DNA under standard CTP-Mg2+ conditions. No ParB data represent force-extension curves of DNA taken in the absence of protein and are fitted to the worm-like chain model. Errors are standard error of the mean for measurements taken on different molecules (N = 7).


