

Abstract
Myofibroblasts are responsible for wound healing and tissue repair across all organ systems. In periods of growth and disease, myofibroblasts can undergo a phenotypic transition characterized by an increase in extracellular matrix (ECM) deposition rate, changes in various protein expression (e.g., alpha-smooth muscle actin (αSMA)), and elevated contractility. Cell shape is known to correlate closely with stress-fiber geometry and function and is thus a critical feature of cell biophysical state. However, the relationship between myofibroblast shape and contraction is complex, even as well in regards to steady-state contractile level (basal tonus). At present, the relationship between myofibroblast shape and basal tonus in three-dimensional (3D) environments is poorly understood. Herein, we utilize the aortic valve interstitial cell (AVIC) as a representative myofibroblast to investigate the relationship between basal tonus and overall cell shape. AVICs were embedded within 3D poly(ethylene glycol) (PEG) hydrogels containing degradable peptide crosslinkers, adhesive peptide sequences, and submicron fluorescent microspheres to track the local displacement field. We then developed a methodology to evaluate the correlation between overall AVIC shape and basal tonus induced contraction. We computed a volume averaged stretch tensor for the volume occupied by the AVIC, which had three distinct eigenvalues (), suggesting that AVIC shape is a result of anisotropic contraction. Furthermore, the direction of maximum contraction correlated closely with the longest axis of a bounding ellipsoid enclosing the AVIC. As gel-imbedded AVICs are known to be in a stable state by 3 days of incubation used herein, this finding suggests that the overall quiescent AVIC shape is driven by the underlying stress-fiber directional structure and potentially contraction level.
1 Introduction
The resident cellular population of myofibroblasts within most soft tissues maintain normal extracellular matrix (ECM) turnover by excreting, degrading, and remodeling. Myofibroblast function can be modulated by local mechanical cues as well as cytokines such as transforming growth factor beta (TGF-β) [1]. During normal function, myofibroblasts are known to exhibit a baseline level of contraction (i.e., basal tonus) which establishes tensional homeostasis between the cell and surrounding ECM [2]. When this homeostasis is perturbed, as in the case of physical insult or normal growth, myofibroblasts can increase their contraction level and concomitantly change their cell shape. These processes play a crucial role in ECM remodeling and repair [1]. As a result, myofibroblasts are often characterized by the presence of alpha-smooth muscle actin (αSMA) as well as smooth muscle myosin heavy chains which ultimately regulate myofibroblast contractile strength [3].
Myofibroblast contractile properties have been studied in native tissues [4,5] and on two-dimensional (2D) substrates [6]. In native tissue, cell contraction has been shown to significantly increase bulk tissue stiffness as assessed by mechanical evaluation of excised animal tissues in which contraction is induced in the underlying cells [4,5]. However, native tissue suffers from low throughput and limited visualization of cell mechanical function, which limits the assessment of the resulting kinematic effects. Other studies have reported the relationship between cell shape and contractility using 2D culture surfaces [7,8], which are advantageous over native tissues in terms of visualization and throughput. Previously, it has been shown with 2D in vitro studies that cellular shape is correlated with a variety of intracellular mechanisms that regulate cell mechanical function [9–12]. For example, the eccentricity of vascular smooth muscle cell shape was found to be positively correlated with cytoplasmic and nuclear concentrations of calcium, which subsequently leads to higher myosin light chain kinase activity and thus increased cellular contractility [9]. However, 2D in vitro studies are limited because they cannot accurately represent the three-dimensional (3D) nature of the native tissue micro-environment. As a result, the correlation between 3D cell shape and contractile function has yet to be fully elucidated. A better understanding of this relationship could provide insight into the differences in myofibroblast activation between periods of normal physiological growth and disease. Furthermore, a better understanding of this relationship could shed light on why the activation process can become misregulated and prolonged, subsequently leading to pathological conditions such as excessive fibrosis [2] as found in the case of Dupuytren's contracture [13].
More recently, 3D hydrogel matrices have been used to assess the biological and mechanical response of myofibroblasts [14–16]. Three-dimensional hydrogel matrices allow for direct cell visualization, high throughput, and tunable control of the micro-environment [14–18]. Notably, recent advances have allowed for independent control of the mechanical and biochemical properties of 3D hydrogels through incorporation of various types of adhesive peptide sequences and crosslinking peptides [14–16,19–21]. In previous work, synthetic poly(ethylene glycol) (PEG) hydrogels have been used to elucidate myofibroblast biological and mechanical response in 3D. Specifically, it has been shown that aortic valve interstitial cells (AVICs) cultured within 3D hydrogels were more similar to that of freshly isolated AVICs than AVICs cultured on tissue culture polystyrene in terms of the expression levels of genes related to the cytoskeleton and contractility, TGF-β signaling, and matrix remodeling [21]. This finding highlights the importance of employing realistic 3D culture environments for the assessment of myofibroblast contractile behaviors.
The overall objective of this work is to establish a methodology to assess the correlation between overall 3D myofibroblast shape and contractile behavior. We utilized the AVIC as an example myofibrobast and investigate their responses within a 3D PEG gel environment after 3 days of culture. By suspending fluorescent microspheres within the PEG gel, we were able to track the local gel displacements that result from AVIC basal contraction. This approach follows from previous work in the literature on 3D traction force microscopy (TFM) [22,23]. The AVICs were first assessed in a homeostatic state and then within a relaxed state elicited by exposure to cytochalasin-D (CytoD). Through comparison of both states, we gained insight into how AVIC basal tonus affects homeostatic AVIC shape.
2 Methods
2.1 Cell Isolation and Culture.
Porcine hearts were obtained from a local abattoir (Harvest House Farms, Johnsonville, TX) on the day of slaughter, and the aortic valves (AVs) were dissected immediately upon arrival to the lab. AVICs were extracted from the AV using previously published methods [24]. In brief, the AV leaflets were washed in Earle's balanced salt solution (Thermo Fisher Scientific, Waltham, MA) before being subjected to a digestion solution (0.75 mg/ml of collagenase in Earle's balanced salt solution, Thermo Fisher Scientific) for half an hour to remove the valve endothelial cells lining the outside of the leaflets. A second round of digestion was implemented, and the leaflets were incubated within a fresh collagenase solution for 1 h before vortexing the solution to dislodge the AVICs. Afterward, the solution was filtered using a 100 μm cell strainer (VWR, Radnor, PA), and the filtered solution was centrifuged. The cell pellet was resuspended and plated in standard growth media (Dulbecco's modified eagle medium, 10% fetal bovine serum, 2% pen-strep, 0.4% fungizone, all Thermo Fisher Scientific). Only AVICs with passage numbers 2–4 were used for experimentation.
2.2 Three-Dimensional Traction Force Microscopy
Valve Interstitial Cell Imbedded Gel Specimen Preparation.
Porcine AVICs were stained with CellBrite™ Red (Biotum, Hayward, CA) to fluorescently label the cell membranes. The 3D TFM samples were then fabricated by seeding stained AVICs at a density of 500,000 cells/ml within a synthetic PEG hydrogel containing eight-arm 40 kDa norbornene functionalized PEG molecules (JenKem, Beijing, China), matrix metalloproteinase degradable cross linking peptides (Bachem, Bubendorf, Switzerland), cysteine–arginine–glycine–aspartate–serine adhesive peptide sequences (Bachem), and 0.5 μm yellow–green fluorescent microspheres (Polysciences, Warrington, PA) suspended at a density of beads/ml. During the mixing process, the fluorescent microspheres were added first followed by the hydrogel precursor solutions and then the stained AVICs. Adding the components in this order ensured that the fluorescent microspheres did not clump together during the fabrication process. The 3D TFM samples were then polymerized within well dishes with 12 mm glass well inserts to hold the samples in place during the imaging process (Thermo Fisher Scientific). The samples were incubated for 72 h in standard growth media before experimentation.
Imaging.
The growth media surrounding the 3D TFM sample was replaced with Tyrode's salt solution (TSS, Sigma-Aldrich, St. Louis, MO) and incubated for 40 min before a z-stack image set containing a single AVIC and surrounding fluorescent microspheres in the field of view (FOV) was obtained with dimensions μm ( pixels) at a z-step of 0.8 μm using a Zeiss LSM 710 inverted confocal microscope with a 63×, 1.2 numerical aperture water-immersion objective lens (Fig. 1). Then, a stock solution of CytoD (Sigma-Aldrich) was added to achieve a working concentration of 4 μM to relax the basal tonus of the AVIC through actin depolymerization. To allow for sufficient time for the actin depolymerizing effects of CytoD to be observed while minimizing downstream effects on gene expression, the samples were allowed to incubate for 40 min before an additional z-stack image set of the same FOV was obtained. A total of 20 experimental trials were analyzed in this study.
Fig. 1.
![Description of the work flow for each of the 20 cells analyzed. Top row: two 3D images of a single cell surrounded by 0.5 μm fluorescent microspheres were obtained via confocal microscopy before and after treatment with CytoD (only one image is shown here for brevity). Bottom left: the 3D cell geometry and the position of each fluorescent microsphere were segmented from 3D images. Bottom center: a bounding ellipsoid is computed for each cell geometry. Bottom right: the displacements of the fluorescent microspheres between the two image sets are computed using our recently developed software “fm-track” [25].](https://cdn.ncbi.nlm.nih.gov/pmc/blobs/7233/8299802/58ddfcdb4c98/bio-21-1009_094503_g001.jpg)
Description of the work flow for each of the 20 cells analyzed. Top row: two 3D images of a single cell surrounded by 0.5 μm fluorescent microspheres were obtained via confocal microscopy before and after treatment with CytoD (only one image is shown here for brevity). Bottom left: the 3D cell geometry and the position of each fluorescent microsphere were segmented from 3D images. Bottom center: a bounding ellipsoid is computed for each cell geometry. Bottom right: the displacements of the fluorescent microspheres between the two image sets are computed using our recently developed software “fm-track” [25].
Tracking of Fiducial Markers.
For all experimental trials, microsphere displacements were tracked from the CytoD treated state to the TSS state (opposite of how the experiments were conducted) to assess the effect of AVIC basal tonus on hydrogel displacements. Each set of two 3D image stacks was analyzed with our recently developed open source software fm-track [25]. The workflow of the software is as follows. First, it segments each image and determines the 3D position of the centroid of each fluorescent microsphere. Next, it constructs feature vectors extending from the centroid of each microsphere to the centroid of each of the microsphere's five closest neighbors. Then, markers in the first configuration are matched to markers in the second configuration by comparing feature vectors within a spatially defined neighborhood of 15 candidate matches. The difference between the feature vectors of the original marker and each of the 15 candidate markers is computed and recorded as a “test score.” Test scores are computed for all permutations of the feature vectors, and the particle with the overall lowest test score is assigned as a match. If a matching conflict occurs (e.g., two markers are paired with the same marker), the marker with the lowest score is assigned, and the other marker(s) are paired to their next best match. The tracking software is programed to only accept bidirectional matches that hold from both the first configuration to the second configuration and from the second configuration to the first configuration. Marker pairs that did not produce the same result from both matching directions are not considered for further analysis. The tracking algorithm outputs the initial coordinates and displacement vectors for each successfully paired marker (Fig. 2). Furthermore, the software provides a displacement interpolation between each microsphere location via Gaussian process regression [26].
Fig. 2.
![Representative data sheet from analyzing the experimental data with fm-track [25]. Top row: plane slices depicting microsphere displacements in the y-, x-, and z-planes with magenta denoting microsphere displacement vectors oriented toward the AVIC surface and cyan denoting those away from the AVIC surface. The gray and black cross-sectional outlines show the AVIC in its first configuration and second configuration, respectively. Bottom left: microsphere displacement magnitudes decrease with respect to increasing distance from the AVIC surface. Both the microsphere displacement magnitude and distance to cell surface are computed in 3D. Bottom center: segmented AVIC geometry and volume in the second configuration (TSS). Bottom right: AVIC volume within the CytoD and TSS treated states. AVIC volume is not statistically different between each state as determined by a paired t-test (p-value = 0.23). The middle line of the box plot denotes the median. Red markers denote outliers that are greater than 1.5 times the interquartile range above the third quartile. A total of n = 20 cells were tested. (Color version online.)](https://cdn.ncbi.nlm.nih.gov/pmc/blobs/7233/8299802/0887fcbd6f1e/bio-21-1009_094503_g002.jpg)
Representative data sheet from analyzing the experimental data with fm-track [25]. Top row: plane slices depicting microsphere displacements in the y-, x-, and z-planes with magenta denoting microsphere displacement vectors oriented toward the AVIC surface and cyan denoting those away from the AVIC surface. The gray and black cross-sectional outlines show the AVIC in its first configuration and second configuration, respectively. Bottom left: microsphere displacement magnitudes decrease with respect to increasing distance from the AVIC surface. Both the microsphere displacement magnitude and distance to cell surface are computed in 3D. Bottom center: segmented AVIC geometry and volume in the second configuration (TSS). Bottom right: AVIC volume within the CytoD and TSS treated states. AVIC volume is not statistically different between each state as determined by a paired t-test (p-value = 0.23). The middle line of the box plot denotes the median. Red markers denote outliers that are greater than 1.5 times the interquartile range above the third quartile. A total of n = 20 cells were tested. (Color version online.)
Generating Aortic Valve Interstitial Cell Surface Meshes.
A triangulated surface mesh for each AVIC was produced by the fm-track software. This was accomplished by thresholding the 3D experimental image stack containing the AVIC, identifying the largest connected 3D volume of voxels which was assumed to be the AVIC geometry, and using the Lewiner marching cubes algorithm to construct a surface mesh [27]. The fm-track software also computed the volume of the AVICs by multiplying the number of voxels making up the AVIC geometry by the voxel spatial dimensions. This was done for images acquired after the TSS and CytoD treatment.
2.3 Aortic Valve Interstitial Cell Shape Characterization.
Imbedded myofibroblasts generally have very complex geometries within 3D environments, often containing multiple protrusions that vary in overall size and length [15]. For this study, we are interested in overall cell shape rather than the granular details. To this end, approximate descriptors of AVIC shape were obtained through computing the minimum volume enclosing ellipsoids (bounding ellipsoids) of each AVIC geometry. The resulting length of the axes and the orientation of the ellipsoid are used to characterize the AVIC shape. Minimum volume enclosing ellipsoids were computed using a modified version of a script [28] based on Khachiyan's algorithm (Algorithm 1) [29]. The algorithm finds the minimum enclosing ellipsoid of a data point cloud stored in matrix P by solving the following optimization problem:
| (1) |
where A is a 3 × 3 matrix of the ellipse equation in center form such that
| (2) |
and c is the center of the ellipsoid. The optimization problem was solved using Algorithm 1 to obtain A and c. Then, the radii and orientation of the ellipsoid are obtained by singular value decomposition of A into matrices U, S, and V such that
| (3) |
Algorithm 1.
| Result: bounding ellipsoid |
| point cloud of cell geometry |
| n number of points in |
| error |
| tolerance |
| u |
| while error > tolerance do |
| end |
| = diag() |
| = |
The radii are simply the inverse of the square root of the diagonal elements of matrix S, and the orientation of the bounding ellipsoid is obtained from the rotation matrix V. From this method, the length and orientation of three orthogonal axes that describe the bounding ellipsoid are obtained. The orientation of the major axis (e3) is used to represent the approximate orientation of the AVIC shape.
2.4 Describing Aortic Valve Interstitial Cell Average Deformation.
In order to determine the inter-relationship between AVIC shape and overall contraction pattern, we utilized our ability to interpolate TFM microsphere displacements using fm-track [25]. Gaussian process regression [26] was used to interpolate the local hydrogel displacement field to compute the displacements u at the center of each triangular facet of the AVIC surface mesh. Next, mean deformation metrics (MDMs) were computed to quantify the change that the AVIC shape undergoes due to AVIC basal tonus [30]. This was done by first computing a mean displacement gradient using
| (4) |
where represents the volume of the AVIC geometry in the initial configuration (VAVIC), is the boundary of VAVIC, dA is an infinitesimal element on the boundary , and n is the unit surface normal of dA. This approach provides a simple and convenient method to compute a volume average displacement gradient from cell surface displacements only. From this, the mean deformation gradient tensor is simply computed as follows:
| (5) |
From polar decomposition theorem, , the mean stretch and rotation tensors are obtained. The eigenvalues () and eigenvectors () of are computed and represent the magnitudes and directions of principal AVIC shape deformation. Because the analysis is conducted from the CytoD treated state to the TSS state, maximum contraction is captured by (), and maximum expansion is captured by (). We noted that , with a mean rotation angle along any axis of less than 2 deg, so that here .
2.5 Investigating the Correlation Between Aortic Valve Interstitial Cell Eccentricity and Magnitude of Aortic Valve Interstitial Cell Contraction.
It has been previously demonstrated with 2D in vitro studies that increased cell eccentricity leads to increased cell contractility [7–9,31,32]. Here, this observation is tested in 3D. The eccentricity of the AVIC shapes was quantified by computing the aspect ratios of the bounding ellipsoids (length of long axis/average of two minor axes), and the magnitude of AVIC contraction was represented by λ3. The correlation of these two variables is assessed using Pearson's correlation coefficient.
2.6 Statistical Methods
Data Exclusion Criteria.
Experimental trials were excluded from analysis based on two criteria. First, if the AVIC surface was less than 10 μm from any boundary of the FOV within either the TSS or CytoD treated states, the trial was excluded from further analysis under the assumption that the experiment failed to capture the full displacement field produced by the AVIC. Then, the effect size of the trial was assessed. The mean of the displacement magnitudes within 10 μm of the cell surface was used as a metric to represent the effect size of the trial. This value was compared to synthetic data obtained by randomly shuffling the displacement magnitude versus distance to cell surface data (e.g., Fig. 2, bottom left). This was done by assigning each displacement magnitude value to a random distance from cell surface value. Next, the average and standard deviation of the synthetic displacement magnitudes within 10 μm of the cell surface were computed. If the experimental average was within three standard deviations from the synthetic mean, the effect size was considered insignificant, and the experimental trial was excluded from analysis. A total of 20 experimental trials were deemed acceptable and were analyzed in this study.
Testing the Relationship Between Aortic Valve Interstitial Cell Orientation and Direction of Maximum Contraction.
The dot product between the unit vectors describing the longest axis of the bounding ellipsoid (e3) and the direction of maximum contraction (v3) was computed to assess if a correlation existed between AVIC orientation and the direction of maximum contraction. A dot product of indicates parallel unit vectors and complete agreement between the direction of AVIC contraction and AVIC shape orientation, whereas indicates orthogonal unit vectors.
Monte Carlo Simulation.
Standard statistical techniques often assume that the random variables being compared are from normal distributions. Here, we do not assume the distribution of the e3 and v3 vectors. Instead, a nonparametric statistical method was used to assess the statistical significance of the correlation between e3 and v3. To this end, a Monte Carlo simulation of the random scenario was performed. Specifically, random unit vectors were generated for the direction of AVIC orientation (E), and their dot products with the experimentally observed directions of maximum contraction (V) were computed (Algorithm 2). This process was implemented for each of the 20 experimental trials, and the mean dot product was reported. For convergence, 10,000 Monte Carlo simulations were run, and the results are illustrated as the distribution of their means. Outliers of the random distribution were defined as values greater than three standard deviations away from the mean of the random distribution. If the experimental observations were substantially far from the mean of the random distribution, the null hypothesis that the relationship between the orientation of AVICs and the direction of maximum contraction is random can be rejected.
Algorithm 2.
Monte Carlo simulation algorithm used to obtain a distribution representing the hypothetical case where the relationship between AVIC orientation (e3) and the direction of maximum contraction (v3) is random
| Result: Monte Carlo simulation |
| for i = 1:10,000 do |
| (generates random unit vectors) |
| (row-wise dot product) |
| end |
3 Results
3.1 Relaxing Aortic Valve Interstitial Cell Basal Tonus in a Three-Dimensional Synthetic Hydrogel Environment Produces a Local Gel Displacement Field.
To visualize the effects of cessation of stress-fiber contraction via CytoD, planar cross sections of the FOV taken through the center of each AVIC were performed. Results revealed that, qualitatively, the hydrogel displacement patterns were highly directional, with regions of contraction toward the AVIC surface and expansion away from the AVIC surface (Fig. 2, top row). In addition, we observed that the magnitude of bead displacement decreased nonlinearly with respect to increasing distance from the AVIC surface (Fig. 2, bottom left). Both the microsphere displacement magnitude and distance to cell surface are computed in 3D. We also noted that the AVIC volumes did not change significantly between the two configurations (Fig. 2, bottom right).
3.2 Basal Tonus Contribution to Aortic Valve Interstitial Cell Shape.
Following the methods described in Sec. 2.4, the average deformation of the volume occupied by the AVIC was determined using MDMs [30] to investigate the kinematic effects of AVIC basal tonus on the resulting AVIC shape. The MDMs for each of the 20 AVICs were computed and summarized in a box-and-whiskers plot (Fig. 3(a)). The median MDM eigenvalues were 1.08, 0.99, and 0.89 for λ1, λ2, and λ3, respectively. The results of this analysis revealed that AVIC basal tonus causes a consistent pattern of AVIC shape changes characterized by contraction in one direction (λ3), expansion in an orthogonal direction (λ1), and virtually no deformation in the direction orthogonal to the previous two (λ2) (Fig. 3(a)). A schematic is provided which demonstrates the effects of the deformation patterns on a reference spherical geometry (Fig. 3(b)). The characteristic deformation pattern will cause a sphere to morph to an ellipsoid.
Fig. 4.
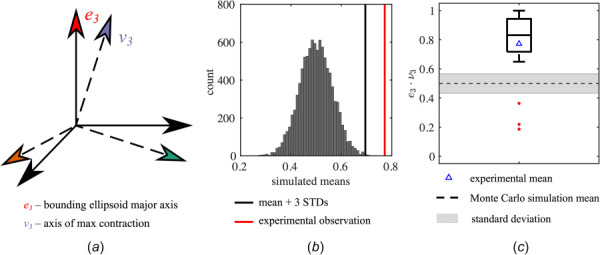
Comparison between the direction of AVIC shape orientation from ellipsoidal approximation and the direction of maximum contraction computed by MDM. (a) Schematic illustrating the unit vector of the major axis of the best-fit ellipsoid (e3) and the direction of maximum contraction (v3). (b) The distribution of means for 10,000 Monte Carlo simulations which represent a random correlation between e3 and v3. Each Monte Carlo simulation consisted of computing the dot products between 20 randomly oriented unit vectors and the experimentally observed values of v3. The mean of the experimental observation (red line) was more than three standard deviations above the mean of the Monte Carlo simulation (black line) which suggests that the correlation between e3 and v3 is not random. (c) Box-and-whiskers plot of the dot products between e3 and v3 from the experimental data is shown along with the experimental mean (0.77). The middle line of the box plot denotes the median, whereas the triangular marker denotes the mean. Red markers denote outliers that are less than 1.5 times the interquartile range below the first quartile. In addition, the mean and standard deviation of the Monte Carlo simulation results (dashed line and gray area, respectively) are superimposed. A total of n = 20 cells were tested. (Color version online.)
Fig. 3.
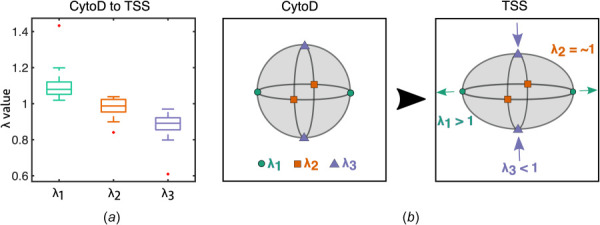
Kinematic summary of changes in AVIC shape due to basal tonus. (a) Box-and-whiskers plot of the eigenvalues of the mean stretch tensor . The middle line of the box plot denotes the median. Red markers denote outliers defined as values either greater than 1.5 times the interquartile range above the third quartile or less than 1.5 times the interquartile range below the first quartile. A total of n = 20 cells were tested. (b) A schematic demonstrating typical deformations that AVICs undergo from the CytoD state to the TSS state characterized by contraction in one direction (), expansion in an orthogonal direction (), and virtually no deformation in the region orthogonal to the previous two (). (Color version online.)
3.3 Aortic Valve Interstitial Cell Orientation and Direction of Maximum Contraction Are Correlated.
Following the methods outlined in Sec. 2.6, the correlation between AVIC orientation and the direction of maximum contraction was assessed by computing the dot product , where e3 is the direction of the longest axis of the AVIC bounding ellipsoid, and v3 is the direction of maximum gel contraction (Fig. 4(a)). This allows for a quantitative measure of the correlation between AVIC shape and AVIC basal tonus. The dot product was computed for all 20 AVICs and was found to be greater than three standard deviations above the mean of the Monte Carlo simulations which represent the random scenario (Fig. 4(b)). This indicates that the null hypothesis that the relationship between the orientation of AVICs and the direction of maximum contraction is random can be rejected. The distribution of the experimentally observed results is also summarized in a box-and-whiskers plot (Fig. 4(c)).
3.4 Aortic Valve Interstitial Cell Eccentricity and Magnitude of Contraction Are Not Correlated in Three-Dimensional Poly(Ethylene Glycol) Hydrogel Environment.
To assess the correlation between 3D AVIC eccentricity and contraction magnitude, we plotted the third eigenvalue (λ3) of the mean stretch tensor against the aspect ratio of the bounding ellipsoid (length of long axis/average of two minor axes) for all 20 cells (Fig. 5) and computed Pearson's correlation coefficient. From this analysis, a Pearson's correlation coefficient of was observed. However, the correlation was found to not be statistically significant (p-value ). Therefore, in this 3D experimental environment, the eccentricity of AVIC shape is not correlated with the magnitude of contraction.
Fig. 5.
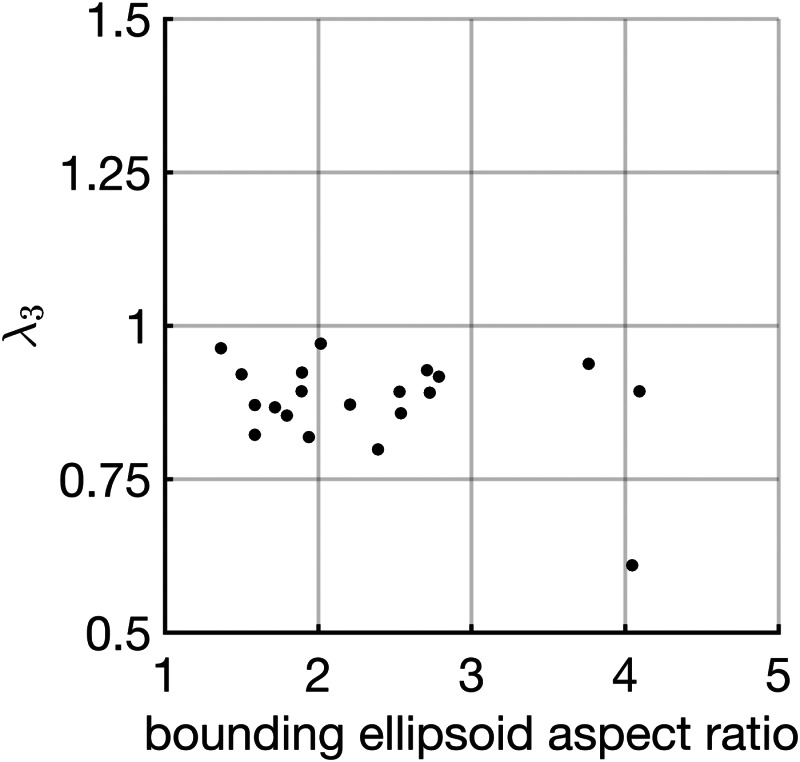
Assessing the correlation between AVIC eccentricity and AVIC contraction magnitude. Plot of the third eigenvalue (λ3) of the mean stretch tensor against the aspect ratio of the bounding ellipsoid showed no statistically significant correlation as assessed by Pearson's correlation coefficient ( and p-value = 0.16). This suggests that the magnitude of AVIC contraction is not meaningfully correlated with AVIC eccentricity in 3D.
4 Discussion
4.1 Initial Analysis of the Relationship Between Aortic Valve Interstitial Cell Shape and Basal Tonus.
The average experimentally observed relationship between longest AVIC axis and maximum contraction (measured by the dot product ) is greater than what would be predicted if there was no correlation between AVIC orientation and direction of maximum contraction (Fig. 4(b)). This result suggests that the direction of AVIC orientation and the direction of maximum contraction are correlated. This is consistent with observations in 2D studies that demonstrated that an aligned AVIC population produced substantial bending in a thin-film cantilever along the direction of the longest AVIC shape axis [8]. Broadly speaking, these results indicate that the direction of the longest AVIC shape axis is correlated with the direction of AVIC contraction in both 2D and 3D environments. This observation is possibly a result of the structure–function relationship in AVICs. Specifically, cell shape in general is related to the orientation of subcellular stress-fibers [33,34]. In AVICs, filamentous actin (F-actin) stress-fiber orientation has been previously shown to be correlated with AVIC shape [7].
Previous work from our group investigated the roles of αSMA and F-actin stress-fibers in AVIC intrinsic stiffness and contractile force generation [35,36]. Our results indicated that αSMA stress-fibers were the dominant contributor toward stress-fiber force generation, especially among activated AVICs that were treated with TGF-β1 and potassium chloride to elicit a myofibroblast phenotype. However, F-actin and αSMA stress-fibers were both found to be crucial in modulating AVIC contractile forces. Based on these observations, we hypothesize that F-actin and αSMA stress-fibers play large roles in modulating both the contractile behavior and the homeostatic cell shape of AVICs in 3D PEG hydrogel environments.
4.2 Insight Into the Differences of Aortic Valve Interstitial Cell Biomechanical Behaviors Within Two-Dimensional and Three-Dimensional Environments.
In 2D environments, it has been demonstrated that AVIC shape is correlated with the direction and magnitude of contraction for both single-cells [7] and cell populations [8]. Specifically, it has been shown that the basal tonus of elongated AVICs produced greater levels of stress than the basal tonus of less elongated AVICs [7]. This finding suggests that AVIC shape potentially influences internal stress-fiber function and thus the resulting contractile behaviors. However, our investigations into the correlation between AVIC shape and contractile behaviors within a 3D isotropic PEG gel showed that AVIC eccentricity, as represented by the aspect ratio of the bounding ellipsoid, was not meaningfully correlated with the magnitude of contraction (λ3) due to basal tonus (Fig. 5). This finding makes it clear that further investigation is required into the correlation between AVIC shape and basal tonus in a 3D environment. Based on the previous work in the literature and our initial findings, it is likely that this phenomenon depends upon the dimension of the culture system (constrained 2D versus unconstrained 2D versus 3D). Previous work by Mabry et al. demonstrated that AVIC gene expression varied substantially between 2D and 3D cultures [21]. Most notably, AVICs seeded within 3D hydrogel matrices showed more similarities to freshly isolated AVICs than AVICs seeded on 2D substrates in terms of gene expression levels for cytoskeletal organization and focal adhesions. This finding suggests that 3D culture matrices elicit AVIC contractile and adhesion behaviors that are most similar to the native tissue environment. Furthermore, 2D versus 3D cell mechanical function may be influenced by the spatial distribution of adhesion sites [37]. For example, in 2D cultures, cell adhesion is constrained to a horizontal plane, whereas in 3D, cells can from adhesion sites in all three dimensions. Moreover, differences between cell behavior in 2D and 3D may arise because cell shape influences stress-fiber orientation and function differently in 3D gel environments. Clearly, further investigation is needed to thoroughly elucidate the dimension-dependent mechanical response of myofibroblast cells.
4.3 Limitations and Future Directions.
In this study, we computed bounding ellipsoids of the AVIC membrane surfaces to obtain approximate AVIC shape descriptors. Although the bounding ellipsoids were useful, they cannot account for detailed cellular shape/structures that may play a large role in AVIC contractile behaviors [33,34]. For example, bounding ellipsoids do not record the number, size, and curvature of pseudopodia [38]. Therefore, the bounding ellipsoid serves as an informative but ultimately first approximation. Regarding underlying relations to specific stress-fiber structures, direct observations of the relationship between 3D cell shape and stress-fiber orientation are limited due to the feature size of individual stress-fibers (F-actin fibers are approximately 7 nm in diameter [39]) falling well below the axial resolution of light microscopy. We thus only report on the observed correlations between AVIC shape and the direction of greatest contraction. Ongoing work will focus on addressing the current limitations by employing more advanced methods to quantify cell shape and the kinematic effects of cell contraction.
4.4 Summary.
Our findings indicated that a clear correlation existed between AVIC overall shape and orientation and the direction of maximum basal tonus-derived contraction. Specifically, AVIC basal tonus produced consistent changes in AVIC shape characterized by contraction in one primary direction, expansion in an orthogonal direction, and virtually no change in the third orthogonal direction. As gel-imbedded AVICs are known to be in a relatively stable state by 3 days of incubation used herein [16,20], this finding suggested that the overall quiescent AVIC shape is driven by the underlying homeostatic stress-fiber directional structure and contraction level. These findings may also hold for myofibroblasts as a whole.
Acknowledgment
We thank Dr. Kristi Anseth's research group for help with the PEG hydrogel chemistry.
Funding Data
National Science Foundation, U.S., Graduate Research Fellowship (Grant No. DGE-1610403; Funder ID: 10.13039/100000001) and National Institutes of Health, U.S. (Grant No. F31HL154654; Funder ID: 10.13039/100000002) awarded to Alex Khang.
Peter O'Donnell, Jr. Postdoctoral Fellowship awarded to Emma Lejeune.
American Heart Association, U.S., Postdoctoral Fellowship (Grant No. 18POST33990101; Funder ID: 10.13039/100000968) awarded to Daniel P. Howsmon.
National Institutes of Health, U.S. (Grant Nos. R01 HL-119297, HL-073021, and HL-142504; Funder ID: 10.13039/100000002) awarded to Michael S. Sacks.
Nomenclature
- AV =
aortic valve
- AVICs =
aortic valve interstitial cells
- CytoD =
cytochalasin-D
- ECM =
extracellular matrix
- F-actin =
filamentous actin
- FOV =
field of view
- MDMs =
mean deformation metrics [30]
- PEG =
poly(ethylene glycol)
- TFM =
traction force microscopy
- TGF-β =
transforming growth factor beta
- TSS =
Tyrode's salt solution
- αSMA =
alpha-smooth muscle actin
References
- [1]. Water, L. V. D. , Varney, S. , and Tomasek, J. J. , 2013, “ Mechanoregulation of the Myofibroblast in Wound Contraction, Scarring, and Fibrosis: Opportunities for New Therapeutic Intervention,” Adv. Wound Care, 2(4), pp. 122–141. 10.1089/wound.2012.0393 [DOI] [PMC free article] [PubMed] [Google Scholar]
- [2]. Li, B. , and Wang, J. H. , 2011, “ Fibroblasts and Myofibroblasts in Wound Healing: Force Generation and Measurement,” J. Tissue Viability, 20(4), pp. 108–120. 10.1016/j.jtv.2009.11.004 [DOI] [PMC free article] [PubMed] [Google Scholar]
- [3]. Boswell, C. A. , Joris, I. , and Majno, G. , 1992, “ The Concept of Cellular Tone: Reflections on the Endothelium, Fibroblasts, and Smooth Muscle Cells,” Perspect. Biol. Med., 36(1), pp. 79–86. 10.1353/pbm.1993.0008 [DOI] [PubMed] [Google Scholar]
- [4]. Merryman, W. D. , Huang, H. Y. S. , Schoen, F. J. , and Sacks, M. S. , 2006, “ The Effects of Cellular Contraction on Aortic Valve Leaflet Flexural Stiffness,” J. Biomech., 39(1), pp. 88–96. 10.1016/j.jbiomech.2004.11.008 [DOI] [PubMed] [Google Scholar]
- [5]. Kershaw, J. D. , Misfeld, M. , Sievers, H. H. , Yacoub, M. H. , and Chester, A. H. , 2004, “ Specific Regional and Directional Contractile Responses of Aortic Cusp Tissue,” J. Heart Valve Dis., 13(5), pp. 798–803. https://www.researchgate.net/profile/Adrian-Chester/publication/8243281_Specific_regional_and_directional_contractile_responses_of_aortic_cusp_tissue/links/0deec52d3ad9bb0f7a000000/Specific-regional-and-directional-contractile-responses-of-aortic-cusp-tissue.pdf [PubMed] [Google Scholar]
- [6]. Cirka, H. , Monterosso, M. , Diamantides, N. , Favreau, J. , Wen, Q. , and Billiar, K. , 2016, “ Active Traction Force Response to Long-Term Cyclic Stretch Is Dependent on Cell Pre-Stress,” Biophys. J., 110(8), pp. 1845–1857. 10.1016/j.bpj.2016.02.036 [DOI] [PMC free article] [PubMed] [Google Scholar]
- [7]. Lam, N. T. , Muldoon, T. J. , Quinn, K. P. , Rajaram, N. , and Balachandran, K. , 2016, “ Valve Interstitial Cell Contractile Strength and Metabolic State Are Dependent on Its Shape,” Integr. Biol., 8(10), pp. 1079–1089. 10.1039/C6IB00120C [DOI] [PMC free article] [PubMed] [Google Scholar]
- [8]. Tandon, I. , Razavi, A. , Ravishankar, P. , Walker, A. , Sturdivant, N. M. , Lam, N. T. , Wolchok, J. C. , and Balachandran, K. , 2016, “ Valve Interstitial Cell Shape Modulates Cell Contractility Independent of Cell Phenotype,” J. Biomech., 49(14), pp. 3289–3297. 10.1016/j.jbiomech.2016.08.013 [DOI] [PubMed] [Google Scholar]
- [9]. Calizo, R. C. , Bell, M. K. , Ron, A. , Hu, M. , Bhattacharya, S. , Wong, N. J. , Janssen, W. , Perumal, G. , Pederson, P. , Scarlata, S. , Hone, J. , Azeloglu, E. U. , Rangamani, P. , and Iyengar, R. , 2020, “ Cell Shape Regulates Subcellular Organelle Location to Control Early Ca2+ Signal Dynamics in Vascular Smooth Muscle Cells,” Sci. Rep., 10(1), p. 17866. 10.1038/s41598-020-74700-x [DOI] [PMC free article] [PubMed] [Google Scholar]
- [10]. Esfahani, P. H. , and Knoll, R. , 2020, “ Cell Shape: Effects on Gene Expression and Signaling,” Biophys. Rev., 12(4), pp. 895–901. 10.1007/s12551-020-00722-4 [DOI] [PMC free article] [PubMed] [Google Scholar]
- [11]. Haupt, A. , and Minc, N. , 2018, “ How Cells Sense Their Own Shape—Mechanisms to Probe Cell Geometry and Their Implications in Cellular Organization and Function,” J. Cell Sci., 131(6), p. jcs214015. 10.1242/jcs.214015 [DOI] [PubMed] [Google Scholar]
- [12]. Rangamani, P. , Lipshtat, A. , Azeloglu, E. U. , Calizo, R. C. , Hu, M. , Ghassemi, S. , Hone, J. , Scarlata, S. , Neves, S. R. , and Iyengar, R. , 2013, “ Decoding Information in Cell Shape,” Cell, 154(6), pp. 1356–1369. 10.1016/j.cell.2013.08.026 [DOI] [PMC free article] [PubMed] [Google Scholar]
- [13]. Townley, W. A. , Baker, R. , Sheppard, N. , and Grobbelaar, A. O. , 2006, “ Dupuytren's Contracture Unfolded,” BMJ, 332(7538), pp. 397–400. 10.1136/bmj.332.7538.397 [DOI] [PMC free article] [PubMed] [Google Scholar]
- [14]. Khang, A. , Rodriguez, A. G. , Schroeder, M. E. , Sansom, J. , Lejeune, E. , Anseth, K. S. , and Sacks, M. S. , 2019, “ Quantifying Heart Valve Interstitial Cell Contractile State Using Highly Tunable Poly(Ethylene Glycol) Hydrogels,” Acta Biomater., 96, pp. 354–367. 10.1016/j.actbio.2019.07.010 [DOI] [PMC free article] [PubMed] [Google Scholar]
- [15]. Benton, J. A. , Fairbanks, B. D. , and Anseth, K. S. , 2009, “ Characterization of Valvular Interstitial Cell Function in Three Dimensional Matrix Metalloproteinase Degradable PEG Hydrogels,” Biomaterials, 30(34), pp. 6593–6603. 10.1016/j.biomaterials.2009.08.031 [DOI] [PMC free article] [PubMed] [Google Scholar]
- [16]. Mabry, K. M. , Lawrence, R. L. , and Anseth, K. S. , 2015, “ Dynamic Stiffening of Poly(Ethylene Glycol)-Based Hydrogels to Direct Valvular Interstitial Cell Phenotype in a Three-Dimensional Environment,” Biomaterials, 49, pp. 47–56. 10.1016/j.biomaterials.2015.01.047 [DOI] [PMC free article] [PubMed] [Google Scholar]
- [17]. Tibbitt, M. W. , and Anseth, K. S. , 2009, “ Hydrogels as Extracellular Matrix Mimics for 3D Cell Culture,” Biotechnol. Bioeng., 103(4), pp. 655–663. 10.1002/bit.22361 [DOI] [PMC free article] [PubMed] [Google Scholar]
- [18]. Caliari, S. R. , and Burdick, J. A. , 2016, “ A Practical Guide to Hydrogels for Cell Culture,” Nat. Methods, 13(5), pp. 405–414. 10.1038/nmeth.3839 [DOI] [PMC free article] [PubMed] [Google Scholar]
- [19]. Gould, S. T. , Darling, N. J. , and Anseth, K. S. , 2012, “ Small Peptide Functionalized Thiol–Ene Hydrogels as Culture Substrates for Understanding Valvular Interstitial Cell Activation and de Novo Tissue Deposition,” Acta Biomater., 8(9), pp. 3201–3209. 10.1016/j.actbio.2012.05.009 [DOI] [PMC free article] [PubMed] [Google Scholar]
- [20]. Mabry, K. M. , Schroeder, M. E. , Payne, S. Z. , and Anseth, K. S. , 2016, “ Three-Dimensional Highthroughput Cell Encapsulation Platform to Study Changes in Cell-Matrix Interactions,” Appl. Mater. Interfaces, 8(34), pp. 21914–21922. 10.1021/acsami.5b11359 [DOI] [PubMed] [Google Scholar]
- [21]. Mabry, K. M. , Payne, S. Z. , and Anseth, K. S. , 2016, “ Microarray Analyses to Quantify Advantages of 2D and 3D Hydrogel Culture Systems in Maintaining the Native Valvular Interstitial Cell Phenotype,” Biomaterials, 74, pp. 31–41. 10.1016/j.biomaterials.2015.09.035 [DOI] [PMC free article] [PubMed] [Google Scholar]
- [22]. Legant, W. R. , Miller, J. S. , Blakely, B. L. , Cohen, D. M. , Genin, G. M. , and Chen, C. S. , 2010, “ Measurement of Mechanical Tractions Exerted by Cells in Three-Dimensional Matrices,” Nat. Methods, 7(12), pp. 969–971. 10.1038/nmeth.1531 [DOI] [PMC free article] [PubMed] [Google Scholar]
- [23]. Koch, T. M. , Münster, S. , Bonakdar, N. , Butler, J. P. , and Fabry, B. , 2012, “ 3D Traction Forces in Cancer Cell Invasion,” PLoS ONE, 7(3), p. e33476. 10.1371/journal.pone.0033476 [DOI] [PMC free article] [PubMed] [Google Scholar]
- [24]. Johnson, C. , Hanson, M. , and Helgeson, S. , 1987, “ Porcine Cardiac Valvular Subendothelial Cells in Culture: Cell Isolation and Growth Characteristics,” J. Mol. Cell. Cardiol., 19(12), pp. 1185–1193. 10.1016/S0022-2828(87)80529-1 [DOI] [PubMed] [Google Scholar]
- [25]. Lejeune, E. , Khang, A. , Sansom, J. , and Sacks, M. S. , 2020, “ FM-Track: A Fiducial Marker Tracking Software for Studying Cell Mechanics in a Three-Dimensional Environment,” SoftwareX, 11, p. 100417. 10.1016/j.softx.2020.100417 [DOI] [PMC free article] [PubMed] [Google Scholar]
- [26]. Pedregosa, F. , Varoquaux, G. , Gramfort, A. , Michel, V. , Thirion, B. , Grisel, O. , Blondel, M. , Prettenhofer, P. , Weiss, R. , Dubourg, V. , Vanderplas, J. , Passos, A. , Cournapeau, D. , Brucher, M. , Perrot, M. , and Duchesnay, E. , 2011, “ Scikit-Learn: Machine Learning in Python,” J. Mach. Learn. Res., 12, pp. 2825–2830.https://jmlr.org/papers/volume12/pedregosa11a/pedregosa11a.pdf [Google Scholar]
- [27]. van der Walt, S. , Schönberger, J. L. , Nunez-Iglesias, J. , Boulogne, F. , Warner, J. D. , Yager, N. , Gouillart, E. , and Yu, T. , 2014, “ Scikit-Image: Image Processing in Python,” PeerJ, 2, p. e453. 10.7717/peerj.453 [DOI] [PMC free article] [PubMed] [Google Scholar]
- [28]. Moshtagh, N. , 2021, “ Minimum Volume Enclosing Ellipsoid,” MATLAB Central File Exchange, accessed Apr. 24, 2021, https://www.mathworks.com/matlabcentral/fileexchange/9542-minimum-volume-enclosing-ellipsoid
- [29]. Khachiyan, L. , 1980, “ Polynomial Algorithms in Linear Programming,” USSR Comput. Math. Math. Phys., 20(1), pp. 53–72. 10.1016/0041-5553(80)90061-0 [DOI] [Google Scholar]
- [30]. Stout, D. A. , Bar-Kochba, E. , Estrada, J. B. , Toyjanova, J. , Kesari, H. , Reichner, J. S. , and Franck, C. , 2016, “ Mean Deformation Metrics for Quantifying 3D Cell–Matrix Interactions Without Requiring Information About Matrix Material Properties,” Proc. Natl. Acad. Sci., 113(11), pp. 2898–2903. 10.1073/pnas.1510935113 [DOI] [PMC free article] [PubMed] [Google Scholar]
- [31]. Ye, G. J. C. , Aratyn-Schaus, Y. , Nesmith, A. P. , Pasqualini, F. S. , Alford, P. W. , and Parker, K. K. , 2014, “ The Contractile Strength of Vascular Smooth Muscle Myocytes Is Shape Dependent,” Integr. Biol., 6(2), pp. 152–163. 10.1039/c3ib40230d [DOI] [PubMed] [Google Scholar]
- [32]. Alford, P. W. , Nesmith, A. P. , Seywerd, J. N. , Grosberg, A. , and Parker, K. K. , 2011, “ Vascular Smooth Muscle Contractility Depends on Cell Shape,” Integr. Biol., 3(11), pp. 1063–1070. 10.1039/c1ib00061f [DOI] [PMC free article] [PubMed] [Google Scholar]
- [33]. Zemel, A. , Rehfeldt, F. , Brown, A. E. X. , Discher, D. E. , and Safran, S. A. , 2010, “ Cell Shape, Spreading Symmetry, and the Polarization of Stress-Fibers in Cells,” J. Phys.: Condens. Matter, 22(19), p. 194110. 10.1088/0953-8984/22/19/194110 [DOI] [PMC free article] [PubMed] [Google Scholar]
- [34]. Burnette, D. T. , Shao, L. , Ott, C. , Pasapera, A. M. , Fischer, R. S. , Baird, M. A. , Loughian, C. D. , Delanoe-Ayari, H. , Paszek, M. J. , Davidson, M. W. , Betzig, E. , and Lippincott-Schwartz, J. , 2014, “ A Contractile and Counterbalancing Adhesion System Controls the 3D Shape of Crawling Cells,” J. Cell Biol., 205(1), pp. 83–96. 10.1083/jcb.201311104 [DOI] [PMC free article] [PubMed] [Google Scholar]
- [35]. Sakamoto, Y. , Buchanan, R. M. , Sanchez-Adams, J. , Guilak, F. , and Sacks, M. S. , 2017, “ On the Functional Role of Valve Interstitial Cell Stress Fibers: A Continuum Modeling Approach,” ASME J. Biomech. Eng., 139(2), p. 021007. 10.1115/1.4035557 [DOI] [PMC free article] [PubMed] [Google Scholar]
- [36]. Sakamoto, Y. , Buchanan, R. M. , and Sacks, M. S. , 2016, “ On Intrinsic Stress Fiber Contractile Forces in Semilunar Heart Valve Interstitial Cells Using a Continuum Mixture Model,” J. Mech. Behav. Biomed. Mater., 54, pp. 244–258. 10.1016/j.jmbbm.2015.09.027 [DOI] [PMC free article] [PubMed] [Google Scholar]
- [37]. Baker, B. M. , and Chen, C. S. , 2012, “ Deconstructing the Third Dimension—How 3D Culture Microenvironments Alter Cellular Cues,” J. Cell Sci., 125(13), pp. 3015–3024. 10.1242/jcs.079509 [DOI] [PMC free article] [PubMed] [Google Scholar]
- [38]. Haastert, P. J. V. , 2010, “ A Stochastic Model for Chemotaxis Based on the Ordered Extension of Pseudopods,” Biophys. J., 99(10), pp. 3345–3354. 10.1016/j.bpj.2010.09.042 [DOI] [PMC free article] [PubMed] [Google Scholar]
- [39]. Grazi, E. , 1997, “ What Is the Diameter of the Actin Filament?,” FEBS Lett., 405(3), pp. 249–252. 10.1016/S0014-5793(97)00214-7 [DOI] [PubMed] [Google Scholar]