

Abstract
A priori power analyses have become increasingly popular in scientific communities, but the practice has not been widely discussed by HFE researchers. Given the complexity of conducting such analyses, software tools are essential. We review the emergence and current state of power analysis software tools, and use the concept of User-Centered Design as an analytical lens for examining the relationship between researchers’ needs and power analysis tools’ characteristics. Centering on users’ wants and needs, we propose a decision-aiding process to assist researchers in identifying appropriate power analysis tools. This process consists of five user-centered considerations – two functional criteria (software input; software output) and three usability heuristics (learnability; ease of use; accessibility) – which are organized into a workflow. These criteria and heuristics are translated into questions that researchers should go through during the decision process. We illustrate use of the decision-aiding process with three example scenarios and lay out implications for researchers.
INTRODUCTION
A major aim of empirical research methodology is to design studies that are likely to reject the null hypothesis if it is indeed false. One key strategy for increasing the likelihood of correctly rejecting a false null (i.e., power) is to perform an a priori power analysis. Power is a function of the magnitude of an effect, variability, sample size, and Type I error level (Cohen, 1992). Power analysis, then, broadly refers to a process of determining design characteristics (often sample size) for a planned study to optimize the likelihood of correctly rejecting the null hypothesis in that study, given a particular statistical model. Power analysis has a number of useful applications, such as optimizing limited resources when conducting research (Lane & Hennes, 2019).
Many methods exist for calculating statistical power. For very basic statistical tests, power can be calculated directly, and results can be presented in tables (e.g., Cohen, 1988). However, for more complex tests and most non-parametric statistics, such tables are not available (Thomas & Juanes, 1996). Estimating a priori power can be challenging even for experienced researchers (Bakker, Hartgerink, Wicherts, & van der Maas, 2016). Thus, statistical software tools or packages programmed for estimating power are resources that can make power analysis easier to perform (Thomas & Krebs, 1997).
Usability of the software tools plays an essential role in the ability of researchers to plan studies with sufficient power to be informative. As human factors and ergonomics (HFE) researchers routinely conduct human-subject studies with a variety of designs that employ significance testing, a power analysis tool is recommended when estimating sample size of a planned experiment. To introduce HFE researchers broadly to the considerations that inform selection of a power analysis tool, we review the emergence and current state of such tools. Then, by focusing on the concept of User-Centered Design (UCD), we propose a decision-aiding process, consisting of two criteria and three heuristics, to help HFE researchers identify power analysis software tools that fit their needs. The criteria are guidelines that should be followed closely; the heuristics are rules of thumb that allow consideration and balancing of several relevant factors. We describe each step in the process and explain how these factors may influence researchers. Three scenarios are employed to demonstrate how our work can be utilized. Finally, we discuss implications of our proposed decision-aiding process and recommendations for future work.
Power Analysis Software Tools for Researchers
Several authors have reviewed and categorized early software tools for performing power analysis from various perspectives (Goldstein, 1989; Peng, Long, & Abaci, 2012; Thomas & Krebs, 1997). In this paper, we focus on statistical tools that can estimate sample size, calculate prospective (a priori) power, or conduct sensitivity analyses. Because power calculated from observed data is a direct transformation of the estimated p value, the observed power (a posteriori) is not useful for study design and not relevant to our interest.
The first generation of power analysis software tools emerged in the late 1970s and early 1980s, when computer software and programs mainly operated on DOS or UNIX platforms (Goldstein, 1989). Most of those tools were written in programming languages such as FORTRAN or Basic (e.g., POWERF, Parker & Borich, 1980) that are no longer used, and the primary distribution method was via mailing physical copies. Today, very few of these programs are still available.
In subsequent decades, as WIMP (windows, icons, menus, pointer) programs became dominant (Hinckley, 1996), power analysis software tools moved from Command-Line Interfaces (CLI) to Graphical User Interfaces (GUI; e.g., Power & Effect, Meyer, 1995). In 1992, Erdfelder, Faul, and Buchner released GPOWER, a GUI computer program of which a revised version is the most well-known and widely used power analysis software (G*Power 3, Faul, Erdfelder, Lang, & Buchner, 2007; 29,680 citations in Google Scholar, as of June, 2020).
However, there are several alternative software tools for conducting power analysis, of which HFE specialists may not be aware, that have various model coverage or utilities. Commercial and professional statistical analysis packages have implemented various procedures or features to conduct a priori power analysis (e.g., the POWER procedure in SAS/STAT [SAS Institute Inc., 2018]; the Power and Sample Size Tools in Minitab [Minitab, LLC, 2020]). Moreover, there are many software tools specialized for power analysis, some of which are freely available to the academic community (e.g., PowerUp!, Dong & Maynard, 2013; simr, Green & MacLeod, 2016; MorePower, Campbell & Thompson, 2012) and some of which require a fee (e.g., Power and Precision, Harrison, 2002; PASS, 2020).
User-Centered Design Perspective in Power Analysis
Despite the many software tools available to researchers, studies with low power are still common in many areas of investigation, including HFE (Bakker, van Dijk, & Wicherts, 2012; Kaptein & Robertson, 2012). Prior research suggests that power analysis is not routinely performed by researchers, or is done incorrectly (e.g., Gigerenzer, 2018). Because software tools are virtually essential for conducting power analyses, one limiting factor is likely the functionality (ability to accomplish the desired goal) and usability (ease with which the goal can be achieved) of such tools. If researchers can be assisted in finding tools that best fit their purposes and are easy for them to use, the use of power analysis in HFE should become more widespread and properly performed.
To improve the use and adoption of power analysis software in the scientific community, we can find inspiration from the perspective of UCD. Norman defines the concept of UCD (or Human-Centered Design) as “the process of ensuring that people’s needs are met, that the resulting product is understandable and usable, that it accomplishes the desired tasks” (Norman, 2013; p. 209). Today, this design framework is widely adopted by researchers and practitioners in Human-Computer Interaction and interface design. The mindset of centering on users’ wants and needs can also be used as an analytical lens for examining the relationship between the needs of researchers and the characteristics of available power analysis software tools.
FUNCTIONAL CRITERIA AND USABILITY HEURISTICS FOR IDENTIFYING A PROPER POWER ANALYSIS SOFTWARE TOOL
With the perspective of UCD, we can examine potential solutions to aid researchers in making better decisions when choosing power analysis software tools for their research. Researchers often seek information by typing keywords such as “power analysis program” into online search engines such as Google and navigating through the search results (Rowlands et al., 2008). However, the search results can be mixed and contain irrelevant information, which may overwhelm the researchers before they finally locate a proper solution. Thus, we focus on how to identify a proper power analysis software tool for a given study and assist researchers in navigating through this process.
To assist such a decision process, based on the current state of these tools and on users’ wants and needs, in line with concept of UCD, we propose five considerations for researchers when selecting a power analysis tool. These considerations are classified based on their characteristics and priorities within the decision process. The two functional criteria are the software input and software output of the tools, and the three usability heuristics are learnability, ease of use, and accessibility (Table 1).
Table 1.
The two functional criteria and three usability heuristics for researchers to identify a proper power analysis software tool.
| Label | Description | |
|---|---|---|
| Functional Criteria | Software input | The statistical models and tests that can be input to the software tool |
| Software output | The statistical results and other information that can be output from the software tools | |
| Usability Heuristics | Learnability | The ease with which the user can learn the software tool |
| Ease of use | The ease with which the user who has learned the tool can perform the analysis task | |
| Accessibility | The ease with which the user can obtain the software tool | |
Functional Criteria
In a system linking humans and computers, the user provides input to the computer and receives output from the computer. By identifying the constraints imposed by the input and output requirements, researchers can efficiently scale down their search by filtering out software tools that do not satisfy the given criteria.
Software input: Does the software tool support the user-specified model?
The user has to specify the statistical model that will be utilized for the analysis and its corresponding tests before conducting an a priori power analysis. It is crucial to perform an analysis with software tools that have adequate capacity; incorrect model specification will result in imprecise or misleading sample size estimates.
Existing software tools vary widely in their model coverage. Software tools developed based on closed-form formulas that can mathematically calculate exact values based on input parameters tend to have relatively fixed coverage (e.g., Campbell & Thompson, 2012). Some software also provides incomplete support for particular models, in which case use of the software is not recommended. For instance, although G*Power supports estimation of individual omnibus parameters for an analysis of variance (ANOVA), it cannot estimate simple effects. On the other hand, some software tools allow users to program all of the input of the analysis themselves using a CLI. Many software tools that utilize a simulation-based method for estimating power use CLI and tend to be more flexible.
Software output: Does the software tool output the required information?
If the output a software tool provides does not match what is required for the planned study, then this tool should not be considered. Yet, it is possible that software tools may support the required statistical models but not be able to generate the desired output. For instance, a researcher may want to determine a priori the power offered by a certain sample size before a study is conducted. In that case, software that only reports post hoc power required actual data will not be useful. An additional critical consideration is the accuracy of the output. Limited information is currently available about the accuracy of existing tools, but software that reports incorrect estimates will not be useful to the user.
Plots and diagrams can be also useful for interpreting the results (e.g., sensitivity analysis, see Lane & Hennes, 2019). For example, if a researcher wants to draw a group of power curves to investigate the trade-off between numbers of stimuli and repeated measures for a given study, tools that do not support graph functions will not be ideal.
Usability Heuristics
In addition to the functional criteria, the three usability heuristics are considerations that differ in importance depending on the user. Researchers should examine the tradeoffs and associations between each of them accordingly.
Learnability: How easy is it for the user to learn the software tool?
The heuristic “learnability” in this section refers to the ease with which users can learn to accomplish particular goals with the software (i.e., “learnability” factor in Seffah, Donyaee, Kline, & Padda, 2006). Conducting a research project is complex. Researchers have to weigh the cost and gain for each action and prioritize their time, effort, and monetary investments to gain the best outcome. For a task like conducting an a priori power analysis, from a researcher’s perspective, time and effort are the cost, and the informativeness of the power analysis is the gain. The level of difficulty is a significant factor for researchers when assessing whether learning a new tool is worthwhile. If learning tool A requires substantially longer for a researcher than learning tool B, tool B will seem more attractive to the researcher.
The difficulty of learning can come from various sources (see Grossman, Fitzmaurice, & Attar, 2009). For power analysis software tools, such difficulty can be the steps required to correctly navigate and execute the interface operations (e.g., choosing appropriate options and model specification), or, alternatively, to generate and compile simulation syntax that accurately reflects the intended study design and analytic model. Note that learnability as it relates to software tools is distinct from learning fundamental statistical knowledge. These skills should be prerequisites for researchers, not specific to power analysis tools.
Ease of use: How easy is it for the user to perform the analysis tasks?
The heuristic “ease of use” in this section refers to the clarity and naturalness of the interactions required to execute a task (i.e., “effectiveness” factor in Seffah et al., 2006). In the following section, we develop our discussions on this heuristic as it applies to two primary interfaces employed by many power analyses tools: GUI and CLI. Many power analysis software tools are adopting graphical interfaces. These GUI programs are mostly stand-alone packages that can be executed on a computer platform individually, though some of them are websites or apps that allow users to calculate power online (e.g., Power and Sample Size.com; HyLown Consulting LLC, 2013). Primary advantages of GUI software are the more intuitive control and operations with immediate feedback from the system. But, since GUI software uses visual elements to represent objects or commands, the interactions are mainly shaped by the input components such as menus and buttons. There is not much flexibility for users to modify the models and specifications.
Power analysis tools with CLI have to be controlled through commands or scripts; programming skills are required to execute those operations successfully. CLI software tools were more dominant in the 1970s and 1980s, but CLI is still used for many tools and packages built on computational languages such as R and Python. Primary disadvantages of CLI software tools are low visibility of system status and the upfront work to set up the development environment. Even for experienced users, to write up the script from scratch can take a significant amount of time and effort.
Additionally, there are tools that use both methods by allowing users to use an interactive control panel (GUI) and power commands (CLI) for computing statistical power and sample size. This hybrid approach, which is adopted by several commercial software packages such as Stata and JMP, has the advantages of both interface types.
Another factor is the availability of additional resources. Software tools with various available tutorials and a large learning community are more usable than ones without. Even though both learnability and ease of use are frequently characterized as two of the factors for usability (see Seffah et al., 2006), they seldom are entirely independent and sometimes will demonstrate positive correlations. However, the correlation is not perfect, and the two may dissociate when people use certain power analysis tools. For instance, both MPlus and simr are comparatively difficult to learn. However, for example, once the MPlus syntax is learned, performing power analysis is relatively straightforward using examples provided by the MPlus manual, website, and online forums. In contrast, after learning the required syntax for the simr package in R, performing power analysis still requires writing simulation codes, which many users will find to be difficult.
Accessibility: How easy is it for the user to obtain the software tool?
The primary accessibility consideration for a power analysis software tool is its price. There are other types of accessibility such as internet connection and distribution methods of the software. However, currently most resources can be accessed online and remotely, so here we mainly focus on the price of the software tools.
Some tools can be accessed or requested without any cost. There are tools such as R packages that are open-source and allow modification under the corresponding copyright license. There are also standalone tools like G*Power that are free to use. However, long-term maintenance and customer support might be issues for unpaid or unfunded development teams. Other tools are commercialized and require payment to access. There are general purpose statistical software tools such as SAS/STAT and Stata, which provide specific procedures or commands for a priori power analysis. Also, there are tools specifically designed for power analysis such as PASS and nQuery. Most software tools developed for scientific purposes are expensive. For example, a business single-user license for Stata/SE is $765 per year and a singleuser non-expiring license for PASS 2020 is $1695 (as of June 2020). Overall, paid tools tend to support more statistical models and have more sophisticated manuals and instructions.
DECISION-AIDING PROCESS FOR IDENTIFIYING PROPER POWER ANALYSIS SOFTWARE TOOLS
To incorporate the user-centered considerations into a structure that is easy for researchers to use, the proposed criteria and heuristics need to be formulized. However, there are many uncertainties and unconstrained conditions when researchers engage with this decision process. In the practice of decision-aiding, the user may not have clear ideas about identification of the problem space. Therefore, instead of adopting a formal decision-making model that identifies a fixed problem formulation, a constructive approach can be applied: The problems and solutions within the decision process will be interactively constructed throughout the process by the researcher themselves (see Tsoukiàs, 2008). Thus, we propose a flexible decision-aiding process constructed as a workflow with a series of questions that can aid researchers to explore and reflect their wants and needs, yet still leave enough flexibility for practical use.
We summarize the proposed criteria and heuristics in a workflow. As depicted in Figure 1, these considerations are transferred into five questions. From top to bottom, the users will ask themselves these questions during the decision process. The subset of software tools that satisfy the two functional criteria will provide a candidate pool, and candidates in the pool then can be assessed by the three usability heuristics to find a balance between considerations candidates before reaching a final decision.
Figure 1.
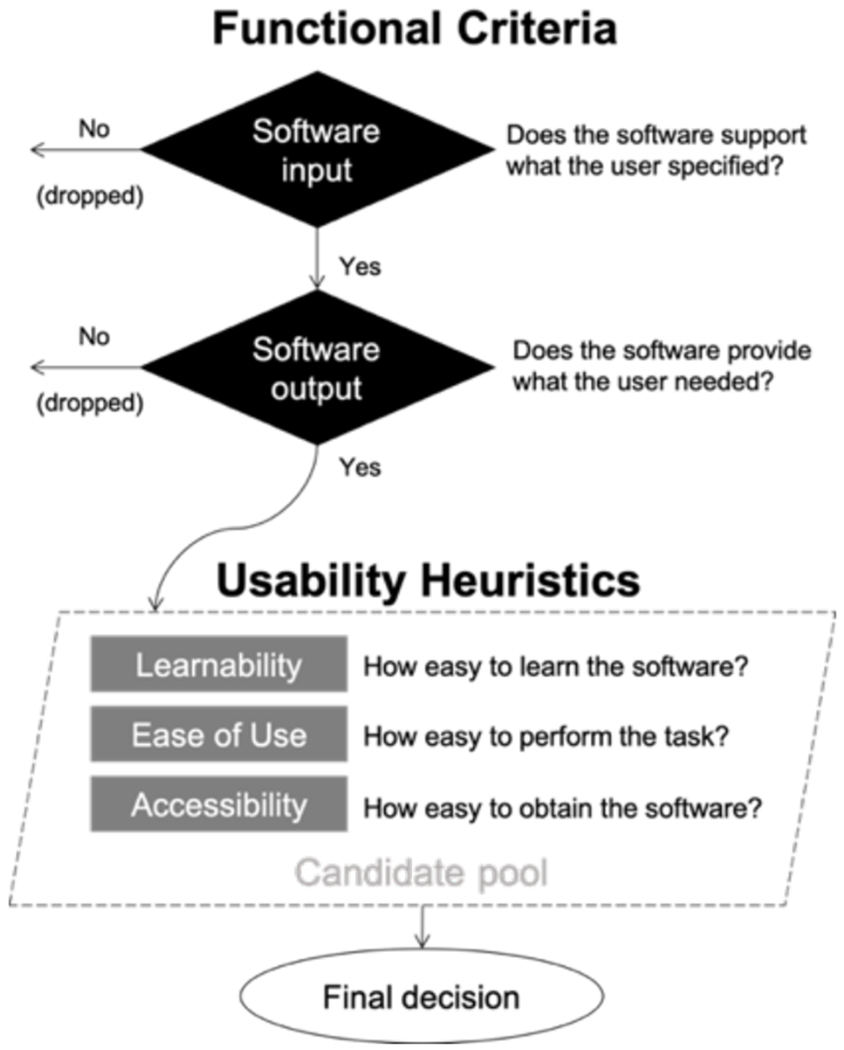
Workflow that aids the decision process of selecting a proper power analysis software tool.
Note that identifying a proper software tool for researchers is a situated and subjective decision process. Depending on an individual’s requirements (e.g., statistical model, budget constraint) and prior experience (e.g., training in statistics or computer programming), it is possible that at the end no candidate in the pool satisfies the specified criteria. In that case, the researcher will need to adjust their requirements or explore other possibilities by relaxing some of the initial constraints.
Examples of Identifying a Power Analysis Tool Using the Proposed Process
We describe three artificial scenarios to demonstrate how to use the proposed decision-aiding process, each of which has descriptions of the user and the tasks. The narratives of how the decisions are made will be described as well.
Scenario 1 – 2-level Factorial Design.
A graduate student has to conduct a 2 x 2 factorial design experiment as a class assignment. They are interested in the interaction effect of factors A and B and want to estimate the total sample size for 80% power. Based on the supported models, tools that do not support factorial ANOVA will be filtered out. For the required output, what they need is the sample size, which is provided by most tools. So, many options still remain.
For ease of learning and using the software tools, because this graduate researcher is not familiar with programming languages, CLI tools are ruled out (e.g., R packages). Also, they want to use tutorials or manuals for reference, so options with more training materials are preferred. As an individual project without funding support, the paid software tools are not ideal and therefore are ruled out as well (e.g., PASS). At the end, G*Power 3 is selected.
Scenario 2 – Structural Equation Modeling (SEM).
A PhD student wants to conduct SEM for an instrument development project. With pilot data, they want to estimate the a priori power before collecting the field test survey data. In this case, tools that do not support latent variable models fail to satisfy this criterion (e.g., PASS). Also, because output of model-fit statistics is required for evaluating the models, many candidates are filtered out.
Because this PhD student has some experience in R, either GUI or CLI tools are options. However, since the research lab does not have the budget to purchase additional statistical packages, paid software tools are not ideal and thus are ruled out, leaving only the free R packages. At the end, the R packages lavaan and simsem are identified as the primary tools since they are free to use and are relatively developed compared to other candidates.This PhD student will have to spend some time to practice R programming.
Scenario 3 – Multilevel Modeling (MLM).
A professor has to write a grant proposal that includes a longitudinal study requiring MLM analysis. They instruct one of their research assistants to conduct a sensitivity analysis, which needs to be completed within a week due to the grant proposal deadline.
Because MLM is a complex model, only a small group of software tools satisfy this criterion, and most of the candidates are CLI tools. Fortunately, the research assistant has taken several statistics courses and is quite comfortable with programming. As the research lab has purchased an MPlus license on a lab computer, both R packages and MPlus are feasible. Because the example MLM codes provided by MPlus can increase the efficiency of performing power analysis, MPlus is chosen because of the time constraint.
DISCUSSION
The primary contribution of this paper is to provide a systematic organization that can assist a user in going through the process of identifying power analysis software tools. It is worth noting that using a suitable power analysis tool is only a starting point; correctly performing an analysis requires more than a tool. Sufficient statistical expertise and knowledge of experimental design are essential, as are domain expertise on how to transfer research questions into meaningful experiments and the expected magnitude of effects. Still, by selecting a proper software tool to perform the analysis, researchers will be able to improve the likelihood of designing experiments with appropriate statistical power.
A limitation of this article is that even for researchers who employ the proposed decision-aiding process, some tools may still be difficult to find. Thus, a next step in helping researchers locate appropriate power analysis tools is to survey currently available tools and establish a directory, after which we may be able to implement the proposed decision-aiding process into an interactive system. The system will benefit researchers in their searches to identify power analysis software tools that fit their needs, saving their time and effort when doing research.
ACKNOWLEDGMENT
Preparation of this paper was supported in part by a grant from the National Institute on Alcohol Abuse and Alcoholism, Project Number 1R01AA027264-01.
REFERENCES
- Bakeman R, & McArthur D (1999). Determining the power of multiple regression analyses both with and without repeated measures. Behavior Research Methods, Instruments & Computers, 31, 150–154. [DOI] [PubMed] [Google Scholar]
- Bakker M, Hartgerink CHJ, Wicherts JM, & van der Maas HLJ (2016). Researchers’ intuitions about power in psychological research. Psychological Science, 27, 1069–1077. [DOI] [PMC free article] [PubMed] [Google Scholar]
- Bakker M, van Dijk A, & Wicherts JM (2012). The rules of the game called psychological science. Perspectives on Psychological Science, 7, 543–554. [DOI] [PubMed] [Google Scholar]
- Campbell JID, & Thompson VA (2012). MorePower 60 for ANOVA with relational confidence intervals and Bayesian analysis. Behavior Research Methods, 44, 1255–1265. [DOI] [PubMed] [Google Scholar]
- Cohen J (1988). Statistical power analysis for the behavioral sciences (2nd ed). Hillsdale, NJ: Erlbaum. [Google Scholar]
- Cohen J (1992). A power primer. Psychological Bulletin, 112, 155–159. [DOI] [PubMed] [Google Scholar]
- Dong N, & Maynard R (2013). PowerUp! : A tool for calculating minimum detectable effect sizes and minimum required sample sizes for experimental and quasi-experimental design studies. Journal of Research on Educational Effectiveness, 6, 24–67. [Google Scholar]
- Faul F, Erdfelder E, Lang A-G, & Buchner A (2007). GPower 3: A flexible statistical power analysis program for the social, behavioral, and biomedical sciences. Behavior Research Methods, 39, 175–191. [DOI] [PubMed] [Google Scholar]
- Gigerenzer G (2018). Statistical rituals: The replication delusion and how we got there. Advances in Methods and Practices in Psychological Science, 1, 198–218. [Google Scholar]
- Goldstein R (1989). Power and sample size via MS/PC-DOS Computers. The American Statistician, 43, 253–260. [Google Scholar]
- Green P, & MacLeod CJ (2016). SIMR : An R package for power analysis of generalized linear mixed models by simulation. Methods in Ecology and Evolution, 7, 493–498. [Google Scholar]
- Grossman T, Fitzmaurice G, & Attar R (2009). A survey of software learnability: Metrics, methodologies and guidelines. In Proceedings of the SIGCHI Conference on Human Factors in Computing Systems (pp. 649–658). [Google Scholar]
- Harrison W (2002). Power and precision: A computer program for statistical power analysis and confidence intervals. Personnel Psychology, 55, 1077–1080. [Google Scholar]
- Hinckley K (1996). Haptic Issues for Virtual Manipulation. Retrieved from https://www.microsoft.com/en-us/research/publication/haptic-issues-virtual-manipulation/
- HyLown Consulting LLC. (2013, 2020). Power and Sample Size.com. Retrieved February 14, 2020, from Power and Sample Size | Free Online Calculators website: http://powerandsamplesize.com/
- Kaptein M, & Robertson J (2012, May). Rethinking statistical analysis methods for CHI. In Proceedings of the SIGCHI Conference on Human Factors in Computing Systems (pp. 1105–1114).. [Google Scholar]
- Lane SP, & Hennes EP (2019). Conducting sensitivity analyses to identify and buffer power vulnerabilities in studies examining substance use over time. Addictive Behaviors, 94, 117–123. [DOI] [PMC free article] [PubMed] [Google Scholar]
- Meyer GE (1995). Power & Effect: A statistical utility for Macintosh and Windows systems. Behavior Research Methods, Instruments & Computers, 27, 134–138. [Google Scholar]
- Minitab, LLC. (2020). Minitab® Statistical Software (Version 19). State College, PA, USA: Minitab, LLC. [Google Scholar]
- Norman D (2013). The design of everyday things (Revised ed.). New York, NY: Basic Books. [Google Scholar]
- Parker R, & Borich G (1980). POWERF: A program that computes the power of F tests in fixed-effects ANOVA designs. Behavior Research Methods & Instrumentation, 12, 76–76. [Google Scholar]
- PASS. (2020). Power Analysis and Sample Size Software (2020). NCSS, LLC. Kaysville, Utah, USA, [Google Scholar]
- Peng C-YJ, Long H, & Abaci S (2012). Power analysis software for educational researchers. Journal of Experimental Education, 80, 113–136. [Google Scholar]
- Rowlands I, Nicholas D, Williams P, Huntington P, Fieldhouse M, Gunter B, … Tenopir C (2008). The Google generation: The information behaviour of the researcher of the future. Aslib Proceedings, 60, 290–310. [Google Scholar]
- SAS Institute Inc. (2018). The POWER Procedure. In SAS/STAT® 15.1 User’s Guide Cary, NC, USA: SAS Institute Inc. [Google Scholar]
- Seffah A, Donyaee M, Kline RB, & Padda HK (2006). Usability measurement and metrics: A consolidated model. Software Quality Journal, 14, 159–178. [Google Scholar]
- Thomas L, & Krebs CJ (1997). A review of statistical power analysis software. The Bulletin of the Ecological Society of America, 78, 126–139. [Google Scholar]
- Tsoukiàs A (2008). From decision theory to decision aiding methodology. European Journal of Operational Research, 187, 138–161 . [Google Scholar]