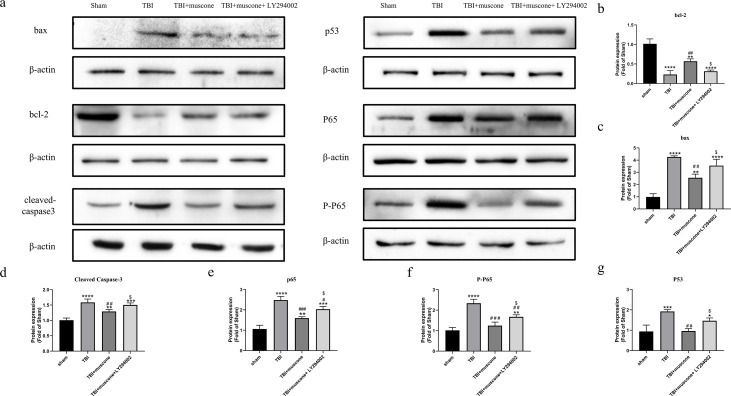
Figure 7. Effects of muscone on the bax, p53, BCL-2 and cleaved-caspase 3 expression and the NF-kB pathway.
(A) Immunoblot bands in involved groups were represented. (B–G) The bands’ intensity was shown as optical density analysis. Results were presented as mean ± SD. N = 3, each group, ∗P < 0.05, ∗∗P < 0.01, ∗∗∗P < 0.001, ∗∗∗∗P < 0.0001 vs sham group; #p < 0.05, ##p lt0.01, ###p < 0.001 vs TBI group; p < 0.05 vs TBI+muscone group.

