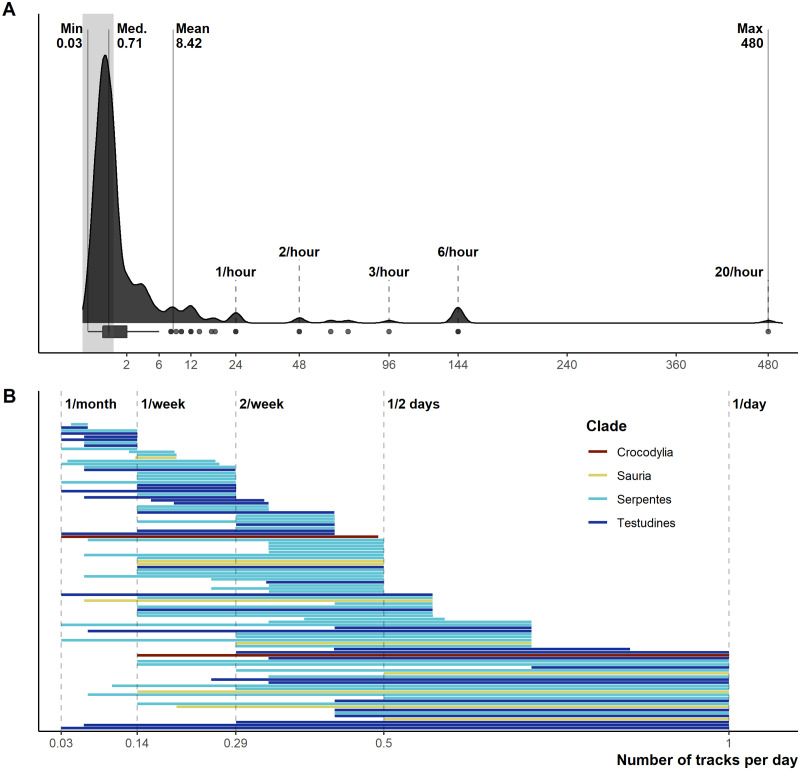
Figure 1. Reported number of tracks per day.
(A) Density and boxplot plot showing the distribution of all reported tracking frequencies (minimums and maximums), x-axis is square-root transformed. Shaded grey area highlights instances of <1 track per day. Text labels show the minimum, median, mean, and max numbers of tracks per day. (B) The variation per study between the maximum and minimum tracking frequencies, provided both are <1 per day. Both plots exclude all unreported tracking frequencies.

