

Abstract
We are developing magnetic nanoparticle (NP) methods to characterize inflammation and infection in vivo. Peritoneal infection in C57BL/6 mice was used as a biological model. An intraperitoneal NP injection was followed by measurement of magnetic nanoparticle spectroscopy of Brownian rotation (MSB) spectra taken over time. MSB measures the magnetization of NPs in a low frequency alternating magnetic field. Two groups of three mice were studied; each group had two infected mice and one control with no infection. The raw MSB signal was compared with two derived metrics: the NP relaxation time and number of NPs present in the sensitive volume of the receive coil. A four compartment dynamic model was used to relate those physical properties to the relevant biological processes including phagocytic activity and migration. The relaxation time increased over time for all of the mice as the NPs were absorbed. The NP number decreased over time as the NPs were cleared from the sensitive volume of the receive coil. The composite p-values for all three rate constants were significant: raw signal, 0.0002, relaxation, <10−16 and local NP clearance, <10−16. However, not all the individual mice had significant changes: Only half the infected mice had significantly different rate constants for raw signal reduction. All infected mice had significantly smaller relaxation time constants. All but one of the infected mice had significantly lower rate constants for local clearance. Relaxation is affected by both phagocytic activity, edema and temperature changes and it should be possible to better isolate those effects to more completely characterize inflammation using more advanced MSB methods. The MSB NP signal can be used to identify inflammation in vivo because it has the unique ability to monitor phagocytic absorption through relaxation measurements.
Keywords: inflammation quantification, infection identification, magnetic nanoparticle spectroscopy of Brownian rotation motion
1. Introduction
Inflammation is an upregulation of the innate immune system and is a general protective response. It is a vital, normal response for many common conditions: e.g. fighting pathogens like bacteria and initiating wound healing. However, when not properly regulated, inflammation contributes to a host of diseases and pathologic conditions: e.g. multiple sclerosis, asthma, rheumatoid arthritis, chronic pain, depression, atherosclerosis and heart/vascular disease. We need to understand inflammation better and, to that end, we need better ways of characterizing it.
We are exploring quantitative characterization of inflammation using novel nanoparticle (NP) technology, magnetic nanoparticle spectroscopy of Brownian rotational motion (MSB). Phagocytosis is one of the critical functions of the innate immune response and inflammation. It is the primary mechanism of absorption and clearance of foreign material, dead cells, and bacteria. Another characteristic of inflammation is local or global temperature increases as the local circulation and metabolic activity increases to fight invasions. Both phagocytosis and temperature changes impact the MSB signal.
MSB measures the magnetization generated by magnetic NPs in an alternating magnetic field. Nonlinearities in the NPs’ response to the magnetic field produce signal at the harmonic frequencies. High sensitivity is achieved by measuring the harmonics which are at frequencies where there are no other signals. The sensitivity is sufficient to measure the NPs remotely at very low concentrations, one picogram in a one liter volume (Knopp and Buzug 2012).
MSB is capable of quantifying both a) phagocytic uptake, by measuring changes in the relaxation time and b) local clearance, the speed with which NPs are removed from the sensitive volume of the receive coil. Measuring the change in the rotational freedom is a unique capability that reflects NP absorption by a phagocytic cell or a change in extracellular fluid composition like edema.
MSB has been used to quantify in vitro cell uptake of magnetic NPs (Giustini et al 2012, Poller et al 2016) so phagocytic uptake in vivo should also impact the spectra. Further, the NP number and relaxation can be independently calculated (Weaver and Kuehlert 2012, Weaver et al 2013) allowing us to estimate the local clearance of NPs from the volume of the pickup coil. However, temperature changes complicate that process (Weaver et al 2009).
In this preliminary effort, we used mice with peritoneal infection as a model system for inflammation and no infection as the control without inflammation. The NP relaxation (Weaver and Kuehlert 2012) and the number of NPs present within the pickup coil volume were calculated using previously described methods (Weaver et al 2013).
2. Methods
2.1. MSB spectrometer
We used an animal spectrometer described previously (Khurshid et al 2018) that uses a ‘perpendicular’ geometry. Our earlier spectrometers, like most other group’s spectrometers, used an ‘in-line’ geometry where the nanoparticle magnetization was measured in the direction of the applied field so the magnetization appears in the odd harmonics. In our more recent work, we have used a ‘perpendicular’ geometry where a small static field perpendicular to the alternating field produces a magnetization with even harmonics in the direction of the static field. Perpendicular geometry helps decouple the magnetization from the applied field without distorting the signal with filters (Reeves and Weaver 2014).
2.2. Inflammation animal model
Two groups of three C57BL/6 mice (Charles River Laboratories, Inc., Wilmington, MA) were used. Two of three received an intraperitoneal injection of 500 µl PBS with a sublethal dose of P. aeruginosa bacteria (PA01WT 2 × 10⁶) and one was injected with 500 µl of PBS as the control. Two hours incubation produced a low-grade infection prior to an intraperitoneal injection of 2 mg (200 µl) of 100 nm diameter, non-functionalized, BNF-starch, iron-oxide nanoparticles (Micromod Partikeltechnologie GmbH Friedrich-Barnewitz-Str.4 D-18119 Rostock, Germany).
The anesthetized mice were positioned on their sides in the MSB spectrometer so that the peritoneal injection site was centered in the receive coil. An MSB spectrum was immediately measured following injection of nanoparticles and every 20 to 30 min following till no appreciable signal remained. Each spectrum consisted of the 2nd and 4th harmonics at 214.6 Hz, 524.4 Hz, 706.0 Hz, 782.9 Hz, and 1025.6 Hz.
All experiments were performed under the protocol approved by the Dartmouth College Institutional Animal Care and Use Committee and euthanasia was consistent with the recommendations of the American Veterinary Medical Association (AVMA) Guidelines for the Euthanasia of Animals.
2.3. Analysis
The effective relaxation time can be found for each spectrum using scaling arguments (Weaver and Kuehlert 2012). The magnetization is a function of the product of the relaxation time and the frequency so the relaxation can be estimated by estimating how much the frequency needs to be scaled to match the spectra to a reference spectra (Weaver et al 2009, Weaver and Kuehlert 2012). When the relaxation time is increased, the frequency can be decreased to produce an identical spectra because the product is identical. The amount the frequency would be increased was estimated by interpolation. Once the relaxation time is known, the number of NPs contributing to the signal can be found by correcting the individual MSB harmonics for relaxation (Weaver and Kuehlert 2012, Weaver et al 2013). Thus, a relaxation time and NP weight within the sensitive volume of the receive coil are obtained at each spectrum measured.
2.4. Dynamic model
The relaxation time and number of NPs present are physical parameters that can be interpreted with a dynamic model to describe the biology with absorption and the clearance rate constants. The model also provides a more nuanced physical understanding of the processes involved.
We modeled the system with rate equations for a four compartment model. Two of the compartments are within the sensitive volume of the receive coil and, therefore, contribute to the signal: the free NPs injected into the peritoneum and NP that are absorbed by phagocytic cells. Two compartments are necessary because the MSB signal is different for NPs outside and within cells and because the mechanisms by which they are removed from the sensitive volume have different time constants: free NPs passively diffuse through the tissue to exit the sensitive volume and NP in phagocytic cells migrate out of the sensitive volume of the receive coil. The radius of the receive coil is 5 mm so the sensitive volume is roughly a half sphere with 5 mm radius. The remaining two compartments are outside the sensitive volume of the receive coil and, therefore, do not contribute to the signal. The four compartments and the time constants for movement between them are shown in figure 1.
Figure 1.

The model used for the NP signal used four compartments: free NPs in the coil volume, NPs absorbed into phagocytic cells within the coil volume, NPs absorbed into phagocytic cells that migrated out of the coil volume and free NPs that passively diffused out of the coil volume.
We used a zero order model because the probability of a change in state is dominated by factors other than the number of NPs in that state. For example, the rate limiting step in phagocytic absorption of NPs is the number and activity of the phagocytic cells rather than the number of NPs present. Similarly, diffusion is limited by the area of the free passages and cell migration by cytokine signaling. A zero order model is adequate for the data we measured:
| (1) |
Figure 1 diagrams the model and provides variable names: F is the number of NPs in the free state; A is the number in the absorbed state; ka is the rate constant for the transition from the free to absorbed states; kd is the rate constant for free NPs diffusing out of the sensitive volume of the pickup coil; km is the rate constant for active migration of phagocytic cells out of the sensitive volume of the pickup coil. F and A can be found from equation (1):
| (2) |
The total number of NPs in the sensitive volume of the receive coil is a linear function of time with slope:
| (3) |
Equation (3) provides an expression for the rate constant for the local clearance of NPs from the volume of the receive coil: [kd + km].
The relaxation time constant is more complicated and requires approximations. The effective relaxation for a combination of NPs in the free and absorbed states is slightly more complicated but is approximately the weighted average of the relaxation for the two states:
| (4) |
where τc is the effective relaxation time for the combination of NPs in both the free and absorbed states, and τf and τa are the relaxation times for the free and absorbed states respectively. Equation (4) can be found by approximating the harmonic ratio with the first two terms in the power series in ωτ . Equation (4) is exact for the linear portion of the domain but are also reasonable in the nonlinear domain because only the cross terms in the powers of ωτ are missing. The relaxation time as an explicit function of time is:
| (5) |
Equation (5) provides the relative relaxation time. It is a smoothly varying function with a slight increase if the ratio of the relaxation times, τa/τ f, is greater than one. Equation (5) is a ratio of polynomials as is a Padé approximation and shares some of the Padé approximation’s flexibility and stability (Press et al 2007). With sufficient quality data all the rate constants can be found: τd for diffusion of free NPs, τa for NP absorption and τm for phagocytic cell migration. However, the rate phagocytic cells migrate is over hours and the migration rate in lymphatic system is in the single digit µm min−1 (Arokiasamy et al 2017) so km is generally small relative to ka. providing a linear approximation for small times where the slope is:
| (6) |
Equation (6) provides an expression for the relaxation time constant and indicates that most of the variation in the relaxation time constant is from differences in absorption because the initial number of NPs injected and the difference between the NP relaxation in the interstitial space and that in phagocytic cells are probably not highly variable. We will term equations (3) and (6) the local clearance and relative relaxation time constants, respectively, that are used below.
2.5. Biological factors that impact the model parameters
The clearance rate constant depends only on the rates of diffusion and cell migration. Edema is probably the most important factor for the rate of diffusion. Phagocytic cell migration is more complicate. Immune cells migrate to the source of inflammation but in general remain at the source once they get there. Therefore, the rate of phagocytic cell migration is high far from the source of inflammation but very low at the source of inflammation.
The relaxation time constant depends on both the difference in relaxation times and the rate of phagocytic absorption. Relaxation times depend on the temperature and possibly the phagocytic cell type absorbing the NPs. The rate of phagocytic absorption and the type of cell absorbing the NPs are characteristic of inflammation and should be important in identifying and characterizing inflammation. Local temperature increases are also characteristic of inflammation due to increased blood flow and increased metabolic activity. However, the two will tend to cancel each other in inflammation because increased temperature decreases τa and τ f while increased phagocytic absorption increases ka.
3. Results
The raw MSB spectra from an example mouse are shown in figure 2. The second harmonic summed over all frequencies is shown as a function of time in figure 3; it represents the bulk of the signal. The increase in relaxation time relative to the initial relaxation immediately following injection is shown as a function of time in figure 4. The relaxation corrected number of NPs contributing to the measured signal over time is shown in figure 5.
Figure 2.

The MSB spectra taken over time are plotted for the first infected mouse in the first group. The second harmonic spectrum drops over time for all frequencies as the NPs are removed from the sensitive volume of the receive coil. The harmonic ratios also drop over time at all frequencies indicating the relaxation time is also increasing. Loss of NPs from the volume of the receive coil and relaxation both contributed to the drop in raw signal.
Figure 3.

The harmonic signals summed over all frequencies drop over time from both clearance of NPs from the sensitive volume and increases in relaxation.
Figure 4.

The relative relaxation time increased over time for all mice. It increased more slowly for the infected mice in both groups. The relaxation times are relative to the relaxation of the NPs when first injected.
Figure 5.

The NP weight decreased over time for all mice. It decreased more slowly for the infected mice.
The rate constants were calculated from the least squares fits to a line as in the model. The rate constants are plotted in figures 6–8. The error bars are the standard deviations calculated from the linear fits to the MSB data so biological variation and instrument variation are both included. The p-values listed in table 1 provide the significance of the differences between the rate constants. The same pattern held for the first-order rate equations where the change in relaxation and clearance is exponential rather than linear.
Figure 6.
Decay constants for the second harmonic summed over frequency.
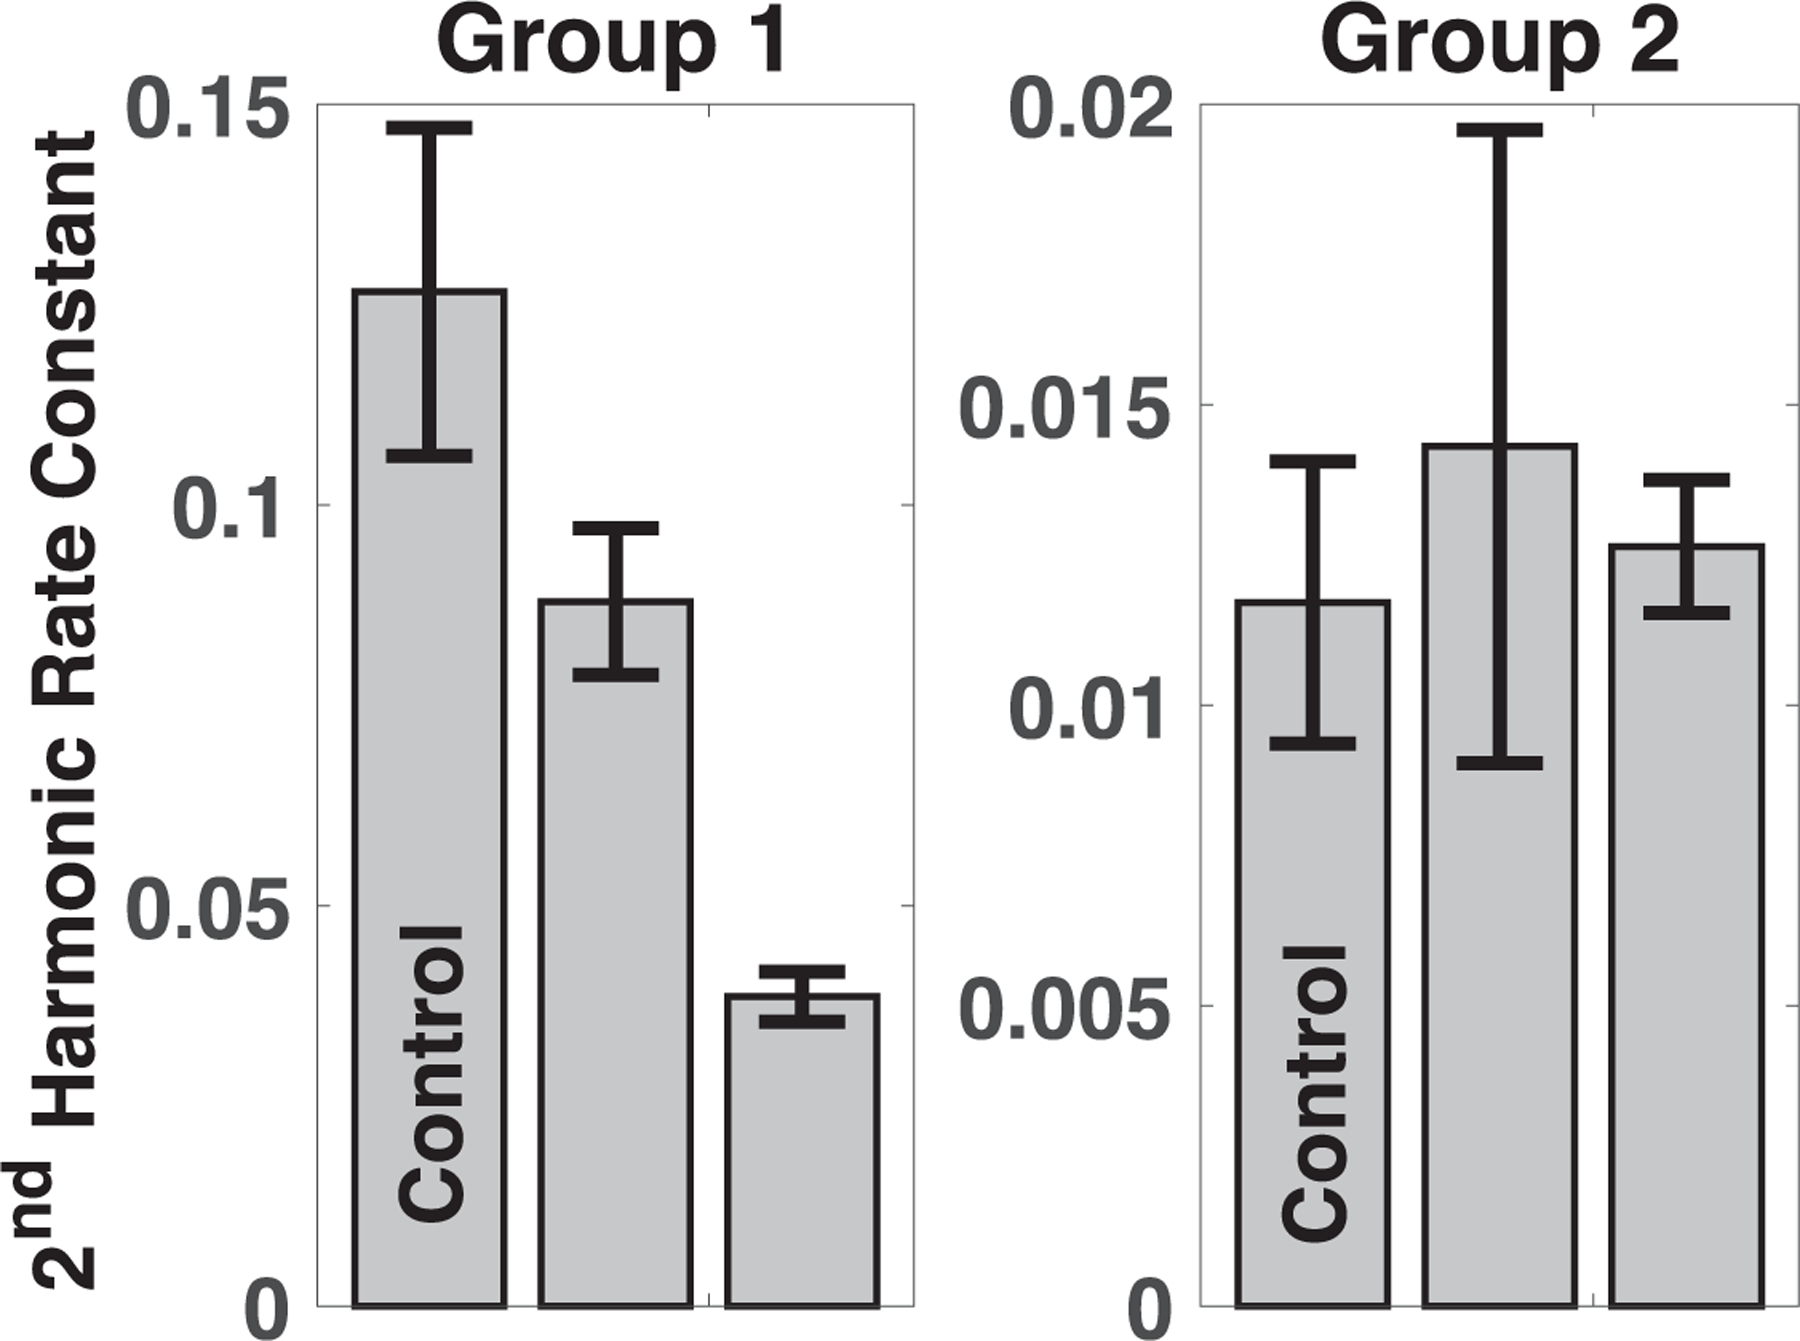
Figure 8.

Decay constants for the NP clearance. The NP weight can be compared to the raw second harmonics to evaluate the impact of relaxation.
Table 1.
Significance of the rate constants for the raw signal, relaxation and local clearance for each of the four infected mice compared to the uninfected control, the combined significance, and percentage of infected mice with significant difference. The p-value that was less than the computational precision of the calculation, 10–16, was listed as the computational precision.
| Infected mouse 1 | Infected mouse 2 | Infected mouse 1 | Infected mouse 2 | |
|---|---|---|---|---|
| p-values | group 1 | group 1 | group 2 | group 2 |
| Raw signal rate constant | 0.012 | <10−10 | 0.508 | 0.583 |
| Relaxation time constant | <10−4 | <10−15 | <10−10 | <10−8 |
| Local clearance rate constant | <10−9 | <10−16 | 0.789 | 0.006 |
The two groups were analyzed separately by computing the p-values for each group. The p-values for the two groups were then combined using Stouffer’s method (Stouffer et al 1949). This approach was necessitated primarily because the NPs used had very different magnetic characteristics. Although the same type of NP was used, they came from different batches and had shelf lives resulting in different size distributions. In addition, the apparatus was modified between groups to reduce the feedthrough signal. Feedthrough is nonlinear on the ratios of the harmonics because it is added to both numerator and denominator of the ratio.
We verified that the NPs were cleared from the volume around the injection site in the peritoneum by confirming that the signal from the liver and spleen increased at the end of the experiment.
The composite p-values obtained by combining the p-values for each group (shown in table 2) were significant for all three metrics but were far more significant for the relaxation and local clearance rate constants. The percentage of mice where significance was achieved, given in table 2, approximates the usefulness of the metric for identifying inflammation in individuals.
Table 2.
Significance of the rate constants for the raw signal, relaxation and local clearance for the four infected mice compared to the uninfected control and the combined significance of each metric explored. The two p-values that were less than the computational precision of the calculation, 10–16, were listed as the computational precision.
| Raw signal rate constant | Relaxation time constant | Local clearance rate constant | |
|---|---|---|---|
| Percentage of infected mice with significant changes | 50% (2) | 100% (4) | 75% (3) |
| Combined significance | 0.0002 | <10−16 | <10−16 |
4. Discussion
The composite results showed inflammation produced significantly different MSB results for all three metrics suggesting they all reflect inflammation. The relaxation time constant was significant for all mice and so is the most useful metric, local clearance is also useful but less consistent and the raw signal is only significant half the time. Therefore, the data suggests the relaxation time constant is the best metric for identifying inflammation in individuals.
A number of biological effects associated with inflammation impact the physical metrics in complex ways and it is important to understand the links. Phagocytic uptake is relatively simple; increased phagocytic uptake is reflected in the absorption rate constant ka. Edema is slightly more complicated; edema should increase NP diffusion increasing kd thus increasing the local clearance. Edema should also drop the relaxation time of free NPs, τ f, increasing the absorption rate constant. Increased local temperature reduces both relaxation times as well as their difference, (τa − τ f), reducing the absorption rate constant. Therefore, increased phagocytic uptake and increased local temperature tend to cancel each other in their influence on the absorption rate constant.
There are also biological variables associated with inflammation but are not consistent because the immune system is complicated with many balancing influences. For example, phagocytic cell mobility is variable and there are many types of phagocytic cells. Mobility, characterized by km in the model, will depend on where the injection is made relative to the site of inflammation; phagocytic cells tend to migrate toward the site of inflammation but most will remain in that area once they arrive at the site of inflammation except for antigen-presenting cells such as dendritic cells that migrate from the site of inflammation to the lymph system. Further complicating the situation, there are many types of phagocytes. Different types of phagocytes might absorb NPs at different rates, ka, into vesicles with different relaxation times, τa, and migrate at different speeds, km.
MSB provides the important and unique ability to monitor phagocytic uptake directly (Giustini et al 2012, Poller et al 2016) and open the ability to quantitate those parameters. There are no other ways to measure phagocytic uptake at depth in vivo. Perhaps the best known example of the importance of phagocytes is macrophage populations and activity. For example, some of the most exciting cancer therapies are based on manipulating macrophage phase transitions. Macrophages are roughly divided into two phases or broad groups: M1 which generally attack foreign agents and infections and M2 which generally repair wounds and damaged tissues. Macrophages transition between phases and the transition is based on changing environmental signals. Moreover, the macrophage population is more complex than two states. Recently it has been shown that some macrophages are resident in a specific tissue since birth and others are recruited from white blood cells (Shapouri-Moghaddam et al 2018). In addition, the M2 population can be divided into at least four different classes with different cell surface markers, different functions and different activation mechanisms (Shapouri-Moghaddam et al 2018).
The complexity of the biology is apparent in the results of this study. Most notably, the relaxation time constant decreased with inflammation which was not expected. We expected increased phagocytic uptake to dominate other effects and drive the relaxation time constants up during inflammation. There are several possible explanations: The local temperature, although unlikely in mice where the temperature generally drops with infection, increase could have been more influential than the increase in phagocytic absorption. The phagocytes might have either been too busy absorbing bacteria to absorb NPs as swiftly. Alternatively, the phagocytes might become too targeted to bacteria to absorb the NPs as swiftly. Another alternative is the NPs might be absorbed into high viscosity mucosal material without inflammation and into phagocytic cells during inflammation. The ambiguity could be reduced by extracting more physical parameters from the MSB data but cannot be resolved using the existing MSB methods. It has recently become possible to measure relaxation and temperature independently and that would allow isolation of relaxation and temperature effects (Shi and Weaver 2019, Utkur and Saritas 2019). Independent data on relaxation and temperature should better characterize the biological effects of inflammation and allow better estimates of the biological rate constants to be made.
5. Conclusions
There were highly significant differences between the infected mice and the uninfected control mice suggesting that NP relaxation and clearance rate constants can be used as minimally invasive markers for inflammation and immune system activation in the peritoneum. The change in relaxation was the most reliable producing significance in all the infected animals. The clearance rate produced significant differences in three of the four infected mice and produced significant differences between the infected and control groups. Improved isolation of the physical effects contributing to the NP signal should allow more exact correlation with and more specific inferences about the relevant biological effects. Improved isolation might enable MSB to provide a measure of phagocytic cell uptake that is impossible to obtain in other ways.
Figure 7.

Decay constants for the relaxation time.
Acknowledgments
1R21EB021456
References
- Arokiasamy S, Zakian C, Dilliway J, Wang W, Nourshargh S and Voisin M-B 2017. Endogenous TNFα orchestrates the trafficking of neutrophils into and within lymphatic vessels during acute inflammation Sci. Rep 7 44189. [DOI] [PMC free article] [PubMed] [Google Scholar]
- Giustini AJ, Perreard I, Rauwerdink AM, Hoopes PJ and Weaver JB 2012. Noninvasive assessment of magnetic nanoparticle–cancer cell interactions Integr. Biol 4 1283–8 [DOI] [PMC free article] [PubMed] [Google Scholar]
- Khurshid H, Shi Y, Berwin BL and Weaver JB 2018. Evaluating blood clot progression using magnetic particle spectroscopy Med. Phys 45 3258–62 [DOI] [PubMed] [Google Scholar]
- Knopp T and Buzug TM 2012. Magnetic Particle Imaging; An Introduction to Imaging Principles and Scanner Instumentation (Berlin: Springer; ) [Google Scholar]
- Poller WC, Löwa N, Wiekhorst F, Taupitz M, Wagner S, Möller K, Baumann G, Stangl V, Trahms L and Ludwig A 2016. Magnetic particle spectroscopy reveals dynamic changes in the magnetic behavior of very small superparamagnetic iron oxide nanoparticles during cellular uptake and enables determination of cell-labeling efficacy J. Biomed. Nanotechnol 12 337–46 [DOI] [PubMed] [Google Scholar]
- Press WH, Teukolsky SA, Vetterling WT and Flannery BP 2007. Numerical Recipes in C: The Art of Scientific Computing (Cambridge: Cambridge University Press; ) [Google Scholar]
- Reeves DB and Weaver JB 2014. Magnetic nanoparticle sensing: decoupling the magnetization from the excitation field J. Phys. D: Appl. Phys 47 045002. [DOI] [PMC free article] [PubMed] [Google Scholar]
- Shapouri-Moghaddam A, Mohammadian S, Vazini H, Taghadosi M, Esmaeili S A, Mardani F, Seifi B, Mohammadi A, Afshari JT and Sahebkar A 2018. Macrophage plasticity, polarization, and function in health and disease J. Cell. Physiol 233 6425–40 [DOI] [PubMed] [Google Scholar]
- Shi Y and Weaver JB 2019. Concurrent quantification of magnetic nanoparticles temperature and relaxation time Med. Phys 46 4070–6 [DOI] [PMC free article] [PubMed] [Google Scholar]
- Stouffer SA, Suchman EA, Devinney LC, Star SA and Williams RM Jr 1949. The American Soldier: Adjustment During Army Life (Studies in Social Psychology in World War II) vol 1 (Princeton, NJ: Princeton University Press; ) [Google Scholar]
- Utkur M and Saritas EU 2019. Confounding effects of temperature and viscosity on relaxation mapping Proc 9th Int. Workshop on Magnetic Particle Imaging (New York, NY ) pp 223–4 [Google Scholar]
- Weaver JB, Rauwerdink AM and Hansen EW 2009. Magnetic nanoparticle temperature estimation Med. Phys 36 1822–9 [DOI] [PMC free article] [PubMed] [Google Scholar]
- Weaver JB, Zhang X, Kuehlert E, Toraya-Brown S, Reeves DB, Perreard IM and Fiering S 2013. Quantification of magnetic nanoparticles with low frequency magnetic fields: compensating for relaxation effects Nanotechnology 24 325502. [DOI] [PMC free article] [PubMed] [Google Scholar]
- Weaver JB and Kuehlert E 2012. Measurements of magnetic nanoparticle relaxation times Med. Phys 39 2765–70 [DOI] [PMC free article] [PubMed] [Google Scholar]