Abstract
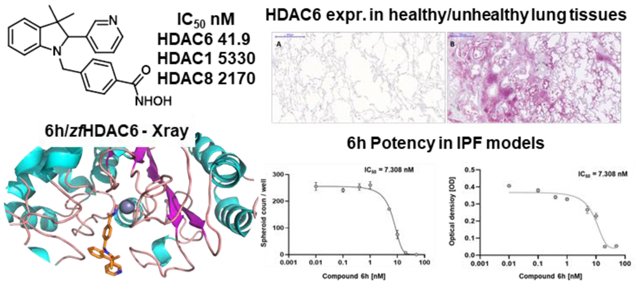
Idiopathic pulmonary fibrosis (IPF) is an interstitial lung disease characterized by a progressive fibrosing phenotype. IPF has been associated with aberrant HDAC activities confirmed by our immunohistochemistry studies on HDAC6 overexpression in IPF lung tissues. We herein developed a series of novel hHDAC6 inhibitors, coupled to low inhibitory potency over hHDAC1 and hHDAC8, as potential pharmacological tools for IPF treatment. Their inhibitory potency was combined with low in vitro and in vivo toxicity. Structural analysis on 6h and structure-activity relationship studies contributed to the optimization of the binding mode of the new molecules. The best performing analogs were tested for their efficacy in inhibiting fibrotic sphere formation and cell viability, proving their capability in reverting the IPF phenotype. The efficacy of analog 6h was also determined in a validated human lung model of TGF-β1-dependent fibrogenesis. The results highlighted in this manuscript may pave the way for the identification of first-in-class molecules for the treatment of IPF.
Keywords: Interstitial lung diseases, Idiopathic pulmonary fibrosis, HDAC inhibitors, TGF-β1
Graphical Abstract
INTRODUCTION
Millions of people worldwide suffer from lung diseases that affect the whole respiratory system including the airways, the air sacs (alveoli), lung interstitium, blood vessels, and pleura. Interstitial lung diseases (ILDs) are a numerous and heterogeneous group of diseases that affect lung interstitium, a thin layer of cells and tissue matrix between the alveoli, which contain blood vessels and cells that help support the alveoli, allowing efficient gas exchange. The pathological deposition of collagen and other connective tissue proteins causes progressive scarring and fibrosis. This disorganized damaged tissue impairs the vital role of the lungs in respiration with devastating consequences in terms of functional capacity, quality of life, and increased mortality.1 The most relevant ILDs may be associated with a progressive fibrosing phenotype and these ILDs are classified with a term known as progressive-fibrosing rare diseases. Among these progressive-fibrosing ILDs, the most common is idiopathic pulmonary fibrosis (IPF), characterized by a very poor prognosis.
IPF accounts for 25% of all ILDs with about 35,000 new cases diagnosed every year in Europe and 5,000,000 worldwide. IPF has an annual incidence of 0.22–7.4 per 100,000 people with a prevalence of 1.25–23.4 cases per 100,000 of population.2 The contribution of inflammation to the fibrotic process in IPF is controversial, but conventional anti-inflammatory therapies (e.g. glucocorticoid-s) are not efficacious.3,4 Over the past decades, many clinical trials have been designed to determine the safety and efficacy of pharmacotherapies for patients with IPF. However, so far, only two drugs (pirfenidone 1 and nintedanib 2, Figure 1) were found to have an impact on disease progression. These two drugs have been approved for the treatment of IPF by regulatory agencies and are currently in clinical use worldwide.5,6 Even though these drugs possess an acceptable safety profile, they only delay disease progression and fail to reverse lung damage.2,6,7
Figure 1.
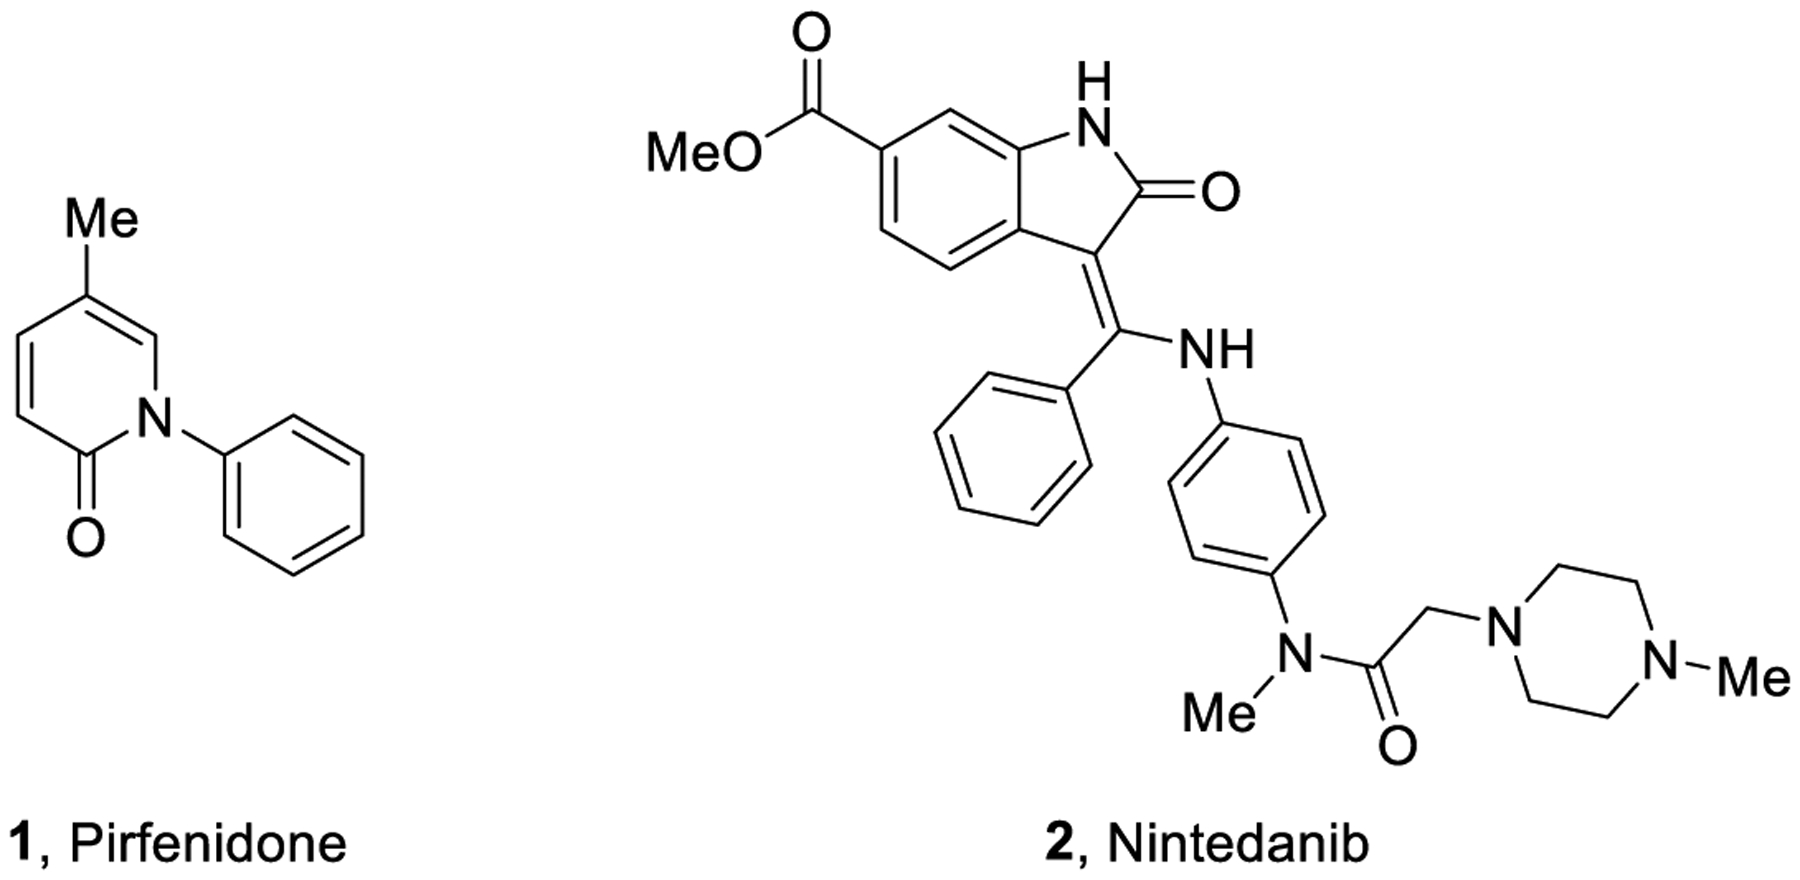
Representative structures of the FDA-approved drugs for the treatment of IPF.
Epigenetic regulation modulates many cellular processes and greatly influences key disease mechanisms. Histone deacetylase (HDAC) enzymes play a crucial role either as biomarkers or therapeutic targets owing to their involvement in specific pathophysiological pathways. HDACs are a class of enzymes responsible for the removal of acetyl groups from histones leading to decreased gene transcription and are mostly involved in biological processes related to chromatin.8 HDACs can deacetylate both histone and non-histone substrates, including transcription factors such as p53, Rb, and others. They also regulate key protein substrates such as α-tubulin, actin, cortactin and can thereby influence many cellular processes namely apoptosis, cell signaling, and DNA repair, replication, and recombination.9 HDACs represent a family of 11 zinc-dependent enzymes (HDAC1–11) clustered into three groups (class I, II, and IV). Class I comprises nuclear enzymes HDAC1–3 and HDAC8, while class II contains HDAC4–7 and HDAC9–10 possessing nucleocytoplasmic shuttling ability, also observed in class IV HDAC (HDAC11). Class III HDAC contains non-zinc dependent enzymes, called sirtuins (SIRT 1–7) requiring NAD+ for their activity.10 Overexpression of HDACs is implicated in many pathological conditions including cancer, neurodegeneration, and rare diseases such as IPF as confirmed by us (see below).7,11–13 Currently, four pan-HDAC inhibitors (HDACi) have been approved by the FDA for the treatment of hematological malignancies and many other HDACi are under clinical investigation for cancer and other diseases.14,15 However, none of them have been approved for fibrotic diseases yet.
Aberrant HDAC activities are observed in fibrotic diseases, and mounting evidence indicate the involvement of HDACs in the initiation and progression of fibrosis occurring in organs such as lungs, heart, liver, and kidneys, and preliminary studies performed on animal models have shown that HDACi can ameliorate various forms of fibrosis.16,17 Due to the limitations of pirfenidone (1) and nintedanib (2) in IPF, and a lack of promising clinical candidates, an unprecedented effort is required to enrich the therapeutic arsenal available to tackle IPF and other rare fibrotic disorders.18 In particular, the regulation of transforming growth factor β1 (TGF-β1) by HDAC6, a microtubule-associated deacetylase, is significant in the pathogenesis and progression of fibrotic diseases through epithelial-mesenchymal transitions (EMT).19 Fibrotic lesions are associated with an aberrant expression of TGF-β1 which is a potent EMT inducer.20 Recent reports suggest that HDAC6 inhibition by siRNA or tubacin (3, Figure 2) reduces the TGF-β1-induced EMT markers and impairs SMAD3 activation in response to TGF-β1. Since SMAD3 is a core element for TGF-β1 signaling, its inactivation impairs HDAC6-dependent deacetylation of α-tubulin highlighting the role of HDAC6 in EMT through the TGF-β1-SMAD3 signaling pathway.17 Several reports highlighted the efficacy of pan-HDACi (such as SAHA (4) and panobinostat (5), Figure 2) against IPF and fibrotic lung diseases,21 mainly based on the reduction in fibroblast-myofibroblast differentiation and fibroblast proliferation induced by TGF-β1.22,23 Recently, HDAC6 inhibitors showed to protect mice from lung fibrosis, by repressing TGF-β1-induced collagen expression and diminished Akt phosphorylation.24
Figure 2.
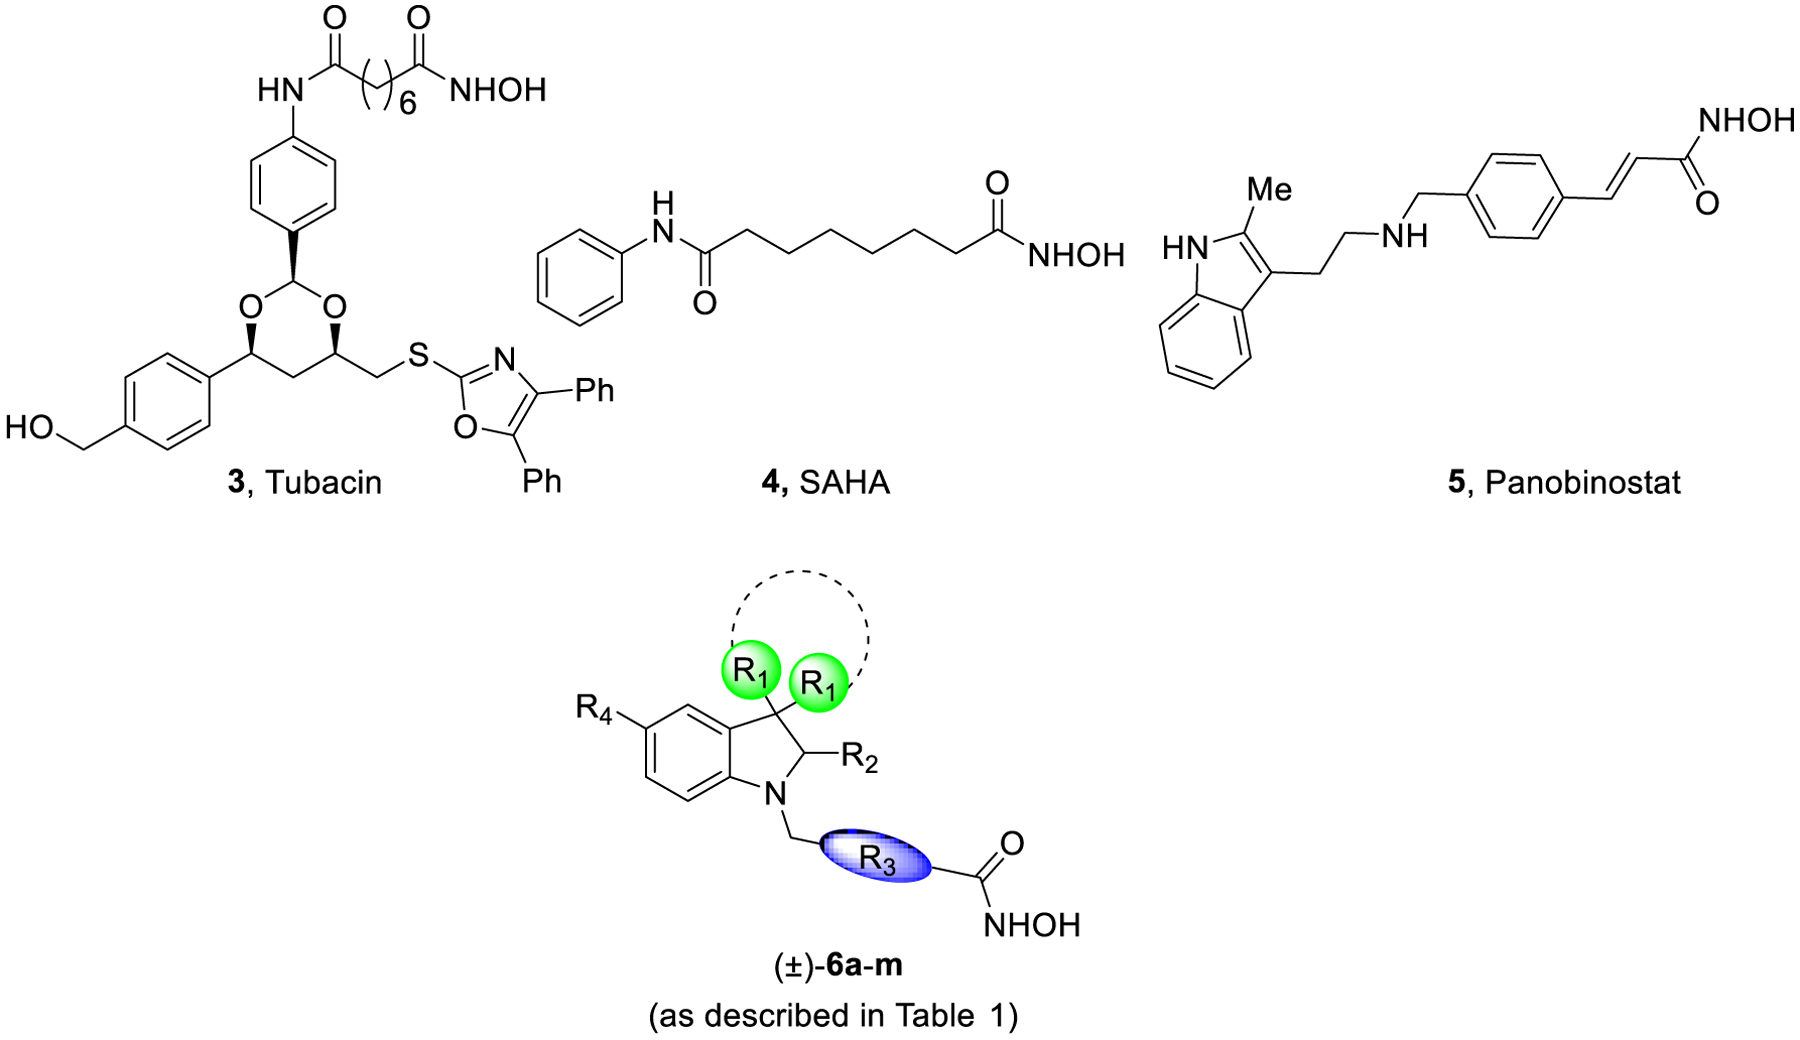
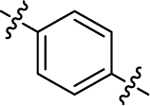
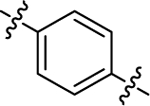
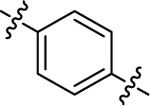
Representative structures of some HDACi as antifibrotic agents and title compounds (±)-6a-m (as described in Table 1).
For many decades, HDACi have drawn widespread attention as therapeutic agents for different diseases. However, due to reports indicating several challenges encountered with the use of pan-HDACi and their off-target effects, there is an urgent need to develop isoform-selective inhibitors to be investigated in fibrotic diseases.25,26 Based on these observations, further studies pointed out how only HDAC6 enzyme could be selectively targeted, mostly because of its cytoplasmic localization.27
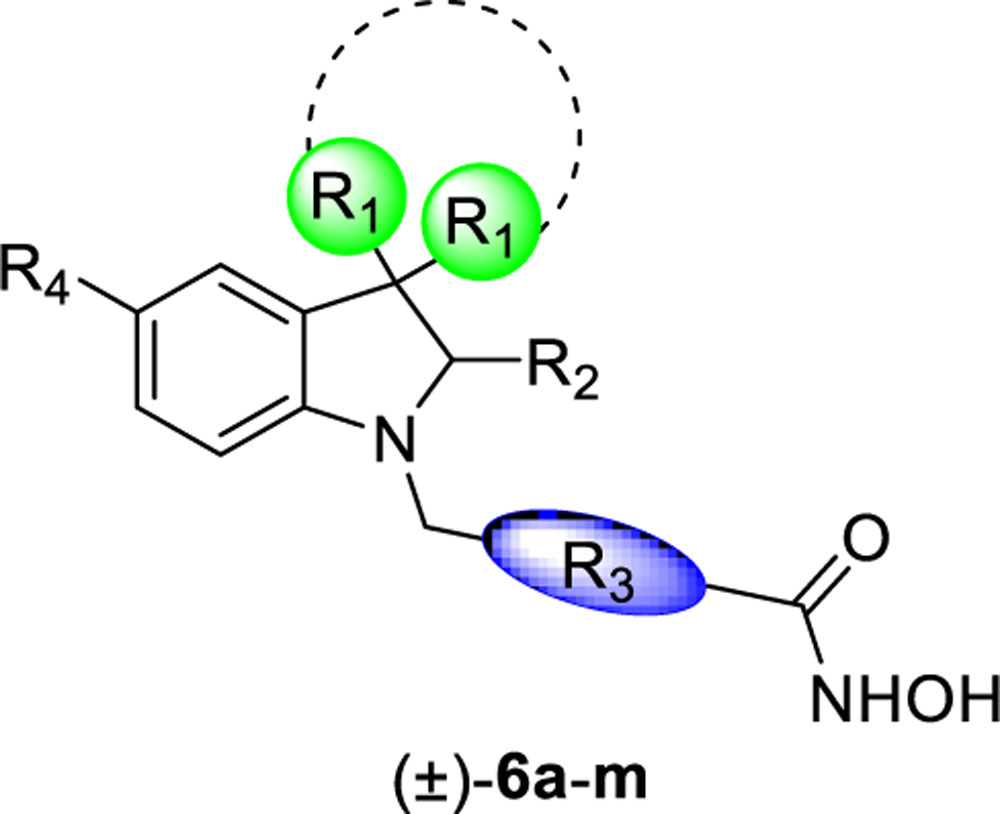
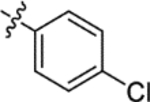
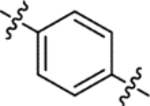
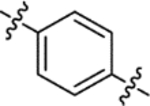
The general pharmacophoric model of HDACi comprises of: i) a cap group, which interacts with the amino acid residues at the surface of the enzyme; ii) a zinc-binding group (ZBG), usually a hydroxamic acid group, chelating the Zn2+ necessary for the inhibitory activity; and iii) a linker group between these portions. Our research group has been actively involved in the development of potent HDACi as therapeutic agents for the treatment of cancers, rare disorders, and infectious diseases.28–31 Based on reports outlining the HDACi (compound 3)-mediated impairment of the TGF-β1-EMT pathway, we designed and synthesized novel HDAC6i (6a-m, Table 1) selective over hHDAC1 and hHDAC8, as promising pharmaceutical tools for the treatment of IPF, with the aim of investigating also the role of this enzyme isoform in fibrotic processes. In this strategy, a key challenge was the rational improvement of HDAC6 selectivity over other specific isoforms, such as HDAC1 and HDAC8, class I nuclear HDACs. While HDAC1 deacetylate histones and transcriptional regulators, HDAC8 is fundamentally distinct from HDAC1–3 and is the only isoform for which the gene lies in the X chromosome. Moreover, because of similarities in the active site of HDAC6 and HDAC8, discriminating between these two isoforms is challenging.
Table 1.
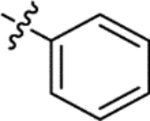
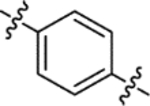
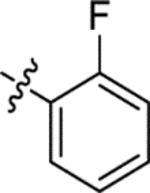
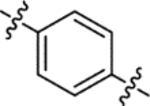
Inhibitory activity of compounds 6a-m towards hHDAC1 and hHDAC6 (as IC50, nM)a.
 | |||||||
|---|---|---|---|---|---|---|---|
| Compound | R1 | R2 | R3 | R4 | hHDAC1 (IC50 nM) | hHDAC6 (IC50 nM) | HDAC1/6 |
| (±)-6a | 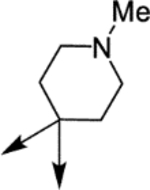 |
 |
 |
H | 4290 | 73.2 ± 11.6 | 59 |
| (±)-6b | 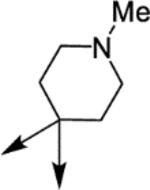 |
 |
 |
H | 3650 | 164.8 ± 30.7 | 22 |
| (±)-6c | 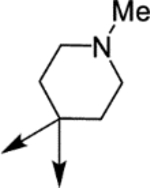 |
 |
 |
H | 8100 | 110.6 ± 15.5 | 73 |
| (±)-6d | 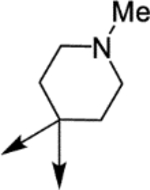 |
 |
 |
H | 4850 | 28.5 ± 3.8 | 170 |
| (±)-6e | 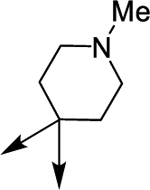 |
 |
 |
H | 6160 | 141.9 ± 38.6 | 43 |
| (±)-6f | 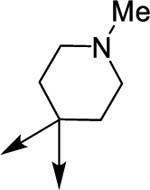 |
 |
 |
H | 7600 | 111.7 ± 19.4 | 68 |
| (±)-6g | Me | 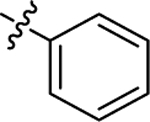 |
 |
H | 18680 | 166.2 ± 31.3 | 112 |
| (±)-6h | Me | 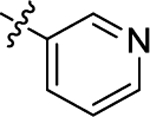 |
 |
H | 5330 | 41.9 ± 6.0 | 127 |
| (R)-(+)-6h | Me | 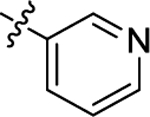 |
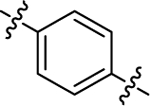 |
H | 16190 | 90.6 ± 15.5 | 178 |
| (S)-(−)-6h | Me | 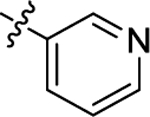 |
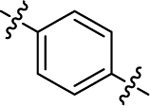 |
H | 3380 | 71.3 ± 8.4 | 47 |
| (±)-6i | Me | 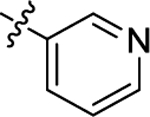 |
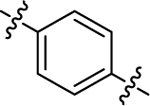 |
OMe | 5320 | 67.2 ± 15.3 | 79 |
| (±)-6j | Me | 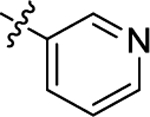 |
 |
H | 6320 | 810.8 ± 59.6 | 8 |
| (±)-6k | Me | 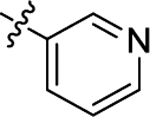 |
 |
H | 1630 | 616.3 ± 40.7 | 3 |
| (±)-61 | Me | 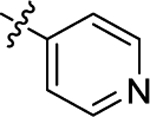 |
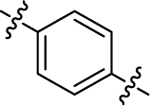 |
H | 10790 | 61.1 ± 12.9 | 177 |
| (±)-6m | 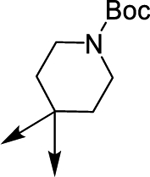 |
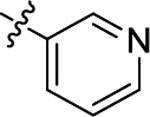 |
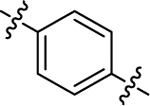 |
H | 8100 | 151.6 ± 26.4 | 53 |
| Tubacin, 37 | - | - | - | - | 1400 | 4 | 350 |
| SAHA, 47 | - | - | - | - | 33 | 33 | 1 |
Each value is the mean of at least three determinations; results are expressed with ±SD. When not specified, SD is <10% of the IC50.
Following our previous experience on HDAC6 inhibition by small molecules, we decided to investigate the effect of introducing a bulkier cap group to increase the number of interactions with the lipophilic pocket of the HDAC6 enzyme minimizing interactions with the catalytic sites of hHDAC1 and hHDAC8 isoforms.31,32 This was achieved by decorating the indoline scaffold with different aromatic and aliphatic moieties at the C2 and C3 positions, respectively. Thereafter, we determined the affinity of the newly developed series of compounds on hHDAC6, hHDAC8, and hHDAC1. To establish the binding mode on HDAC6 of the new series, we co-crystallized compound 6h with zebrafish HDAC6 (zfHDAC6) (2.04 Å). The best performing compounds were then evaluated for their antifibrotic and pharmacokinetic profiles. In addition, their potential toxicity, cytotoxicity, cardiotoxicity, and mutagenicity were also evaluated in different in vitro and in vivo models.
RESULTS AND DISCUSSION
Chemistry.
The synthetic approach for the development of the new molecules is based on three key steps: i) the formation of the suitable ketones to be subjected to interrupted Fischer indolization and subsequent indolenine reduction; ii) a reductive amination on the indoline nitrogen; and iii) the conversion of the methyl ester to hydroxamic acid.
The synthesis of the tosylhydrazones 7, 21, and 26 was achieved following the procedure applied in our previous work starting from commercially available supplies.30 In Scheme 1 the synthesis of the final compounds 6a-f is reported. The tosylhydrazone 7 was converted to ketones 8a-f after the treatment with the opportune aldehyde and Cs2CO3. 8a-f were subjected to a Fischer protocol with phenylhydrazine and sulfuric acid affording spiroindolenines 9a-f. Catalytic hydrogenation of the metastable indolenine followed by reductive amination with methyl 4-formylbenzoate afforded spiroindolines 11a-f. These intermediates were converted to their corresponding hydroxamic acids (±)-6a-f after treatment with KOH and aqueous NH2OH. All the products were obtained as racemic mixtures.
Scheme 1:
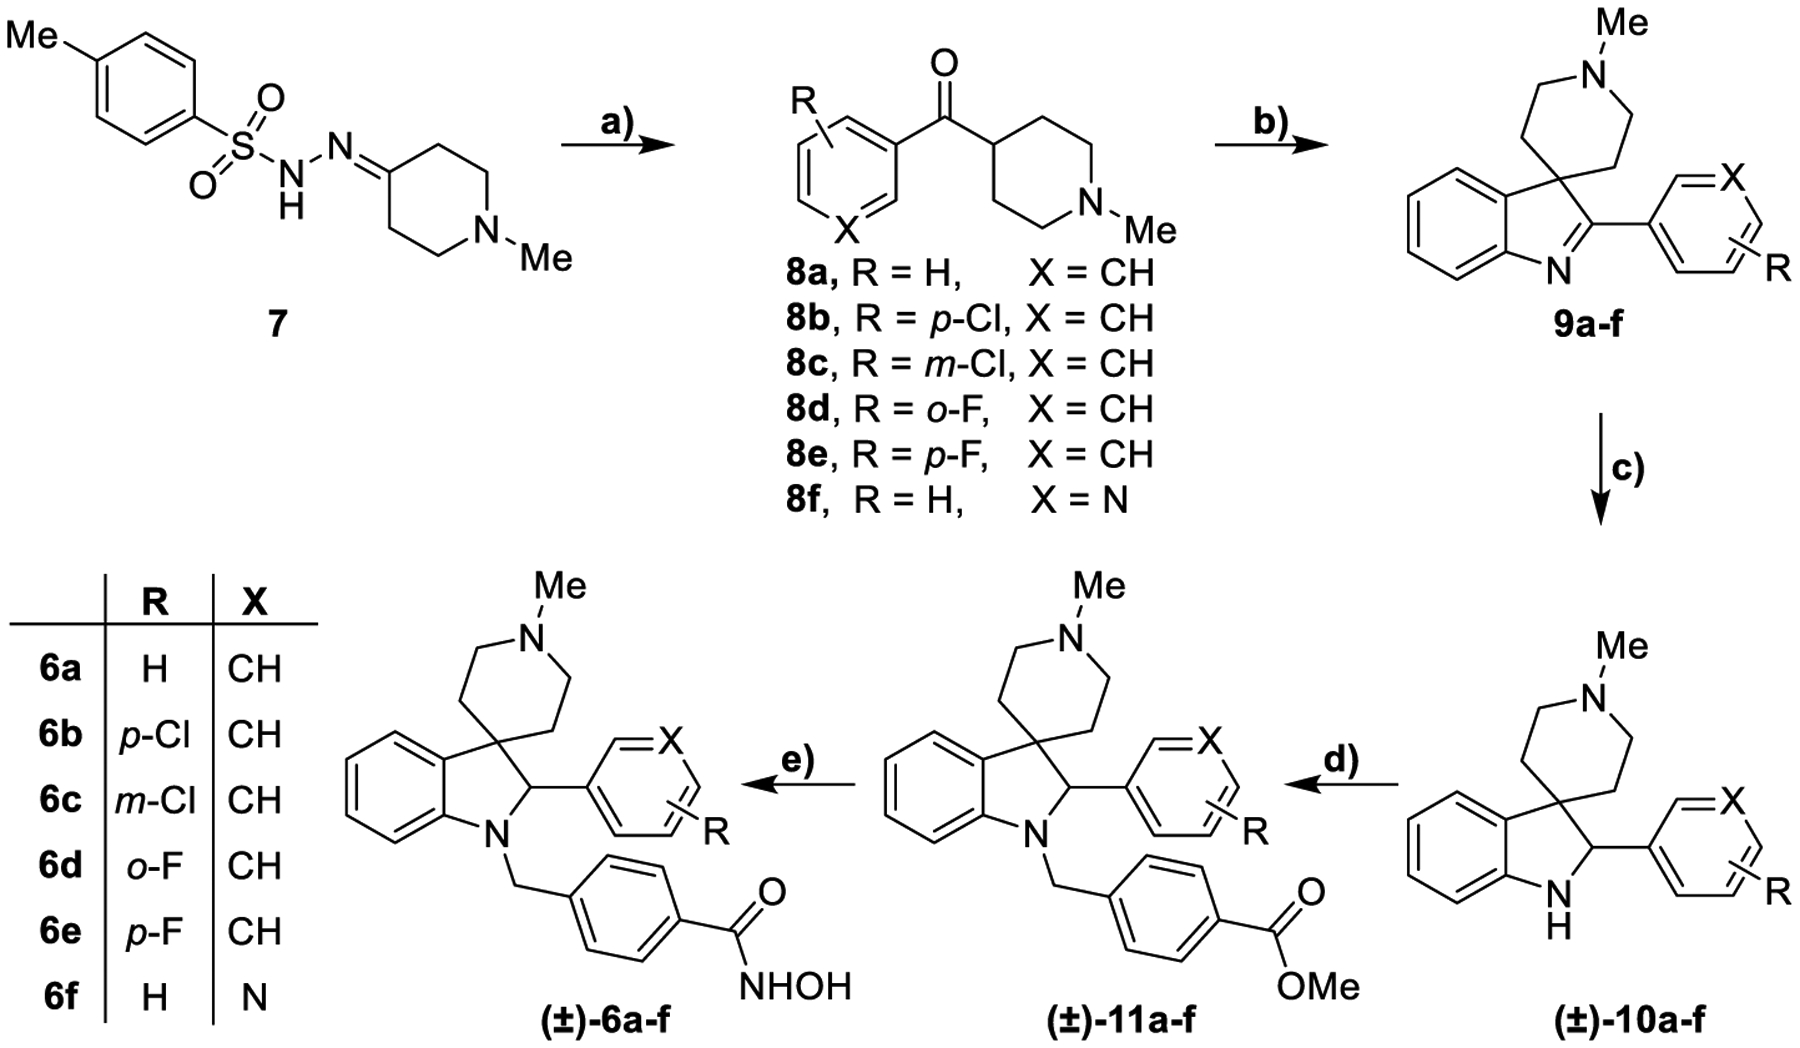
Synthesis of compounds (±)-6a-fa
aReagents and conditions: a) Appropriate aryl aldehyde, Cs2CO3, 1,4- dioxane, 110 °C, 14 h, 40–100%; b) phenylhydrazine, H2SO4, 1,4-dioxane, 70 °C, 2 h then 25 °C, 14 h, 30–66%; c) NaBH4, MeOH, 25 °C, 12 h or H2/Pd, MeOH, 25 °C, 12 h, 40–100%; d) methyl 4-formylbenzoate, NaBH3CN, EtOH, AcOH, 70 °C, 14 h, 25–43%; e) NH2OH (50% in H2O), KOH, DCM/MeOH from 0 °C to 25 °C, 12 h, 33–73%.
The synthesis of the linker moieties 16 and 20 is described in Scheme 2. 4-Bromobutyryl chloride was converted to its corresponding methyl ester and then used to alkylate p-cresol in presence of Cs2CO3.
Scheme 2:
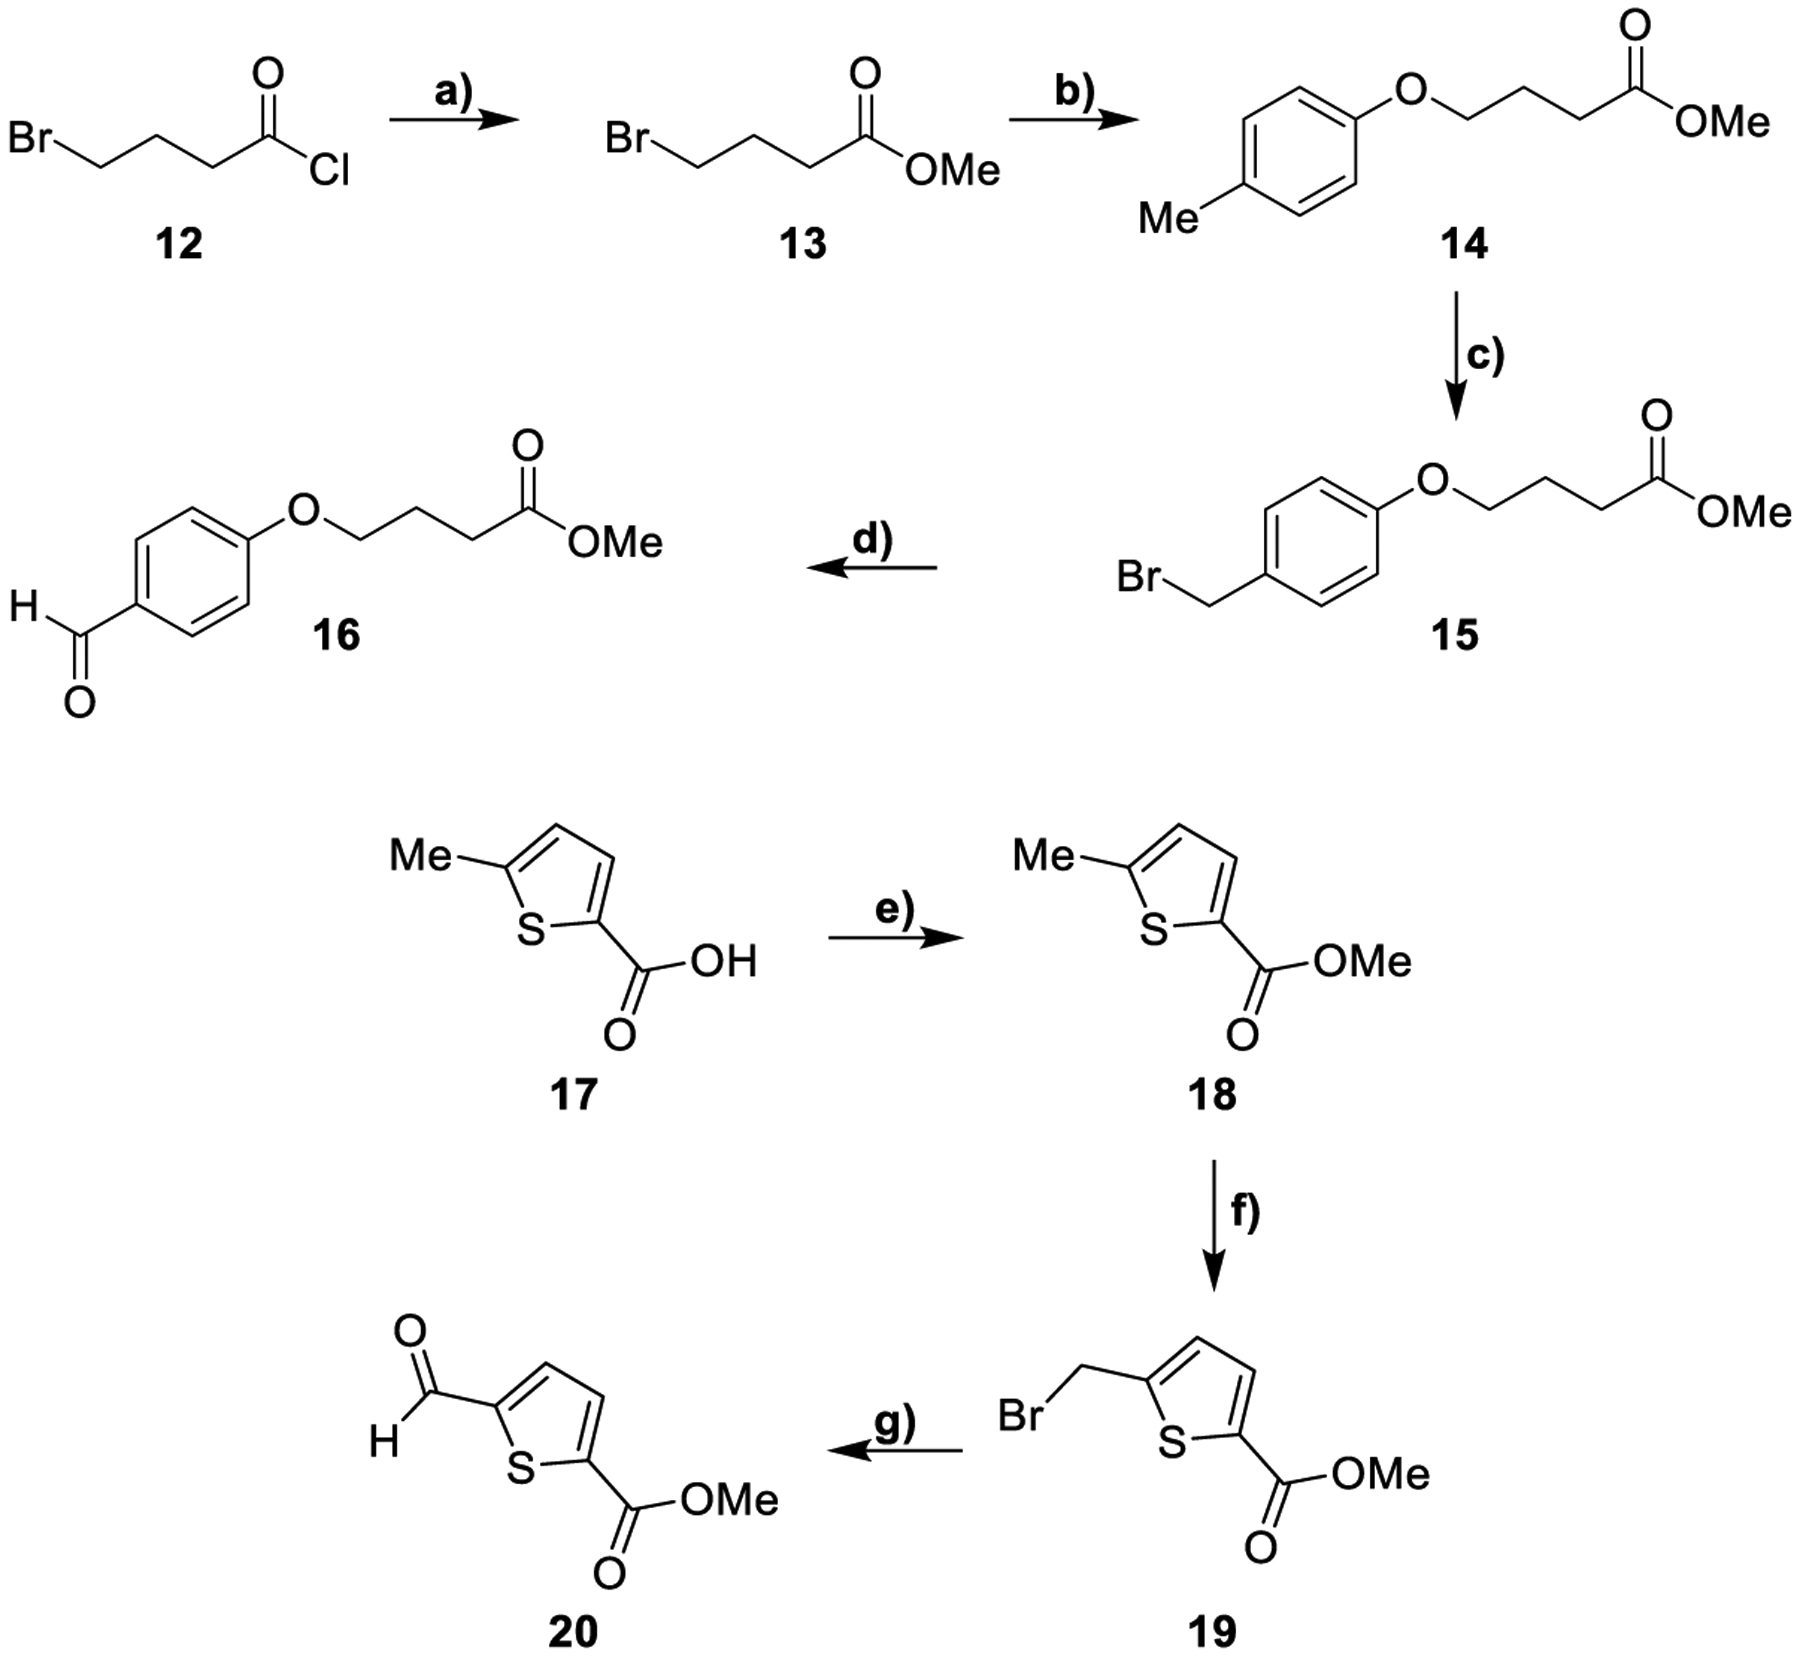
Synthesis of aldehydes 16 and 20a
aReagents and conditions: a) MeOH, from 0 °C to 25 °C, 12 h, 100%; b) p-cresol, Cs2CO3, MeCN, 90 °C, 14 h, 74%; c) NBS, AIBN, CCl4, 90 °C, 1 h; d) NBS, DMSO, 100 °C, 2 h, 30% over two steps; e) SOCl2, MeOH, 0 to 25 °C, 12 h, 100%; f) NBS, AIBN, CCl4, 80 °C, 4 h, 60%; g) NMO, MeCN, 25 °C, 12 h, 70%.
The resulting compound 14 was subjected to a radical bromination leading to the formation of the unstable intermediate 15 that was immediately oxidized by using NBS in the presence of DMSO. This reaction provided the aldehyde 16 in good yields.
For the synthesis of the lateral chain 20, 5-methylthiophene-2-carboxylic acid was converted into its corresponding methyl ester 18. Compound 18 was subjected to a radical bromination with NBS and AIBN affording the bromo-derivative 19. The aldehyde 20 was obtained from intermediate 19 upon reaction with 4-methylmorpholine N-oxide (NMO) in MeCN.
In Scheme 3 the synthesis of the compounds 6g-l is described. Following the synthetic approach previously shown in Scheme 1, tosylhydrazone 21 were reacted with suitable arylaldehydes to obtain ketones 22b-c. The cyclization reaction between phenylhydrazine and compounds 22a-c provided derivatives 23a-c. 22b was reacted with 4-methoxyphenylhydrazine to furnish compound 23d. These intermediates were reduced with NaBH4 or by catalytic hydrogenation affording 24a-d. Indoline derivatives were subjected to a reductive amination protocol with the appropriate aldehydes generating the compounds (±)-25a-f that were reacted with KOH and NH2OH providing hydroxamic acids (±)-6g-l as racemic mixtures.
Scheme 3:
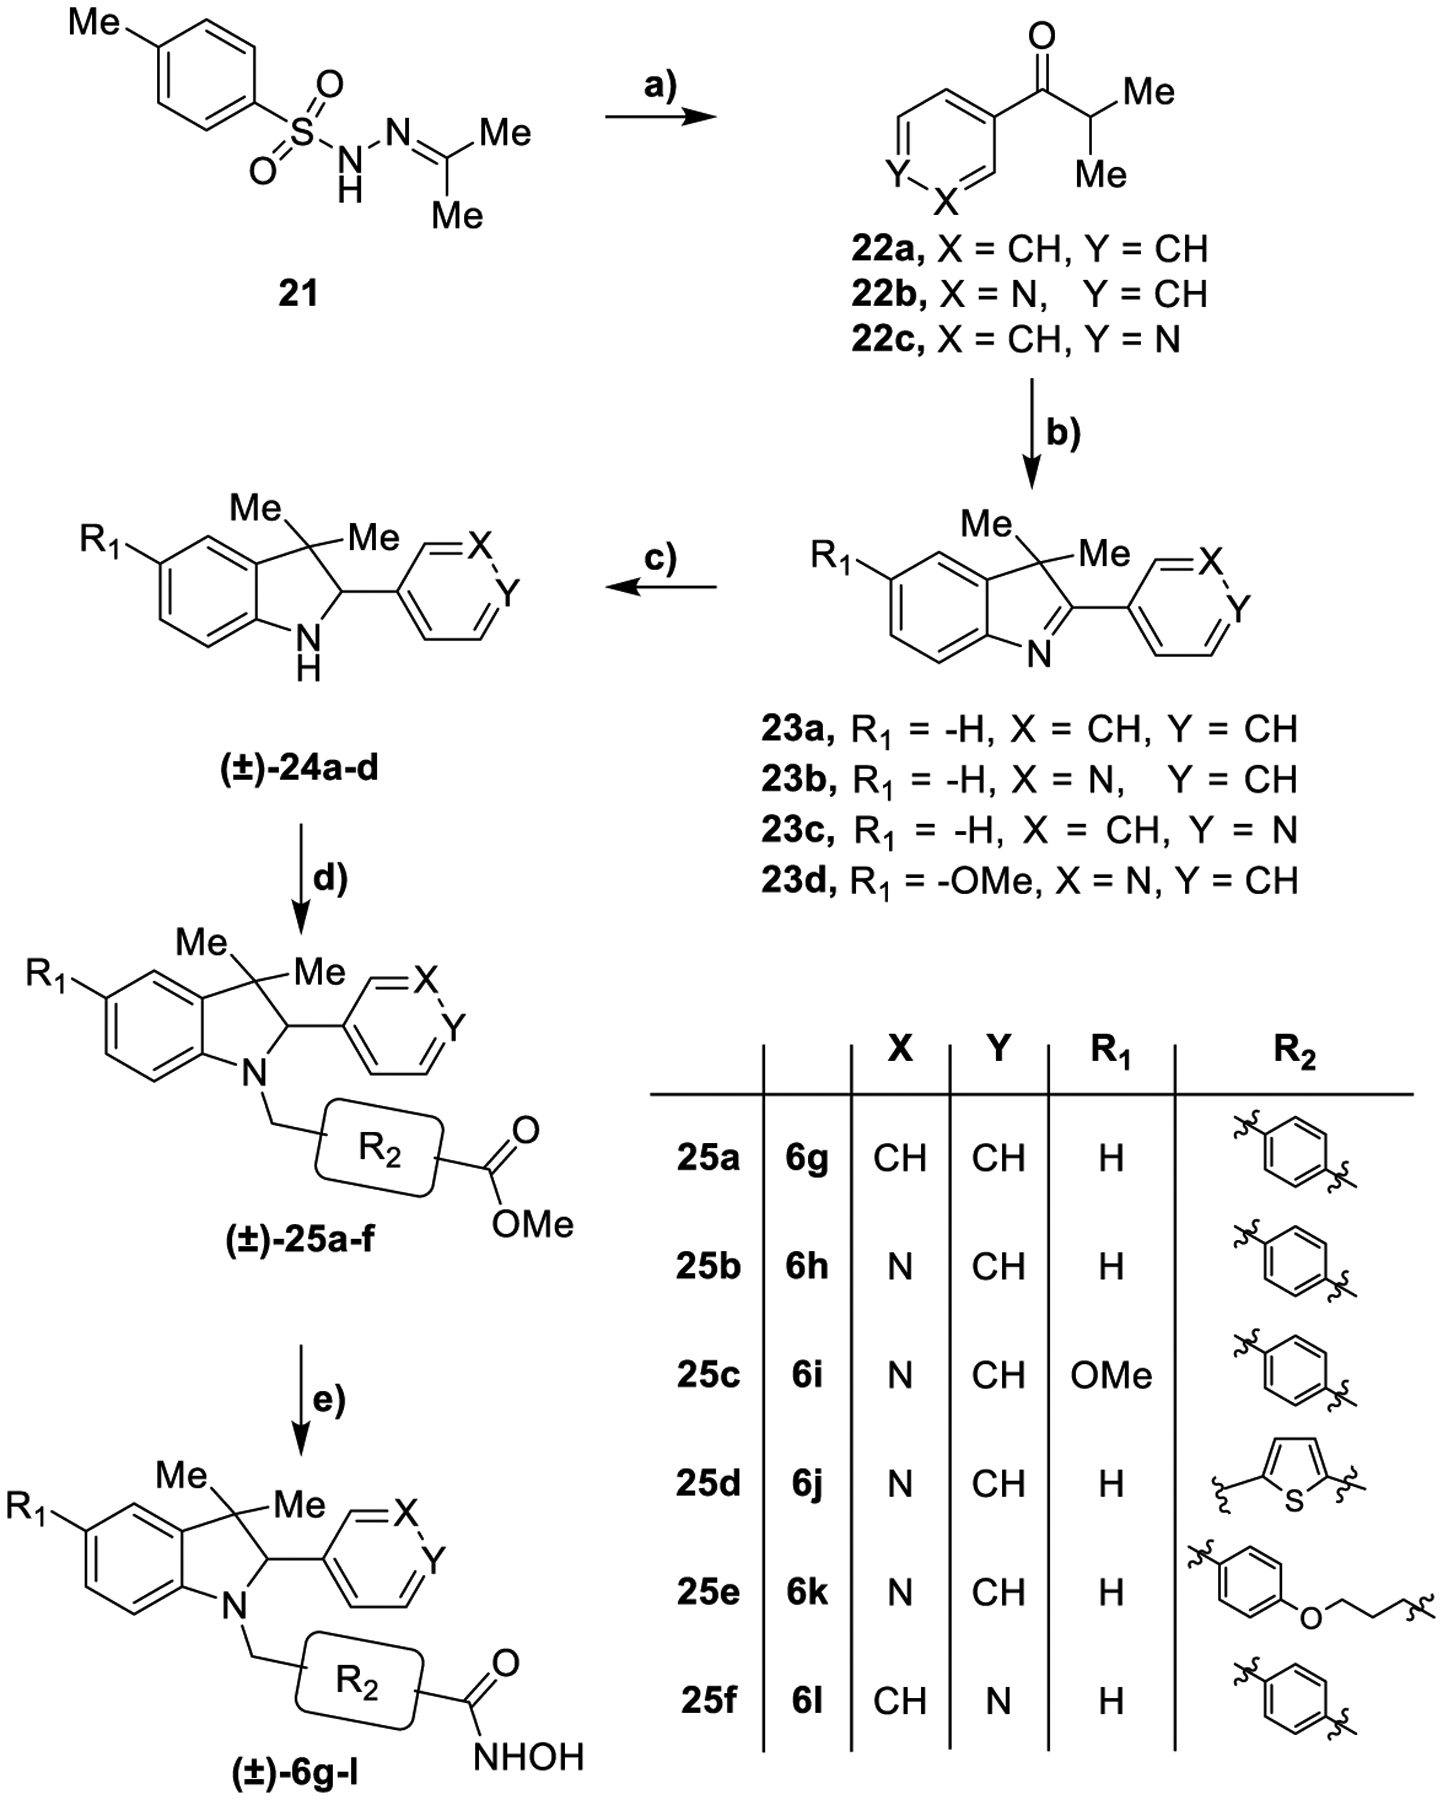
Synthesis of compounds (±)-6g-la
aReagents and conditions: a) Appropriate aryl aldehyde, Cs2CO3, dioxane, 110 °C, 14 h 89–100%; b) for 23a-c: phenylhydrazine, AcOH, 80 °C, 14 h; for 23d: 4-methoxyphenylhydrazine, AcOH, 80 °C, 14 h, 30–48%; c) NaBH4, MeOH, 25 °C, 12 h or H2, Pd/C, MeOH, 25 °C, 12 h, 50–79%; d) for (±)-25a-c and 25f: methyl 4-formylbenzoate, EtOH, AcOH, NaBH3CN, 40 °C, 14 h; for (±)-25d: 20, EtOH, AcOH, NaBH3CN, 40 °C, 14 h; for (±)-25e: 16, NaBH(OAc)3 DCM, 40 °C, 14 h, 20–84%; e) NH2OH (50% in H2O), KOH, DCM/MeOH from 0 °C to 25 °C, 12 h, 18–79%.
In Scheme 4 the synthesis of compound 6m is reported. Following the previously described procedure, tosylhydrazone 26 was reacted with 3-pyridinecarboxaldehyde and Cs2CO3 obtaining compound 27. This intermediate was subjected to a Fischer reaction to get the corresponding indolenine. The loss of the Boc protecting group due to the acidic conditions of the Fischer reaction required subsequent treatment with Boc2O for its reinstallation, providing indolenine 28. The reduction of this intermediate by catalytic hydrogenation followed by a reductive amination with methyl 4-formylbenzoate afforded (±)-30 as a racemic mixture. This compound was converted to the hydroxamic acid (±)-6m after the treatment with KOH and NH2OH.
Scheme 4:
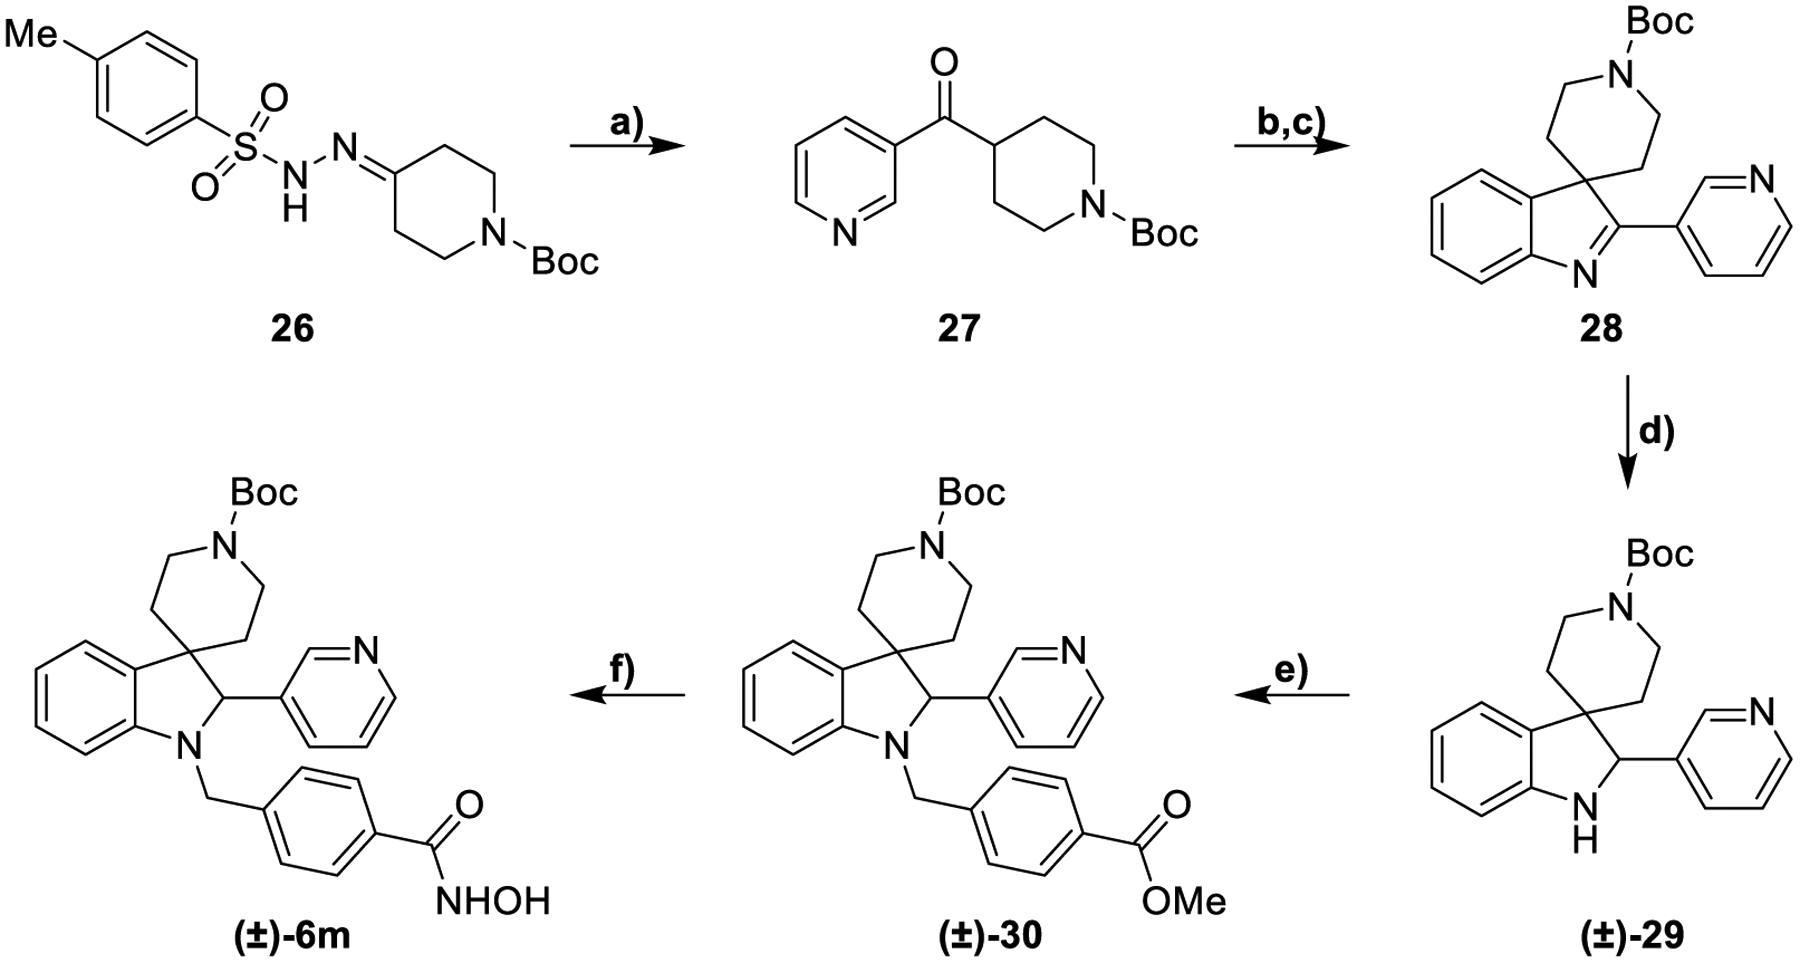
Synthesis of compound (±)-6ma
aReagents and conditions: a) 3-Pyridinecarboxaldehyde, Cs2CO3, dioxane, 110 °C, 14 h, 100%; b) phenylhydrazine, H2SO4, dioxane, 70 °C, 2 h, 14%; c) Boc2O, THF, NaOH, 25 °C, 2 h, 100%; d) H2 Pd/C, MeOH, 25 °C, 12 h, 100%; e) methyl 4-formylbenzoate, NaBH3CN EtOH, AcOH, 70 °C, 14 h, 30%; f) NH2OH (50% in H2O), KOH, DCM/MeOH from 0 °C to 25 °C, 12 h, 51%.
To evaluate the stereoselective interaction with hHDAC6, we decided to resolve the racemic mixture of (±)-6h. Analogue 6h successfully co-crystallized with the enzyme (Figure 4). To this end, we resolved the racemic mixture of esters (±)-25b by using chiral HPLC (see Supporting Information). The two enantiomers, (+)-25b and (−)-25b, were isolated with an enantiomeric excess of > 99% (Figure S1 of the Supporting Information) and underwent the final reaction giving the two enantiomers of 6h; in particular, (+)-25b and (−)-25b yielded (+)-6h and (−)-6h, respectively (Scheme 5). The absolute configuration of (−)-25b was established by electronic circular dichroism (ECD) spectroscopy and time-dependent density functional theory (TD-DFT) calculations. The comparison between the experimental and theoretical spectra (Figure 3) allowed us to assign the (S)-absolute configuration to (−)-25b (r = 0.7345 for the ECD spectra) and, consequently, to (−)-6h.
Figure 4.
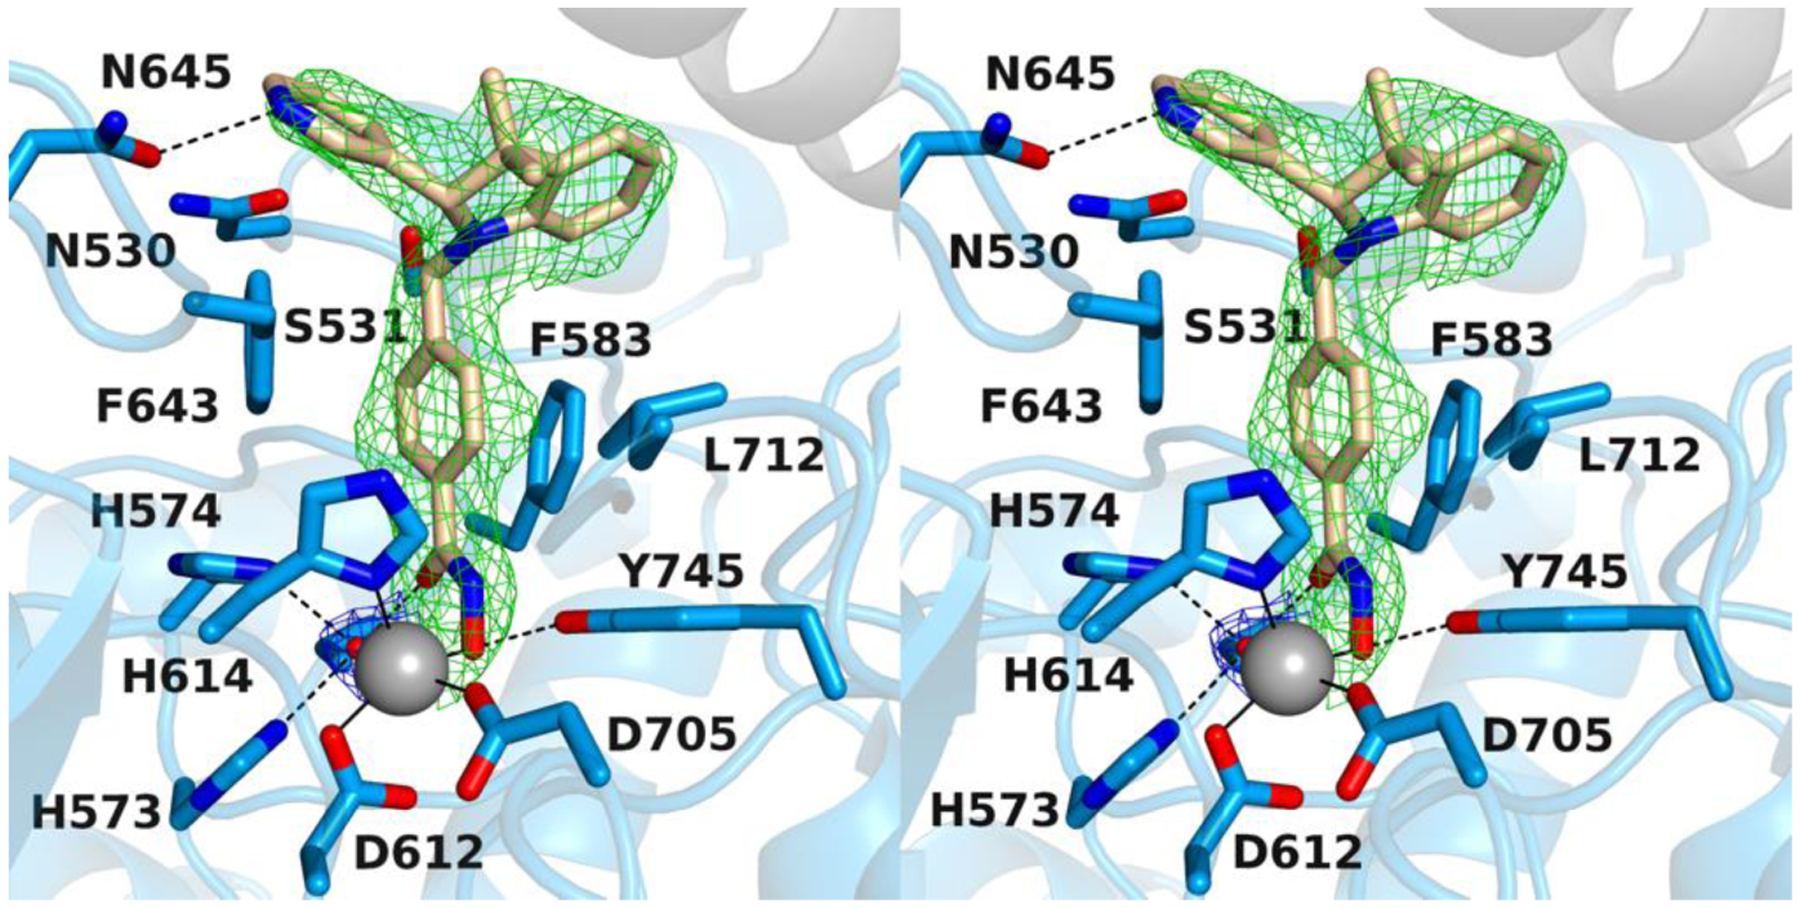
Stereoview of a Polder omit map of the zfHDAC6/(S)-6h complex (PDB 6V79; contoured at 2.5 σ). The Zn2+-bound water molecule is contoured at 3.5 σ. Atoms are color-coded as follows: C = light blue (zfHDAC6 monomer A), light gray (zfHDAC6 monomer B), or wheat (inhibitor), N = blue, O = red, Zn2+ = gray sphere, and Zn2+-bound water molecule = small red sphere. Metal coordination and hydrogen bond interactions are indicated by solid and dashed black lines, respectively.
Scheme 5:
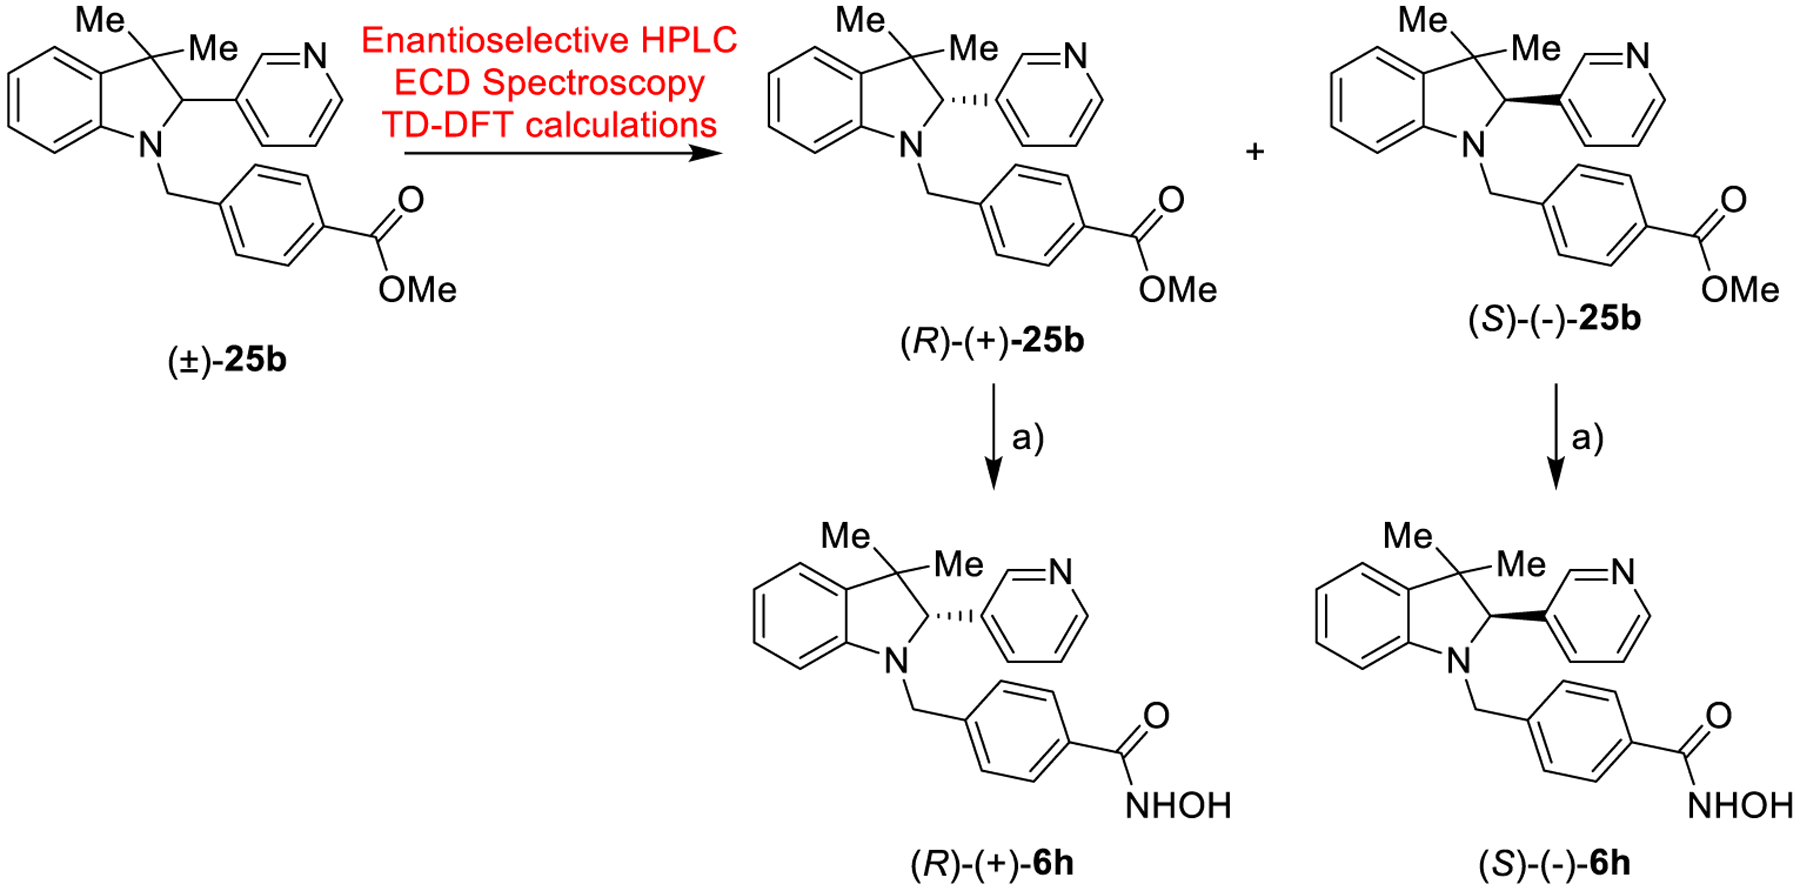
Synthesis of (R)-(+)6h and (S)-(+)6ha
aReagents and conditions: a) NH2OH (50% in H2O), KOH, DCM/MeOH from 0 °C to 25 °C, 12 h, 34–38%.
Figure 3.
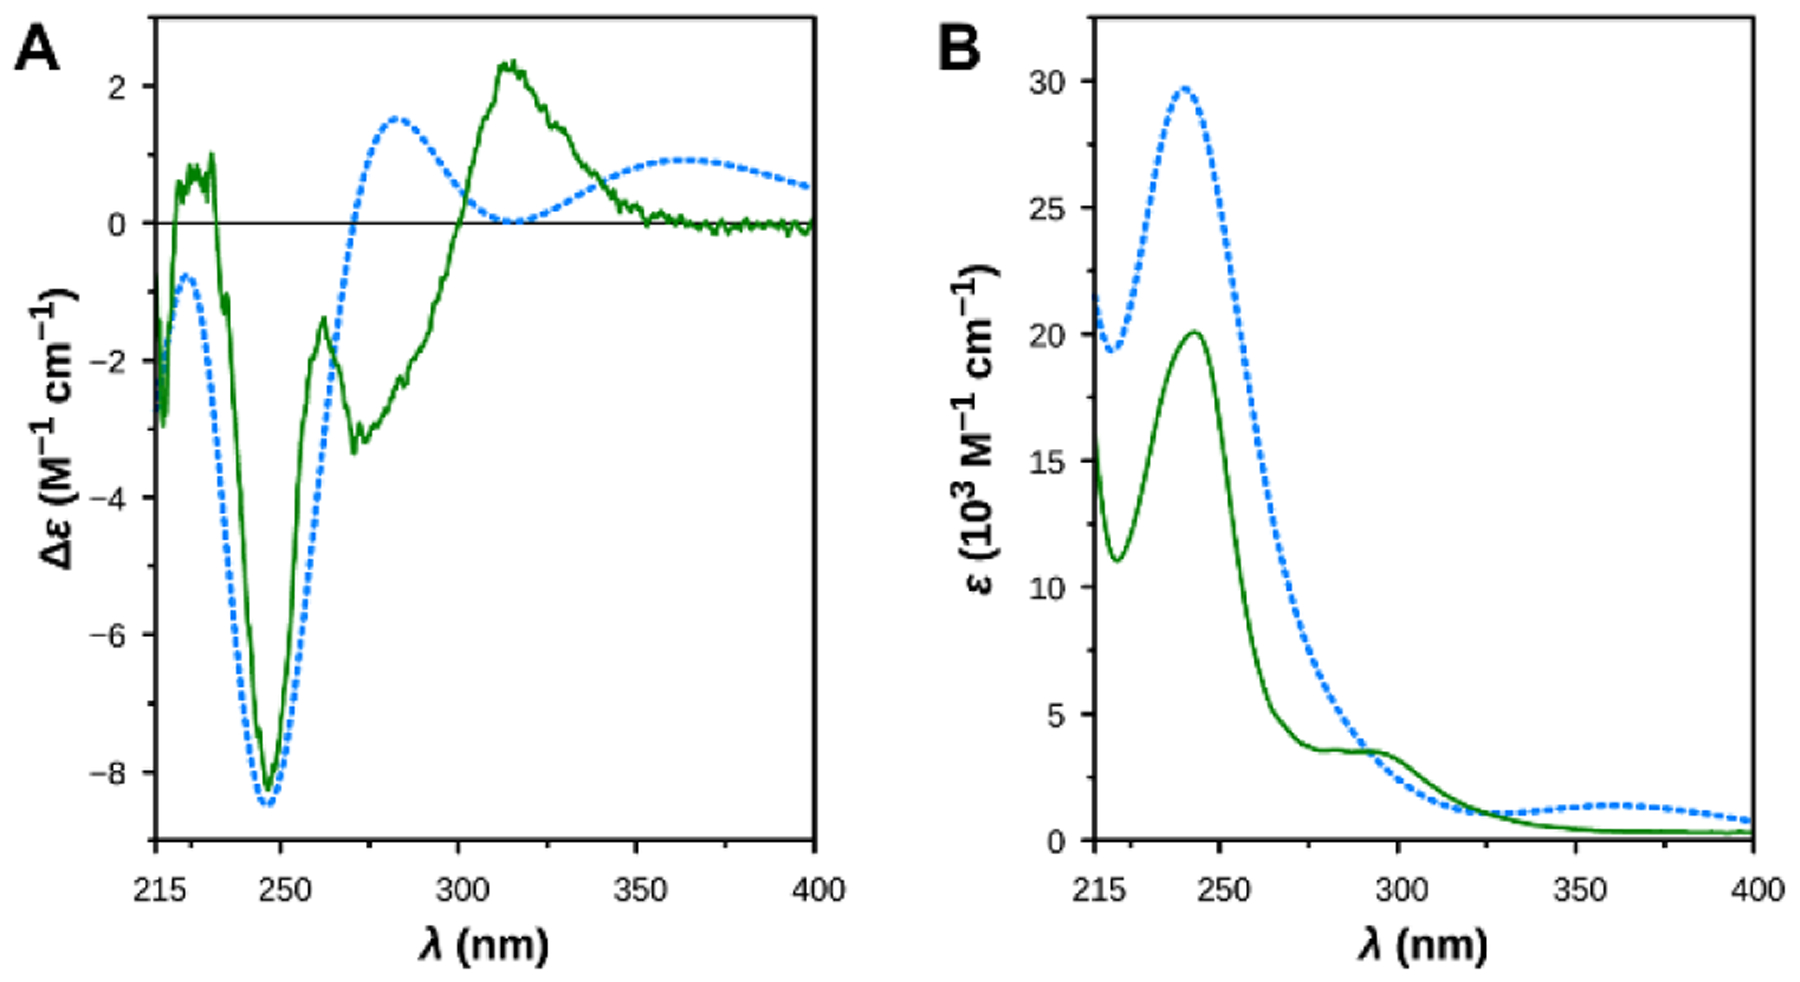
Comparison between the experimental spectra of (−)-25b (solid lines) and the theoretical spectra of (S)-25b, as determined by TD DFT calculations (dashed lines). (A) ECD spectra. (B) UV spectra.
Crystal Structure Determination of the zfHDAC6–6h Complex.
The 2.04 Å-resolution crystal structure of the zfHDAC6–6h complex contains 2 monomers in the asymmetric unit of a monoclinic unit cell was obtained. There are no major conformational changes between the liganded and unliganded (PDB 5EEM) enzyme structures, and the root-mean-square deviation (RMSD) is 0.15 Å for 309 Cα atoms in monomer A. By soaking experiments with racemic 6h we only obtained co-crystallization of the (S)-enantiomer. The inhibitor hydroxamate group coordinates to the catalytic Zn2+ ion through only the ionized N–O− moiety (Figure 4). The Zn2+-bound oxyanion also accepts a hydrogen bond from the phenolic hydroxyl group of Y745. Weak electron density for a Zn2+-bound water molecule is also observed. This water molecule forms hydrogen bonds with H573, H574, and the carbonyl group of the hydroxamate moiety.
The inhibitor capping group consists of a 3,3-dimethyl-2-(pyridine-3-yl)indoline, and the pyridine nitrogen forms a hydrogen bond with N645 at the mouth of the active site cleft. The pyridine NH group is presumably protonated in this environment to donate the hydrogen bond to the side chain carbonyl group of N645. The orientation of N645 is fixed by other hydrogen bond interactions with the protein. This hydrogen bond may rationalize the orientation of the capping group into the L2 pocket, where relatively few HDAC6 inhibitors orient unless they possess bifurcated capping groups.33 Notably, however, hHDAC6 has a methionine residue at position 645 instead of an asparagine, so this interaction is specific only to the zebrafish enzyme. No other hydrogen bond interactions with the protein, either direct or water-mediated, are observed for the inhibitor capping group.
Docking Studies and SARs.
Computational investigations were performed using the crystal structure of zfHDAC6 in comparison with hHDAC6 applying the docking protocol described in the Experimental Section, evaluating the performance of our docking protocol. All molecules were docked on HDAC1 and HDAC6 by using their (S) and (R) enantiomers (see supporting information). The most relevant docking results are herein discussed for selected molecules/enantiomers. Aiming at investigating the binding modes of the developed compounds into the catalytic sites of hHDAC1 and hHDAC6 enzymes and performing the SAR analysis, we combined experimental data (Table 1) with in silico investigation (human enzymes, Figure 5 and Figures S3–S15).28,29 Generally, for the selected compounds we observed a common trend in their binding mode with the HDAC6 enzyme, establishing higher number of contacts compared to HDAC1.
Figure 5.
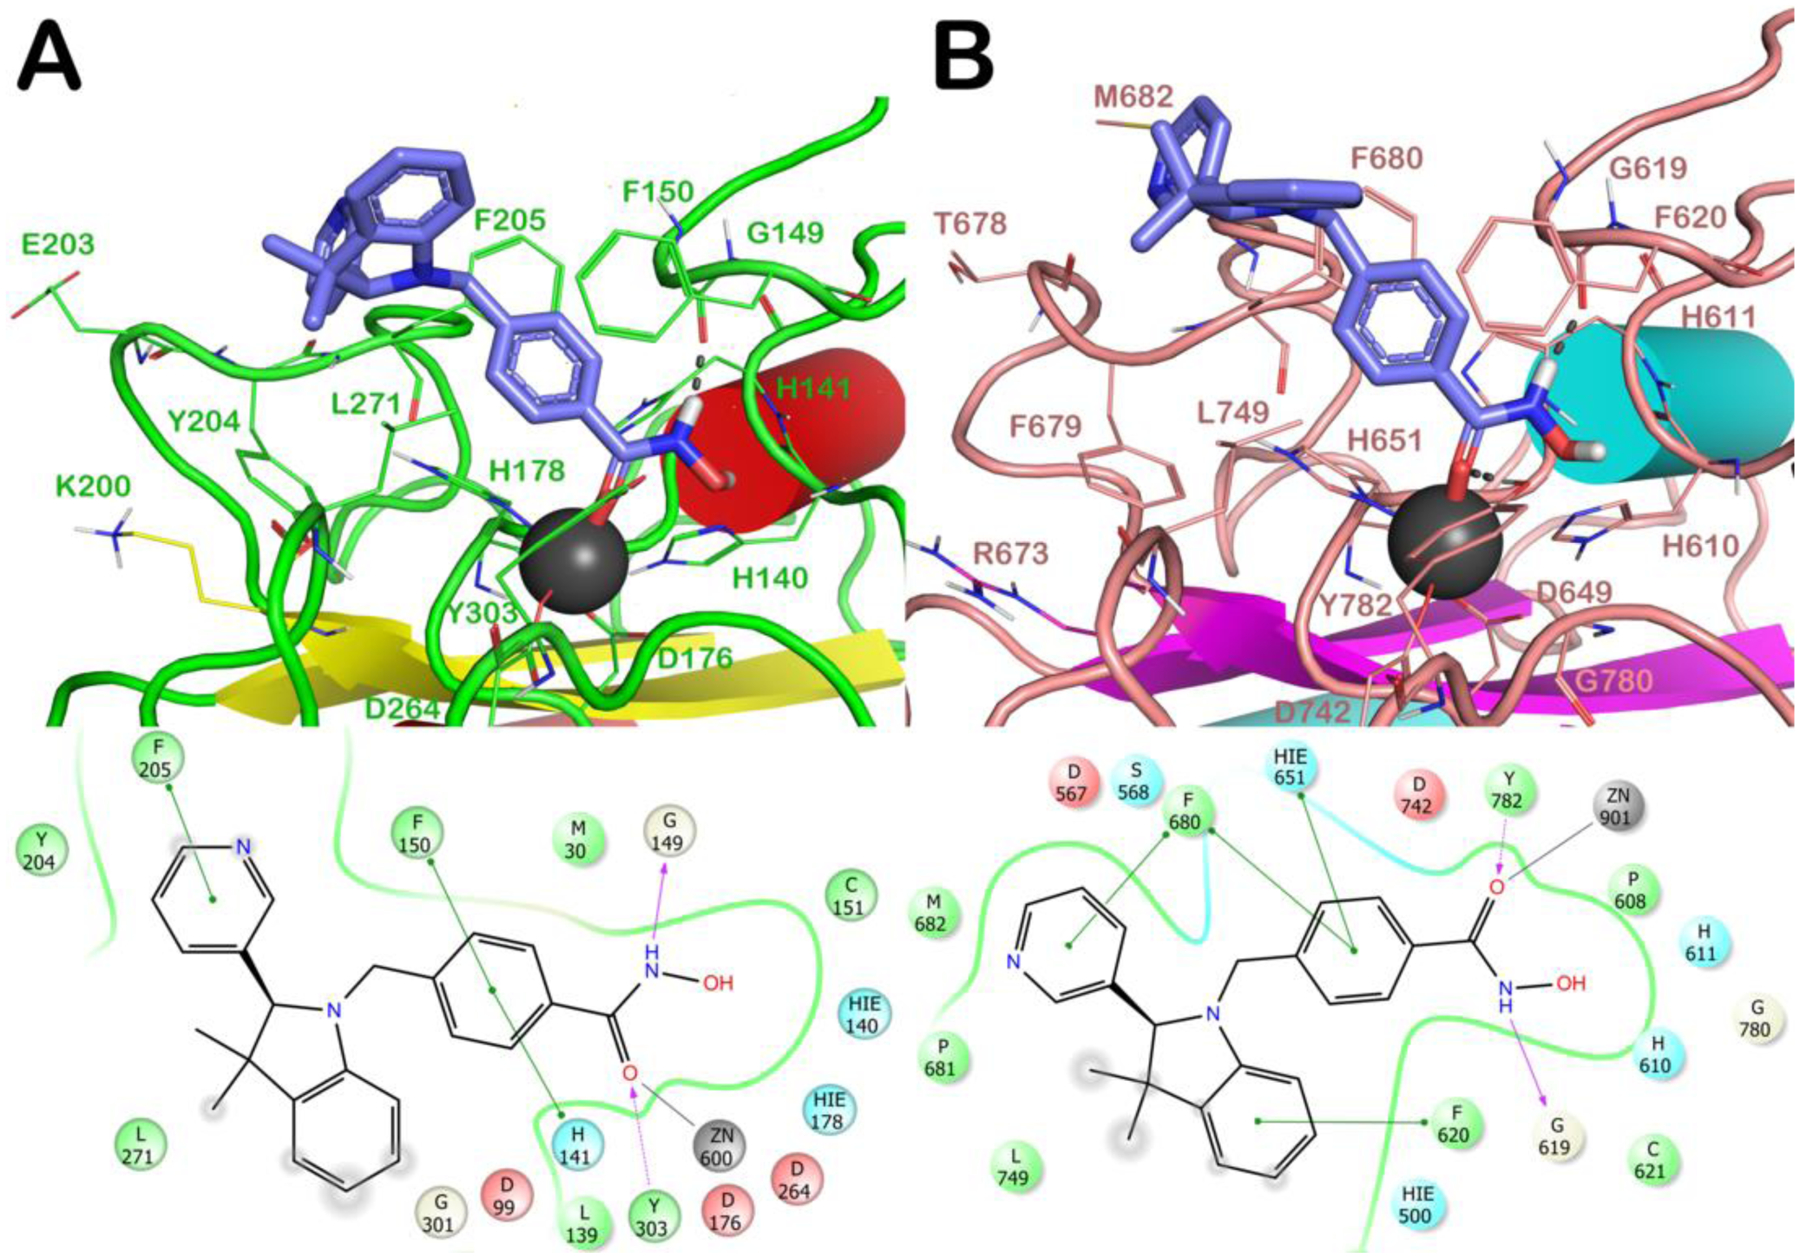
Docked poses of (S)-(−)-6h (light blue sticks) into HDAC1 (PDB ID 4BKX; panel A) and HDAC6 (PDB ID 5EDU; panel B). The residues in the active sites are represented as lines and the proteins are represented as cartoons. Zn2+ is represented as a gray sphere. H-bonds are represented as black dotted lines, while the red stick represents the metal coordination bond.
In particular, taking into account (S)-(−)-6h, complexed with zfHDAC6, when docked into hHDAC6 and zfHDAC6 it similarly accommodates in both enzymes,28–30 see SI for details (Figure S2). This study confirms that zfHDAC6 could be a valuable model for translating the results of potential inhibitors to the hHDAC6.31
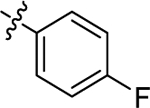
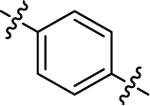
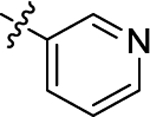
When docked in zfHDAC6, both enantiomers of 6a, besides the metal coordination, with their hydroxamate moiety target G619 and Y782, the benzyl linker forms a π-π stacking with H651 and F680 while the benzyl substituent establishes a π-π stacking with F679. The cap-group establishes hydrophobic contacts with F620 and L749. The higher number of contacts of 6a reflects its higher affinity for HDAC6 over HDAC1 (IC50 values: HDAC1 = 4290 nM; HDAC6 = 73.2 nM) (see SI for detailed discussion of the docking results on HDAC1). The introduction of Cl at p- or m- position of the phenyl ring (6b and 6c, respectively) did not substantially modify the binding mode retrieved for 6a. The same was true after the introduction of a p-F-phenyl (6e) or a pyridin-3-yl (6f) at C2 (see SI). Among the halogenated analogues the o-F-phenyl substituent at the chiral C2 of 6d (Figure S6) favored beneficial interactions with F679 and H651 residues when in R configuration. The replacement of the spiro N-methylpiperidine moiety by two geminal methyl groups at the 3-position of the indoline system of 6a led to analogue 6g. 6g showed similar contacts to spiro-fused analogues (6a-f, m) for both enantiomers ((S)-6g: π-π stacking with H651 and F680; the cap-group with F620; (R)-6g lacks the contact with F620). The introduction of a pyridin-3-yl substituent at 2-position of the indoline core of 6g led to analogue 6h. The docking output for the 6h S-enantiomer on HDAC1/6 isoforms is reported in Figure 5 (R-enantiomer in Figure S10). In HDAC1 active site, 6h established critical π-π stackings involving the benzyl linker (H141 and F150) and the cap group (F205) (Figure 5A). The R-enantiomer (Figure S10A) establishes, in addition to the contacts of the hydroxamate moiety, a π-π stacking with H141 (benzyl linker) and with Y204 (cap-group). Figure 5B highlights the contacts of (S)-6h with HDAC6: the benzyl linker interacts with H651 and F680 (π-π stacking) while the pyridine at C2 with F680. Interactions of (R)-6h are shown in Figure S10B. Docking data support the higher affinity of 6h for HDAC6 (IC50 HDAC1 = 5330 nM; IC50 HDAC6 = 41.9 nM).
A similar result was obtained when a methoxy substituent was introduced on the cap-group of 6h, obtaining compound 6i (Figure S11, IC50: HDAC1 = 5320 nM and HDAC6 = 67.2 nM).
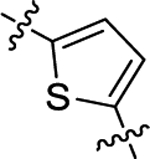
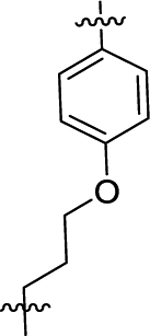
The replacement of the benzyl linker of 6h with a thienylmethyl linker (6j) or a propyloxybenzyl system (6k) caused a large drop in potency against the HDAC6 enzyme (Figures S12–13). The introduction of a pyridin-4-yl at C2 (6l) confirmed the same interactions observed for 6h.
The N-Me group of 6f was also replaced by a Boc group (6m), establishing contacts into HDAC1 and HDAC6 similar to those identified for other analogues (Figure S15) indicating that the protonatable function is not critical for binding HDAC enzymes.
In addition to hHDAC1 and hHDAC6, the potency of three representative inhibitors (6d,h,l, Table 2) was assessed on the hHDAC8 isoform, which represents a unique member of the class I HDAC family. HDAC8 is endowed with the ability to recognize both histone and non-histone substrates. This isoform is ubiquitously expressed, and it is localized either in the nucleus or in the cytoplasm.34 Discrimination between hHDAC6 and hHDAC8 binding sites was achieved and analogues 6d, 6h, and 6l demonstrated low potency against HDAC8 (IC50 in a range of 2.17 – 4.64 μM, Table 2).
Table 2.
Inhibitory activity of compounds 6d,h,l, as IC50 (μM), against the hHDAC8 enzyme.a
Concentration range of all compounds (40 nM-50 μM) was determined using the reference compound TubA and the results are expressed with standard deviations.
HDAC6 is a privileged target of this new series: Western blot analysis
The selectivity issues for HDACi is a crucial point in HDAC research, however, the reliability of in vitro enzymatic tests on all the 11 HDAC isoforms is debatable, as recently pointed out.35 Accordingly, for assessing HDAC6 preferential interaction, the most potent and interesting analogues (6a,6d,6e,6h and 6l) were engaged in experiments in living cells. We performed our cell-based assays by using three cancer cell lines including hematological (NB4, acute promyelocytic leukemia) and solid (U2OS, osteosarcoma and U87, glioblastoma) cancer cells. In all these cells the levels of tubulin acetylation (the client protein of HDAC6) and acetylation of histone H3 (the primary substrate HDAC1 and other nuclear HDACs) were evaluated after incubation of our compounds at 5 μM for 30 h (Figure 6). Under these conditions, in NB4 and U87 cells the analogues 6a, 6e, 6h and 6l efficiently inhibited HDAC6, inducing a marked acetylation of tubulin. At the same dose histone H3 acetylation was unchanged, hinting to the preferential interaction of this set of compounds towards the HDAC6 enzyme, with respect to HDACs1/8. Conversely, compound 6d, although equally effective in inhibiting HDAC6, also induced the acetylation of histone H3, proving to be slightly less selective. When compounds 6h, 6l, and 6d were tested in the U2OS cell line, we observed different results and only 6l demonstrated to preferentially promote acetylation of α-tubulin. In this case, it cannot be excluded that the specific characteristics of U2OS cell line (e.g. the alternative lengthening of telomeres)36 may play a role in the response to HDACi.
Figure 6. Western blot experiments to evaluate HDAC6 selectivity over HDAC1.
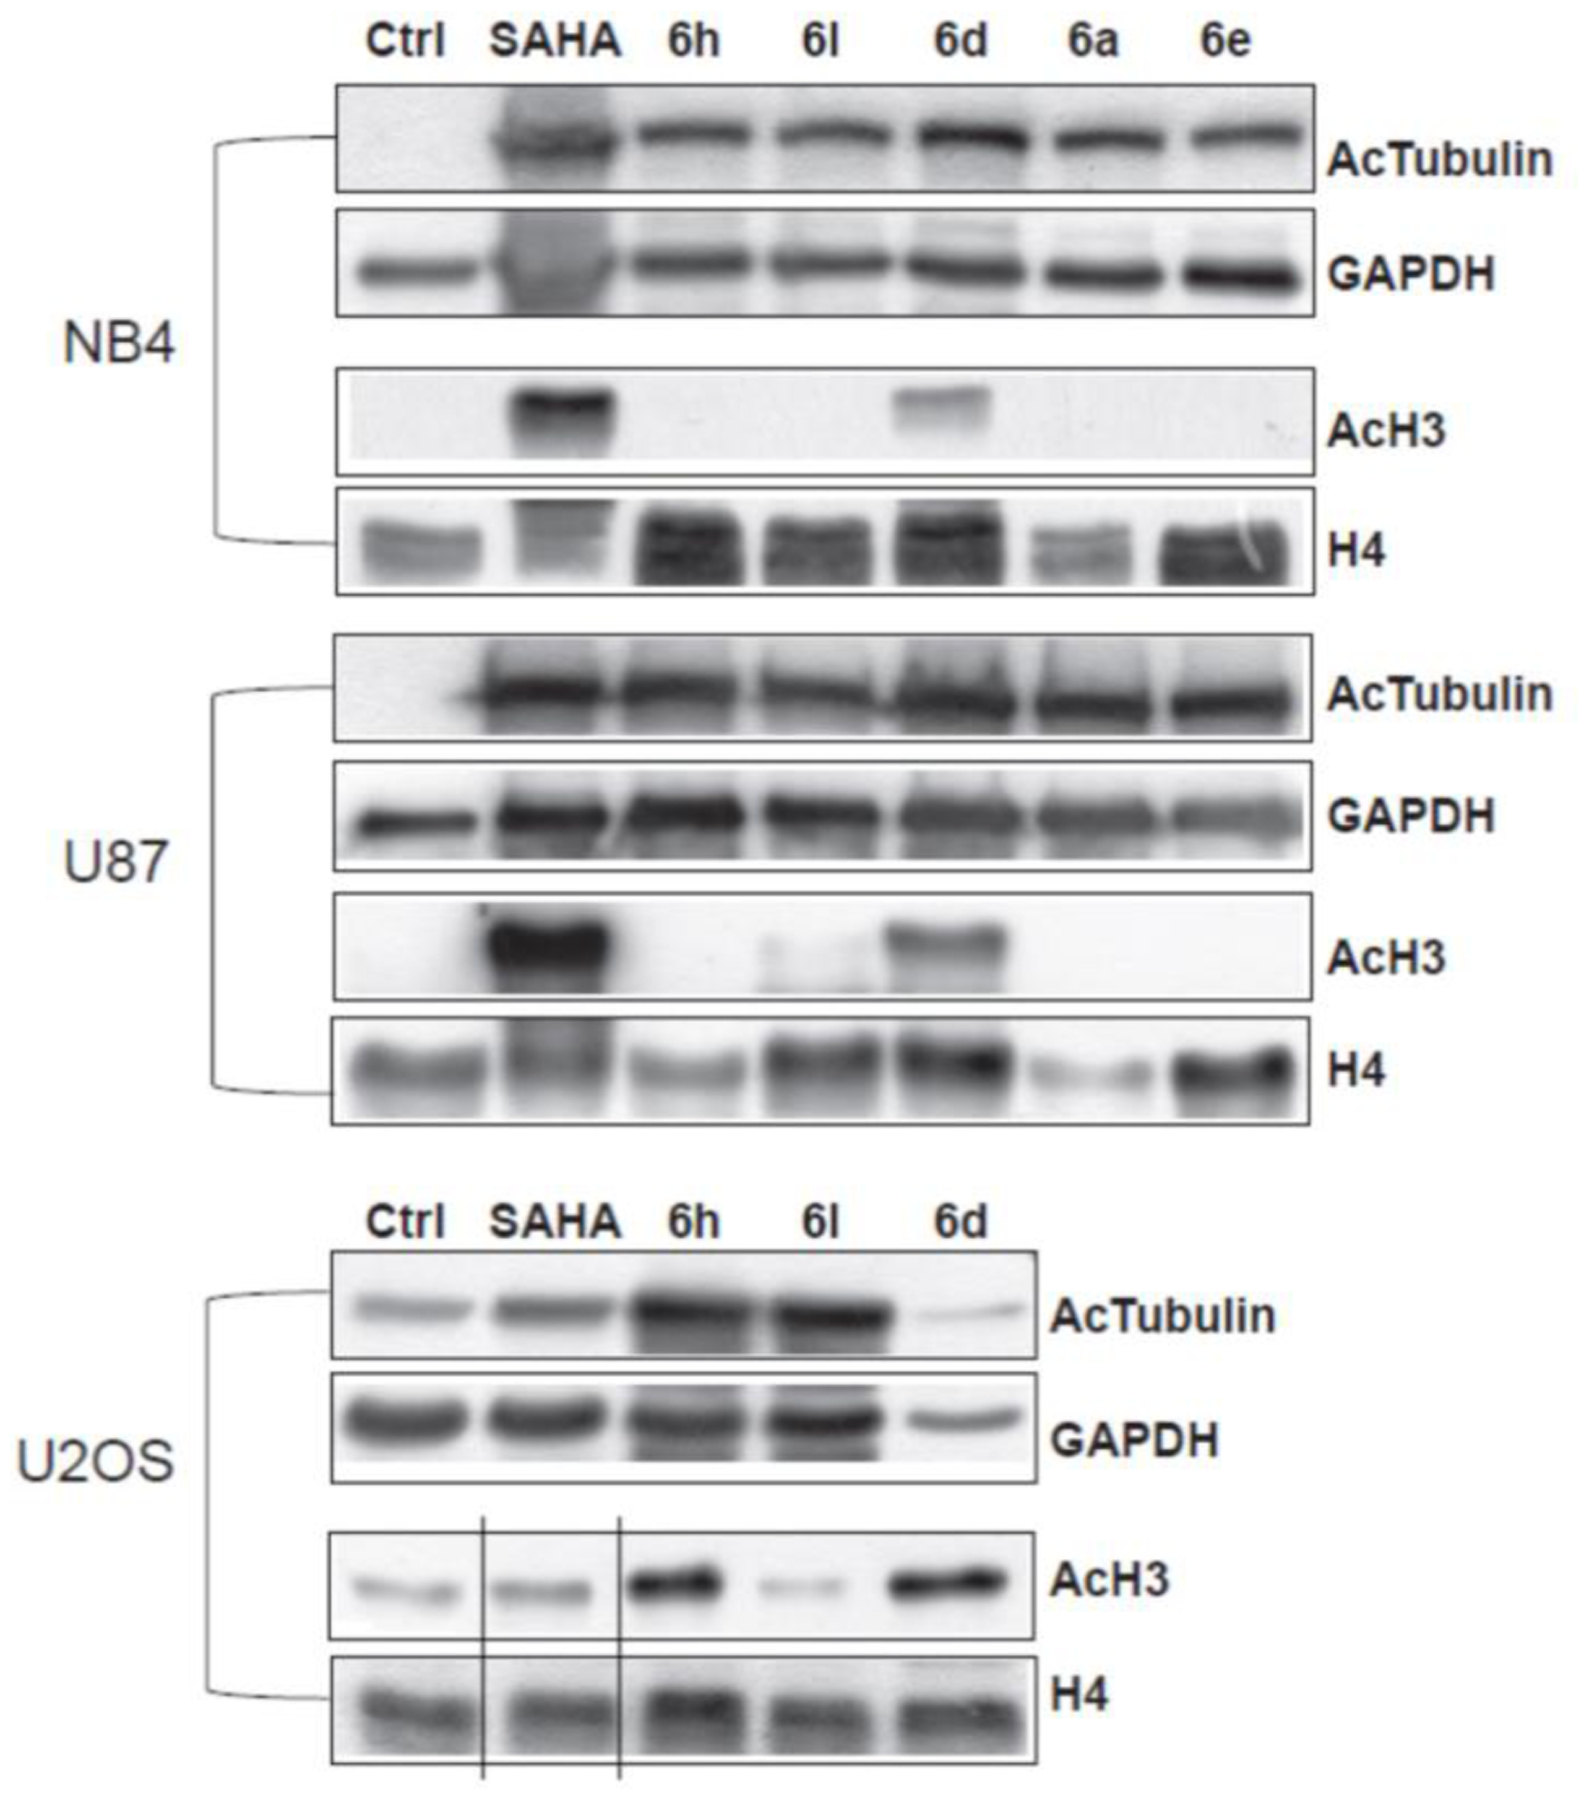
Acetylation levels of the α-tubulin (AcTub) and histone H3 in NB4, U87 and U2OS cell lines treated with the compounds 6a, 6d, 6e, 6h, and 6l at 5 μM for 30 h. SAHA was used as a positive control at the same time and concentration. GAPDH and H4 were used as loading controls.
HDAC6 overexpression in IPF lung tissues.
It was recently demonstrated that the accumulation of airway basal cells (ABC) in lung tissues from IPF patients was associated with a lower survival rate, suggesting that these cells play an important profibrotic role in IPF progression.37 By the bronchoalveolar lavage (BAL) transcriptome analysis of three independent cohorts of IPF patients we have recently shown that genes, exclusively expressed by ABC, are enriched in the BAL of patients with poor outcome.37,38 Lung tissue data demonstrated the accumulation of ABC in IPF and our own data suggest a profibrotic role of these cells. Recent single cell RNAseq analyses and immunohistochemistry data of IPF tissues showed ABC to be shifted towards an EMT phenotype and HDAC6 is crucial to TGF-β induced EMT.37 Accordingly, analysis of the BAL transcriptome from IPF patients showed a marked increase in the expression of genes exclusively expressed by ABC.37 Immunohistochemistry highlighted HDAC6 expression in 3D organoids derived from ABC from IPF patients which build bronchospheres. HDAC6 is highly expressed by the outer rim of ABC of the bronchosphere structure. Immunohistochemistry for HDAC6 expression also revealed high HDAC6 expression of ABC derived from IPF patients. These data and cell RNA sequencing analyses of IPF tissues showed that ABC were shifted towards an EMT phenotype that is induced by TGF-β, which in turn is regulated by the activity of the HDAC6 enzyme.19 Further studies showed a profibrotic effect of ABC derived from IPF patients,39 which prompted us to analyze the expression of HDAC6 in normal and in lung tissues derived from IPF patients. Immunohistochemistry of lung tissues derived from IPF patients confirmed HDAC6 overexpression in fibrotic lungs (Figure 7).
Figure 7. HDAC6 overexpression in IPF lung tissues.
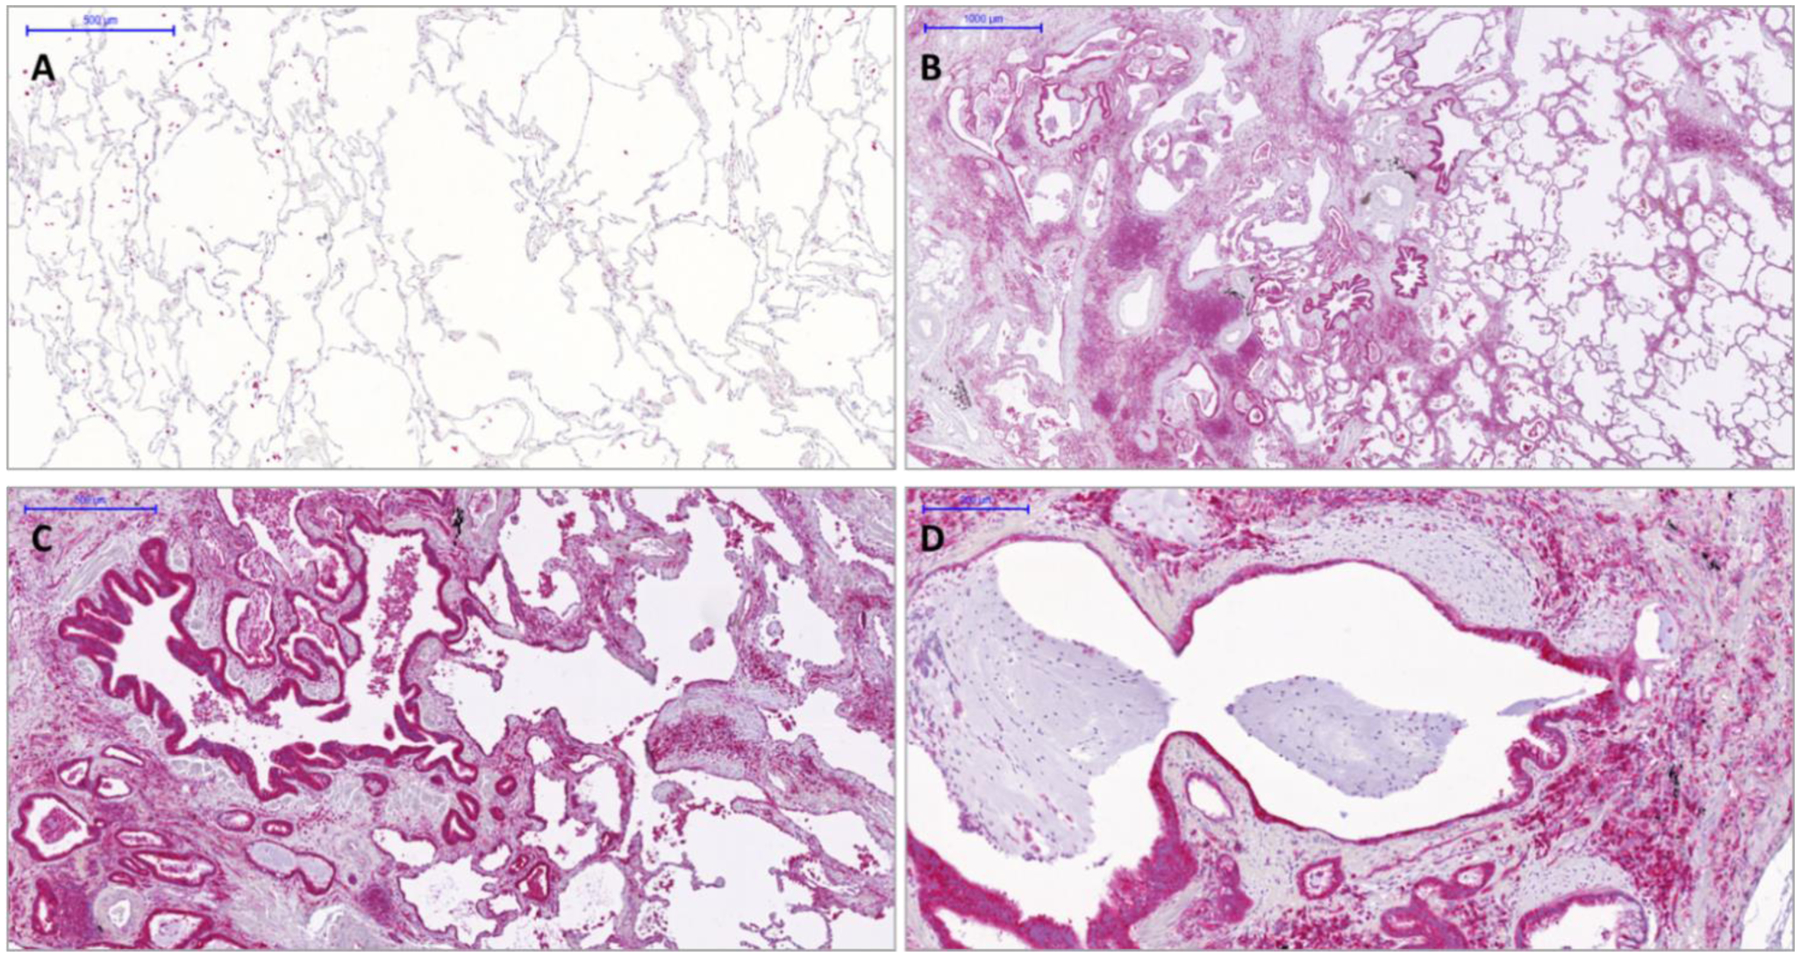
Immunohistochemistry of HDAC6 in normal (Panel A) and IPF lung tissues (Panels B-D). In IPF lungs HDAC6 is highly expressed in ABC covering fibroblasts foci or honeycomb cysts as well as by macrophages and lymphocytes. Notably, in normal lungs alveolar macrophages expressed HDAC6.
To investigate the potential of the new HDAC6 inhibitors, functional and gene expression studies were performed on ABC obtained by routine bronchoscopy using bronchial brushes in accordance with a standardized protocol and lung tissues derived from explants. In addition, we investigated the functional role of TGF-β, EMT, and HDAC6 in our recently established 3D organoid assay.39 Further details about 3D organoid culture preparation are shown in Figure S16. Sphere formation was counted by bright field microscopy and cell viability was quantified with aid of an MTT assay.
HDAC6 overexpression as a key element in cell migration, proliferation, and fibrotic remodeling by ABC.
The best performing compounds (6a, 6d, 6h and 6l) resulting from the enzymatic assay were chosen as potential hit compounds for IPF treatment and tested in the 3D organoid assay (Figure 8). The molecules were tested in a concentration range of 0.1 nM to 50 nM for 14 days with ABC derived from IPF patients (n = 3). The sphere counts (dots) and MTT assay demonstrated a strong reduction in sphere formation and cell proliferation at 50 and 20 nM (Figures 9–10). The best compounds of the series 6a (IC50 = 1.73 nM), 6d (IC50 = 3.31 nM), 6h (IC50 = 5.15 nM) and 6l (IC50 = 4.61 nM) were highly effective in reverting the IPF phenotype and determined a complete inhibition of spheres formation (Figure 9, Panels A-D) and in cell proliferation assay (Figure 9, Panels E-H). These data evidence the pivotal role of HDAC6 inhibitors, such as 6a, 6d, 6h and 6l, that may represent promising hit compounds for the development of novel small molecules as useful pharmacological tools for IPF treatment.
Figure 8. The newly generated HDAC6 inhibitors showed a concentration-dependent inhibitory effect on bronchosphere formation in 3D organoid cultures derived from IPF ABC.
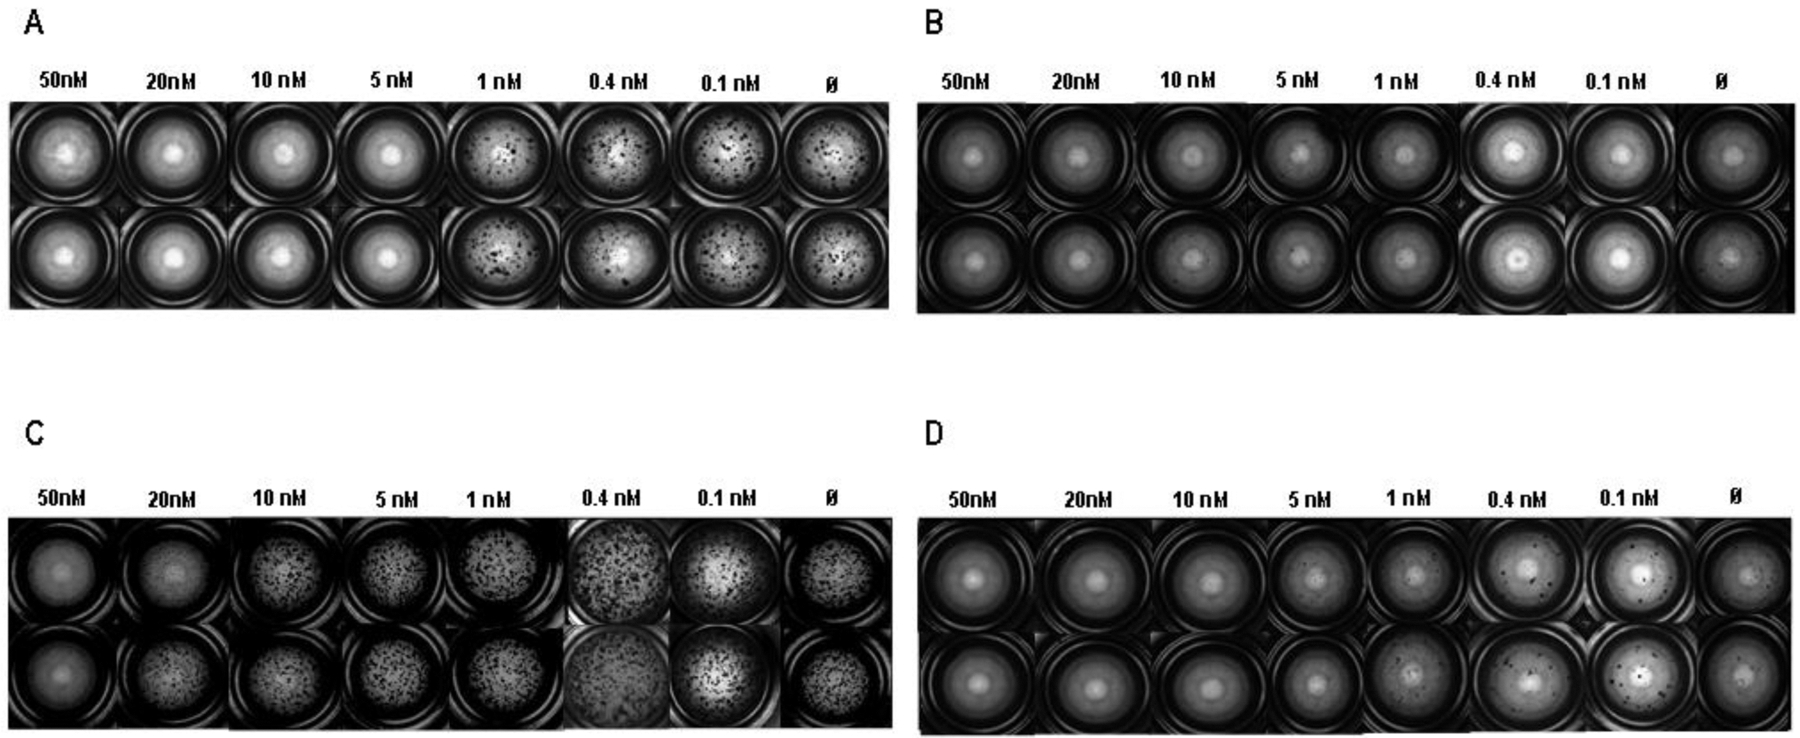
(A-D) ABC of IPF patients (n = 3) in 3D organoid cultures were stimulated for 14 days with the newly developed HDAC6 inhibitors 6a (A), 6d (B), 6h (C), 6l (D) in a concentration range from 0.1 to 50 nM. Bright field microscopy mosaic images of one representative experiment were taken with an Observer.Z1 Zeiss microscope and exemplary registrations are depicted.
Figure 9. Bronchosphere generation was completely blocked by newly developed HDAC6 inhibitors.
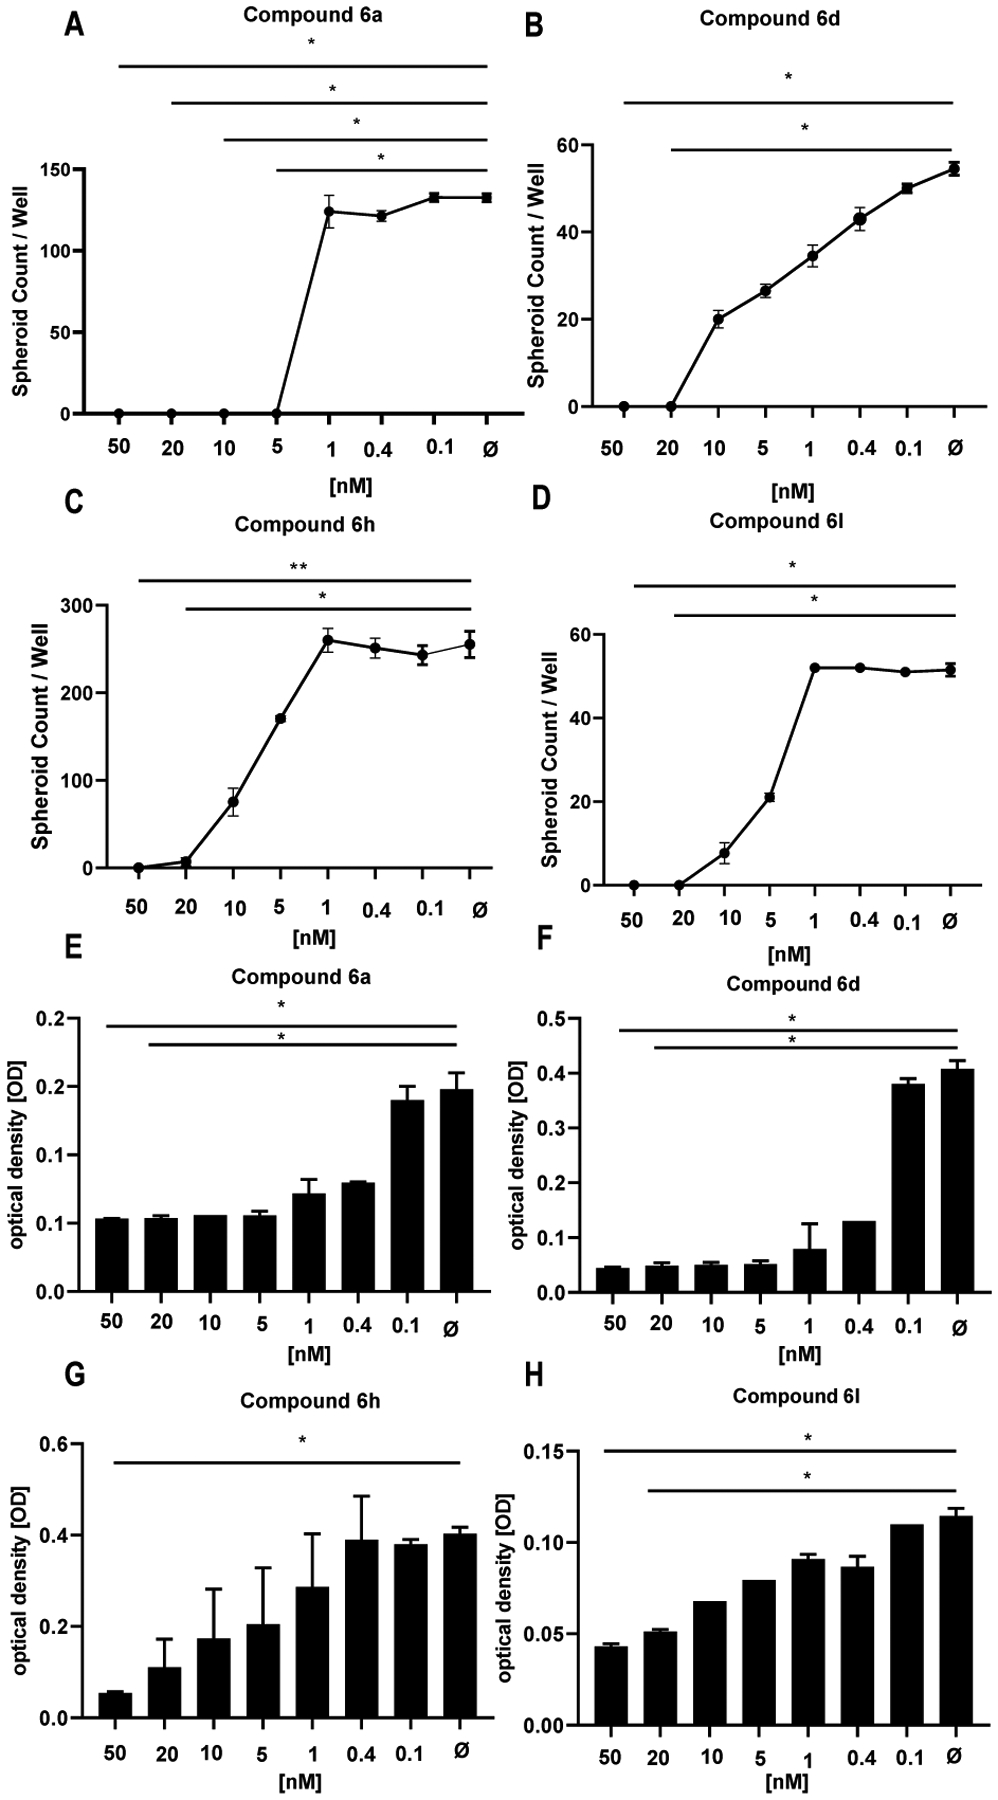
Bronchosphere counts derived of ABC from IPF patients (n = 3) were obtained (A-D, 6a, 50 nM: p = 0.044, 20 nM: p = 0.044; 6d, 50 nM: p = 0.0161, 20 nM: p = 0.0161; 6h, 50 nM: p = 0.0229, 20 nM: p = 0.0229; 6l, 50 nM: p = 0.0047, 20 nM: p = 0.0307) and cell proliferation was tested by MTT assay (E-H, 6a, 50 nM: p = 0.023 20 nM: p = 0.044; 6d, 50 nM: p = 0.0113, 20 nM: p = 0.0228; 6h, 50 nM: p = 0.0163; 6l, 50 nM: p = 0.0053, 20 nM: p = 0.0441) in the presence of several HDAC6 inhibitors such as compound 6a (A, E), 6d (B, F), compound 6h (C, G) and compound 6l (D, H) in a concentration range of 1 to 50 nM. Bronchosphere counts and optical density values derived from the MTT assay correlated well. The data indicate mean ± SEM from triplicate measurements, n = 3. For statistical comparison repeated measures ANOVA followed by Friedman multiple comparisons test was used.
Figure 10. HDAC6 inhibitors show a concentration dependent inhibitory effect on bronchosphere formation.
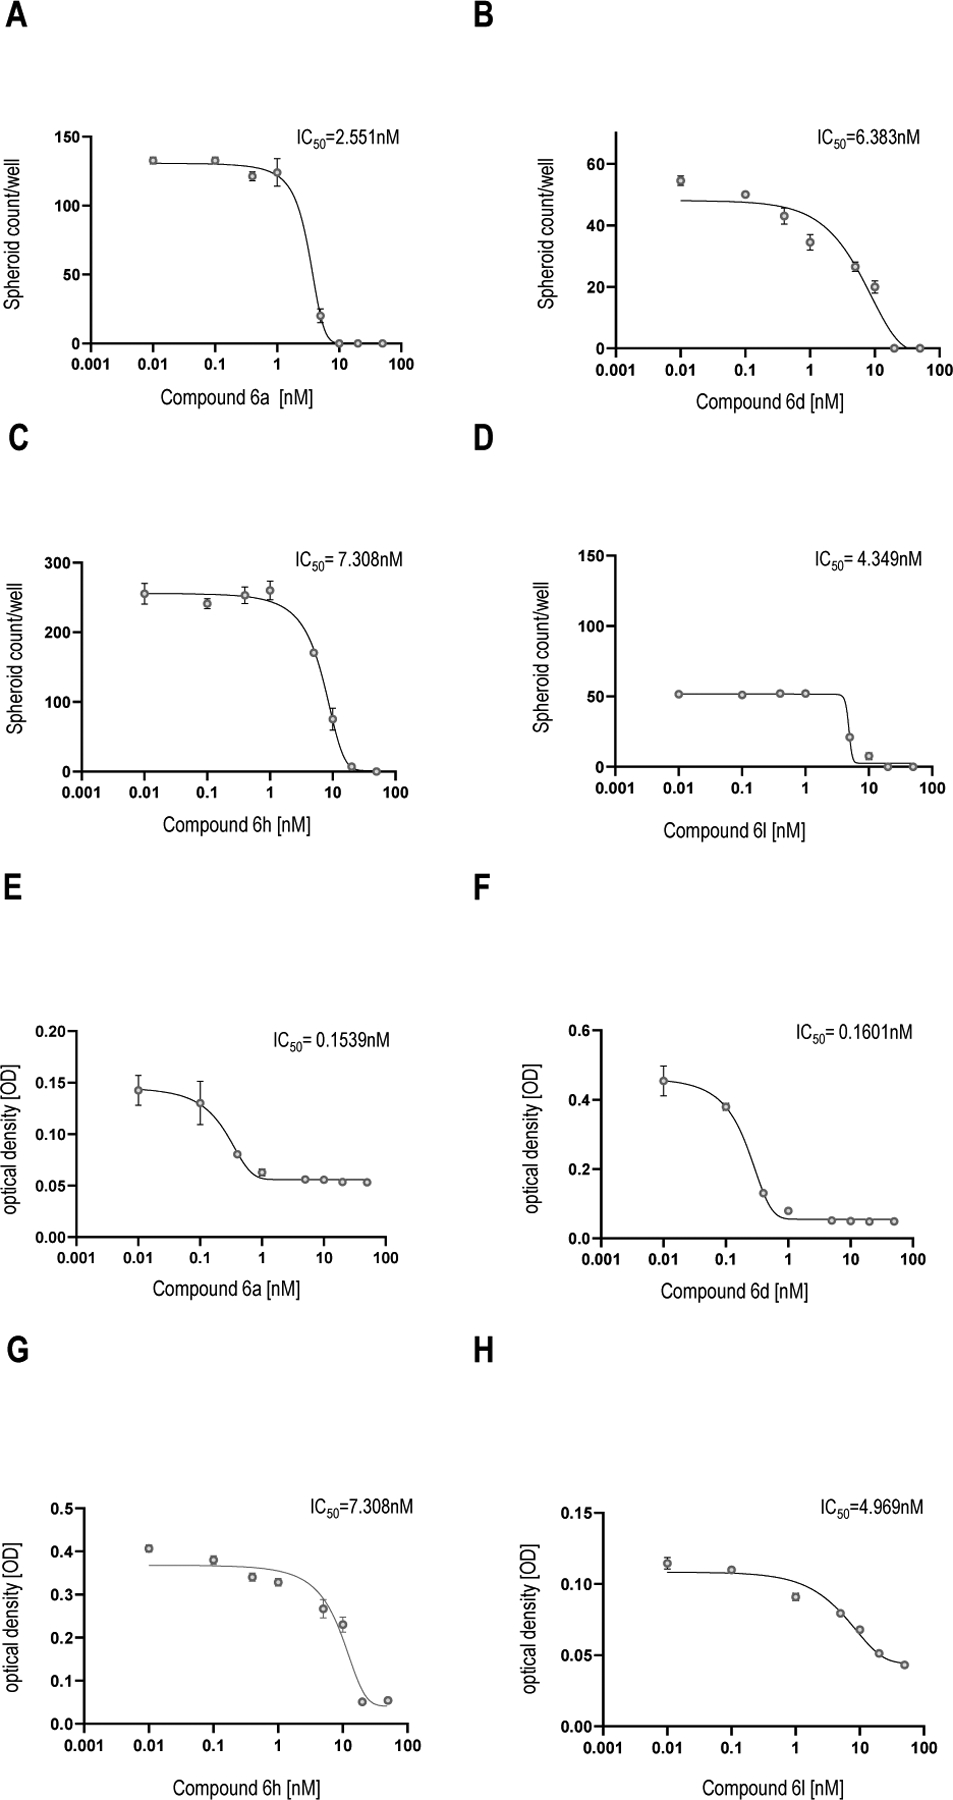
IC50 value were determined from bronchosphere counts and bronchosphere cell proliferation by GraphPad Prism 9 (mean ± SEM, n = 3). The mean value is determined from the IC50 value of the organoid counts and the MTT assay. Calculated IC50 values represents the concentration of the best HDAC6 inhibitor compounds 6a, 6d, 6h and 6l at which they exert their half of maximal inhibitory effect on bronchosphere formation in 3D organoid assay.
6h attenuates TGF-β1-dependent fibrogenesis in human lung tissue.
Having identified HDAC6 expression in healthy and IPF human lung tissue ex vivo, we tested the efficacy of 6h in a validated human lung model of TGF-β1-dependent fibrogenesis.40 mRNA RIN values were > 8 in all experimental conditions. As previously described, TGF-β1 significantly upregulated mRNA for the fibrosis-associated molecules α-SMA, collagens I, and collagen III in ex vivo human lung parenchyma over 7 days of culture (n = 6 donors, Figure 11A–C). TGF-β1 also significantly upregulated mRNA for the matrix protein fibronectin (Figure 11D). There was a trend towards increased expression for HDAC6 with TGF-β1 stimulation, but this did not reach statistical significance (n = 3 donors, Figure 11E). Compound 6h at the concentration of 4.1 μM significantly inhibited the mRNA expression for α–SMA, collagens type I and III, fibronectin, and HDAC6 in TGF-β1-stimulated lung tissue (Figure 11A–D and F). Taken together these data suggest that HDAC6 plays a critical role in profibrotic TGF-β1-dependent signaling human lung parenchyma, and that 6h may be an effective tool for the treatment of IPF.
Figure 11. HDAC6 inhibition attenuates TGF-β1-dependent pro-fibrotic gene expression in ex vivo cultured human lung parenchyma.
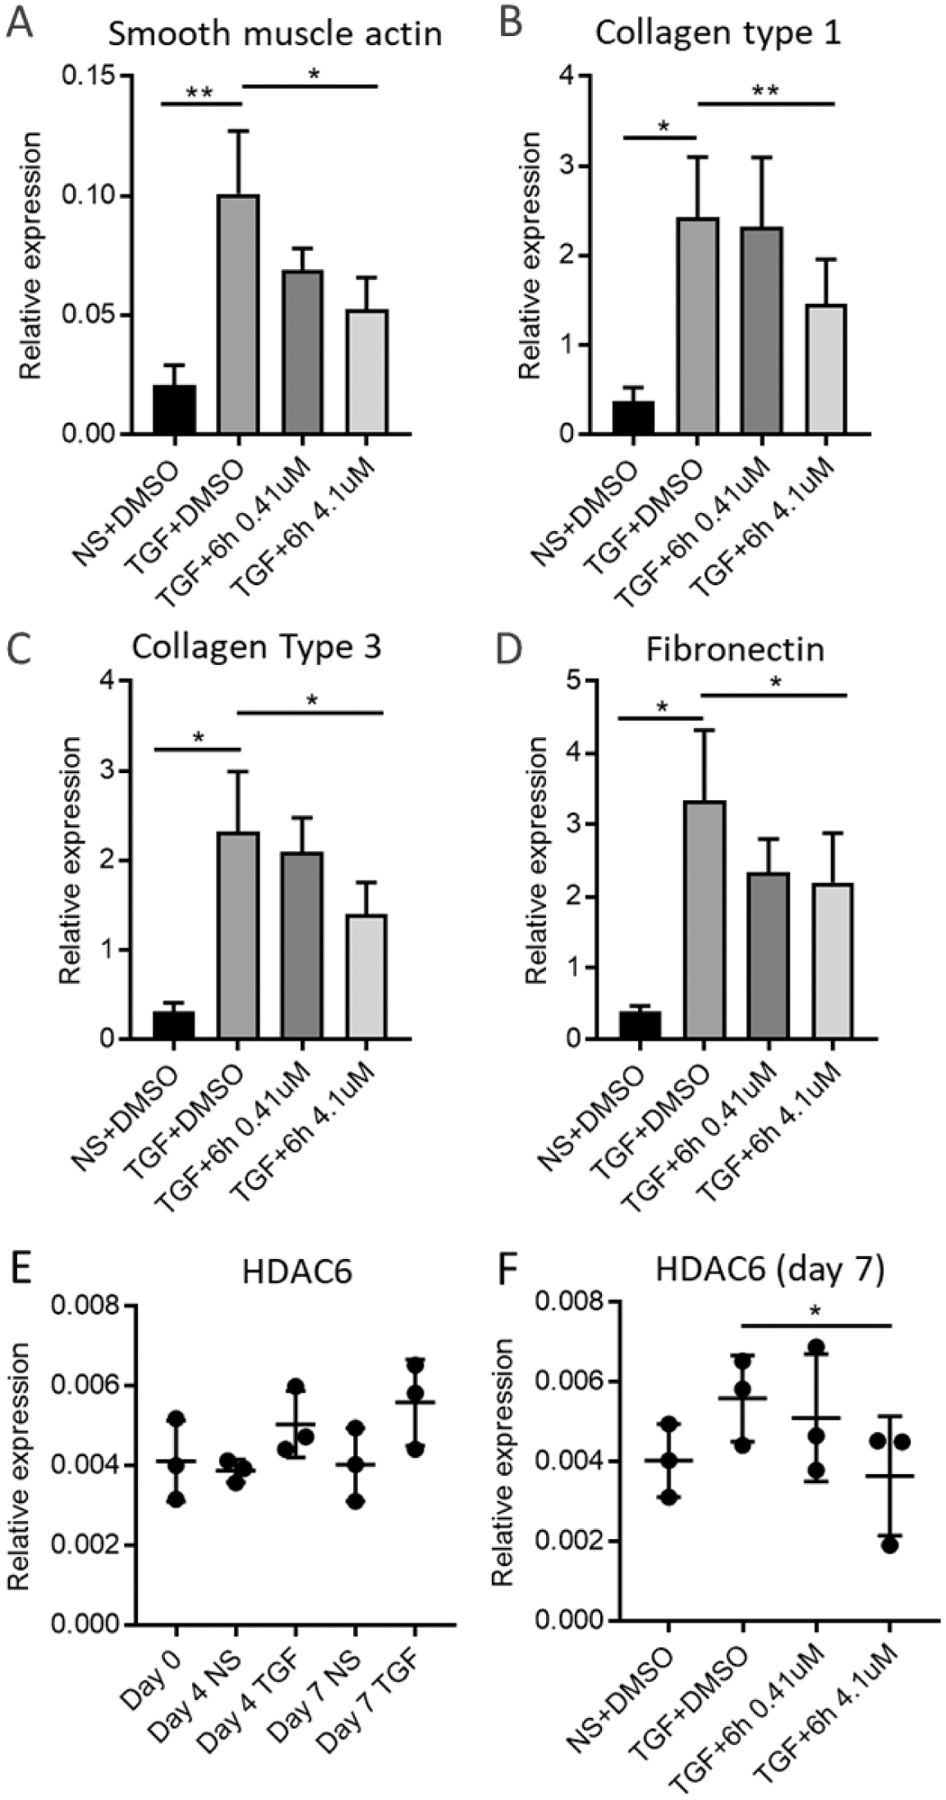
A) α-SMA actin mRNA expression is upregulated by TGF-β1 and inhibited by 6h 4.1 μM (n = 6). **p < 0.01, *p < 0.05, paired t test. B) Collagen type I mRNA expression is upregulated by TGF-β1 and inhibited by 4.1 μM (n=6) **p < 0.01, *p < 0.05, paired t test. C) Collagen type III mRNA expression is upregulated by TGF-β1 and inhibited by 4.1 μM (n=6). *p < 0.05, paired t test. D) Fibronectin mRNA expression is upregulated by TGF-β1 and inhibited by 4.1 μM (n = 6). *p < 0.05, paired t test. E) HDAC6 mRNA is expressed in human lung parenchyma (n=3). F) HDAC6 mRNA expression is inhibited by 4.1 μM (n=3), *p < 0.05, paired t test. NS = non stimulated.
Preliminary in vitro physico-chemical properties assessment and determination of geno- and cytotoxicity, and metabolic stability.
We assessed the solubility and chemical stability of compounds 6d and 6h. The solubility (at pH = 3 and 7.4, Table 2) and the chemical stability (at pH = 3, Table 3) of these compounds were measured by HPLC methods as previously reported.41,42 From our analysis, it emerged that both 6d and 6h exhibited favorable chemical stability and solubility profile at acidic pH. Instead, a significant difference in solubility at neutral pH was observed between the two compounds, with compound 6h being less soluble. This fact could be explained by the absence of the polar N-methyl-piperidyl moiety on the structure of this compound. However, both the solubility and chemical stability of these compounds can be considered satisfactory.
Table 3.
Solubility and chemical stability of compounds 6d and 6h.
| Compound | Solubility (μM) after 24 h | Chemical Stability (%) after 24 h | |
|---|---|---|---|
| pH = 3 | pH = 7.4 | pH = 3 | |
| 6d | 456 | 285 | 98 |
| 6h | 459 | 97 | 89 |
| TubA | 244 | 231 | nca |
nc: not calculated
In vitro studies were conducted to assess the metabolic stability of 6d and 6h in human liver microsomal preparations (HLM). The plot of non-metabolized compound [natural logarithm of % of compound recovery (100% at time 0 min)] as a function of incubation time showed a mono-exponential decay relationship (first order kinetic) for both substrates (Figure 12). The apparent decay constants (k), half-life time (t1/2), and intrinsic clearance (CLint) are reported in Table 4. The incubation of both compounds in HLM showed different behavior as confirmed by the t1/2 values (51.68 and 53.47 min for 6d and 6h, respectively). The similar values of CLint indicate that both 6d and 6h can be considered to possess intermediate properties in terms of metabolic stability.
Figure 12.
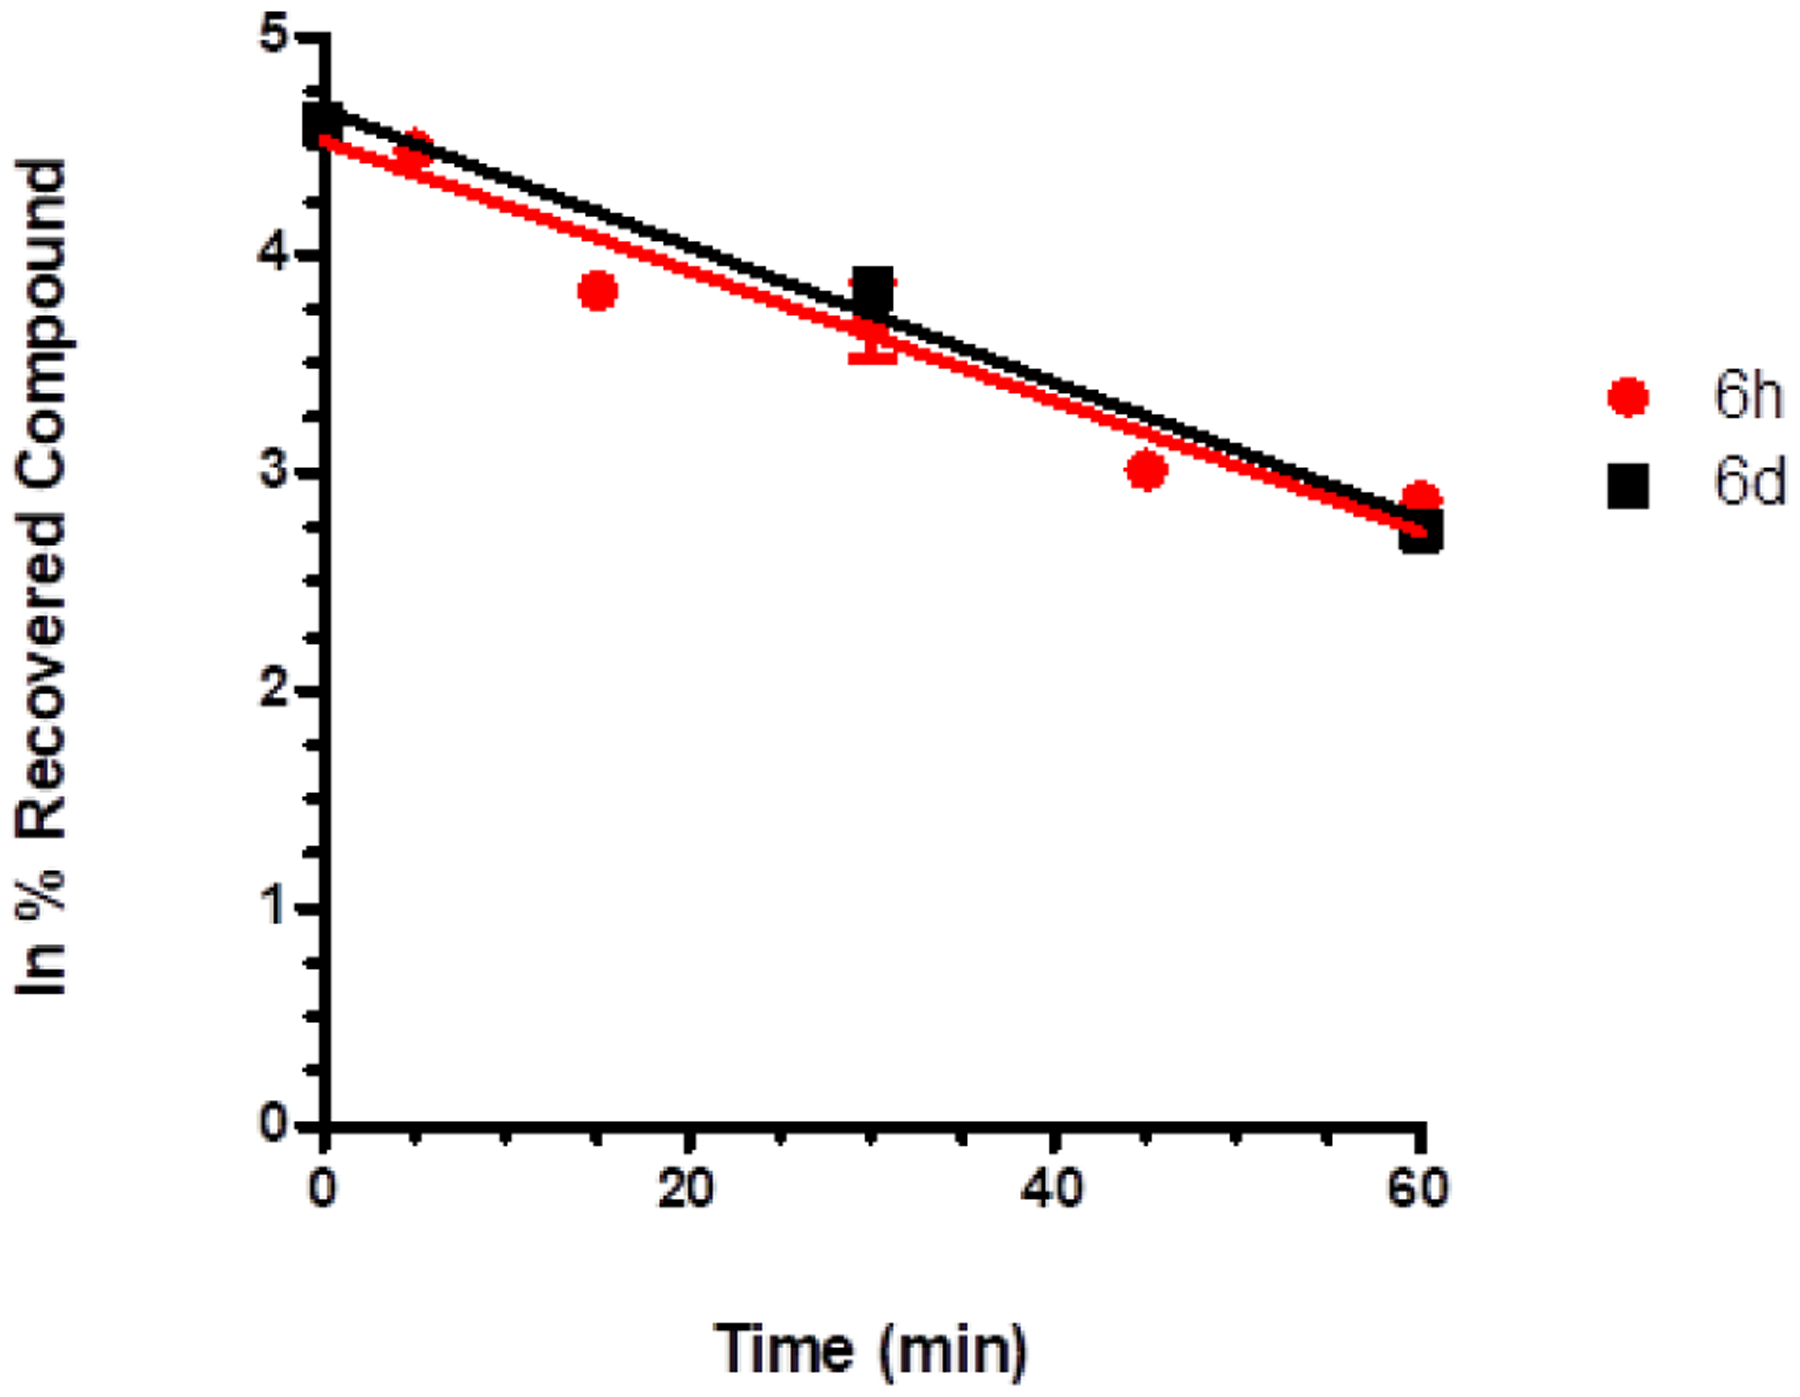
CYP-dependent metabolic depletion of 5 μM 6d (red line, three time points, at 0, 30, and 60 min) and 6h (black line, six time points, at 0, 5, 15, 30, 45, and 60 min) in HLM preparation. Results are presented graphically as a percentage of compound recovery (100% at time 0 min) as a function of incubation time. Data are presented as mean ± SEM, of three different experiments.
Table 4.
Kinetic parameters and metabolic stability of compounds 6d and 6h.
| Compound | k (min−1) | t1/2 (min) | CLint (μL/min/mg prot) |
|---|---|---|---|
| 6d | 0.01297 | 51.68 | 27.43 |
| 6h | 0.01357 | 53.47 | 25.46 |
| SAHA44 | 60 |
In silico analysis by means MetaSite software,43 for predicting the site of CYP-dependent metabolism, revealed that the hydroxylation of the aromatic ring is the most probable metabolite of both compounds. Moreover, these metabolites seem to be formed, preferentially, by CYP3A4 and CYP2D6.
The other CYP isoforms, such as CYP belonging to 2C family, seem to drive the metabolism towards the N-oxide formation.
Potential mutagenicity associated with the use of hydroxamic acid-based compounds poses a significant challenge in terms of their drug-like profile.45 To date, Givinostat is the only compound under clinical evaluation that has exhibited no mutagenic effect, while the FDA-approved drugs have shown mutagenicity.46 Therefore, we confirmed for compound 6h the lack of mutagenic effect in TA98 and TA100 strains of Salmonella typhimurium strains. The Ames test was employed to detect potential risks of mutagenicity at the early stages of drug development. The assay can be performed with or without the S9 fraction of rat liver. This latter condition allows an in-depth investigation for evaluating the risk of mutagenicity derived from the metabolites of the compounds under study. After applying both the experimental conditions, no mutagenic effect was observed for compound 6h at all tested concentrations (1–75 μM) (Figure 13). Besides the physicochemical parameters of the compounds, we experimentally determined additional features that might contribute to designate the most promising compound 6h as the potential hit of the series. Accordingly, we evaluated its potential cytotoxicity profile after incubation with mouse embryonic fibroblasts (NIH3T3 cell line). The viability of these cells, after incubation with 6h, are reported in Table 4 and are expressed as IC50 (μM). We observed that 6h showed toxicity only in the μM range with a TC50 of 75 μM, resulting in a highly safe profile for this compound (Table 5).
Figure 13.
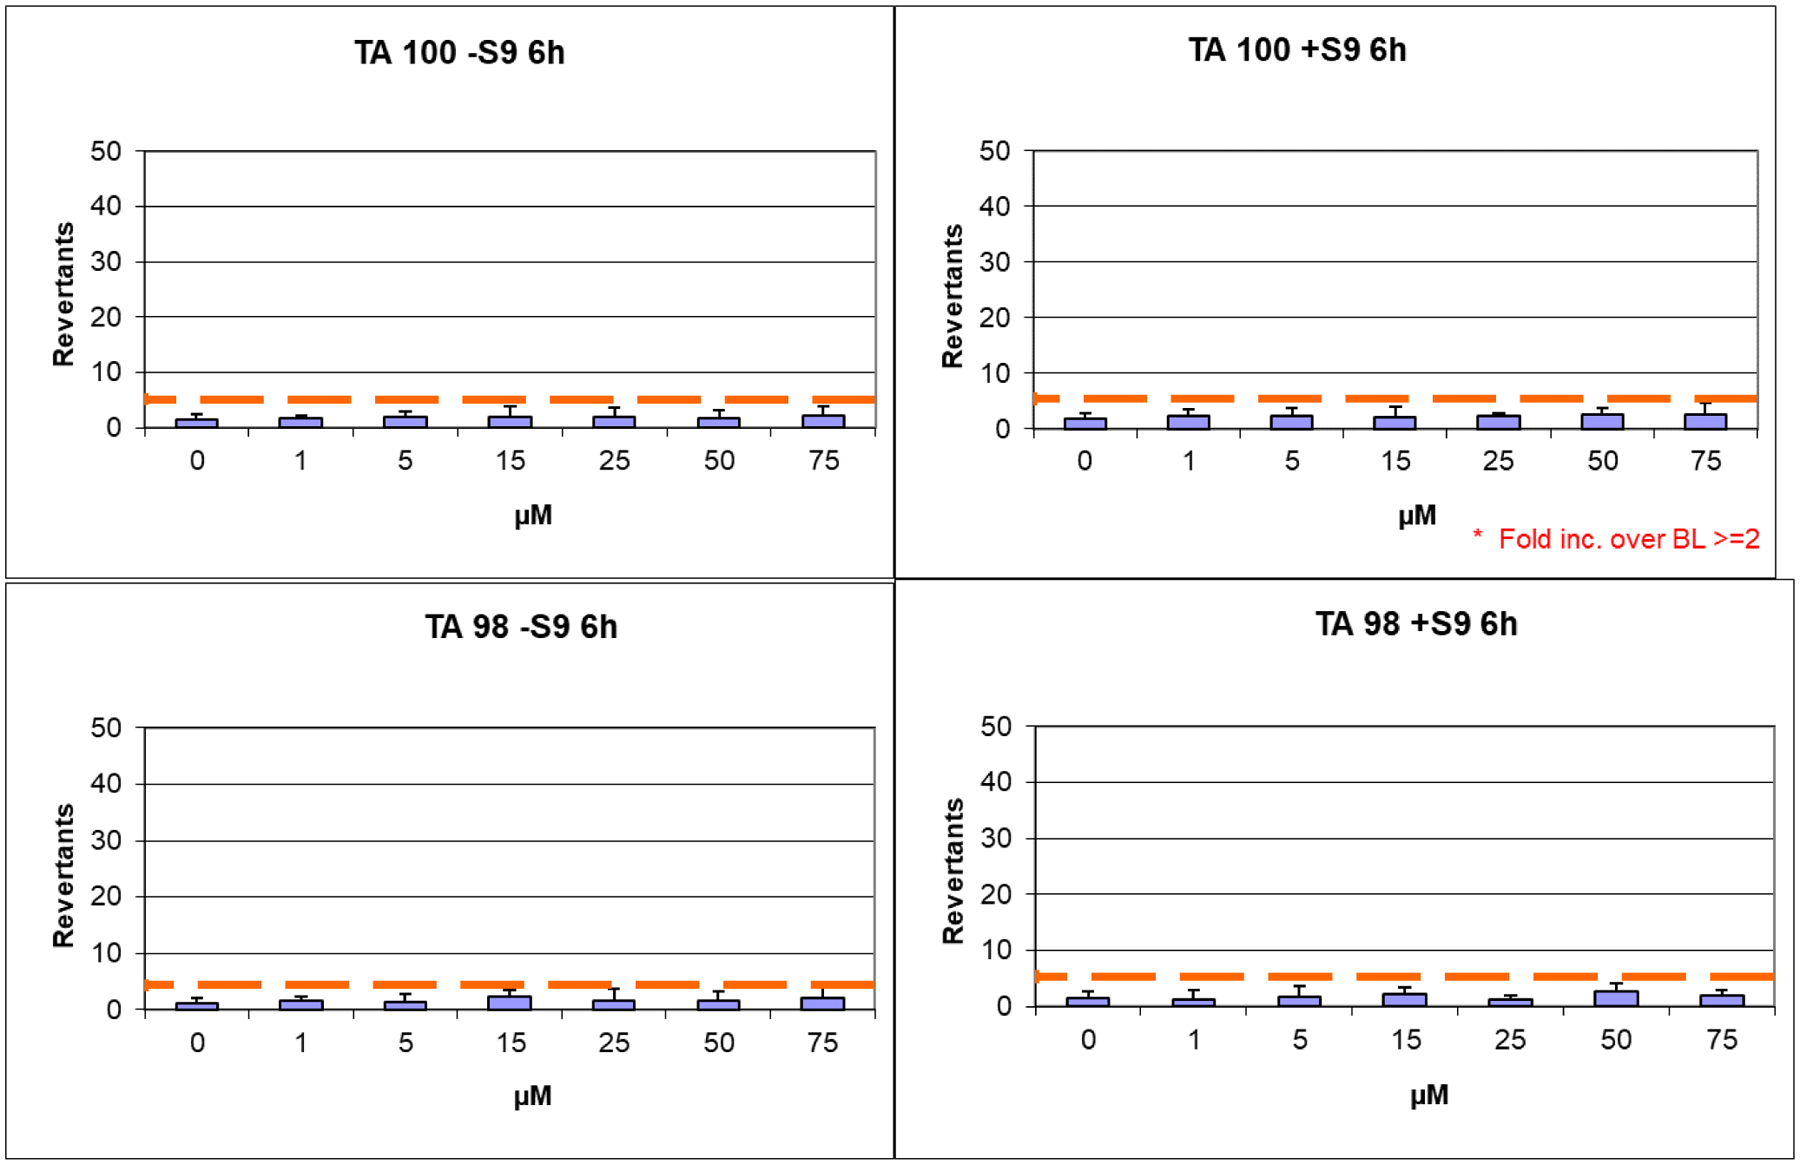
Ames test performed on S. Typhimurium TA98 and TA100 strains for compound 6h.
Table 5.
Viability of mouse fibroblasts NIH3T3 after incubation with different concentrations of 6h and reference HDAC inhibitor SAHA (%).a
| [μM] | 1 | 2 | 2.5 | 5 | 7.5 | 10 | 15 | 20 | 25 | 50 | 75 |
|---|---|---|---|---|---|---|---|---|---|---|---|
| 6h | 98 ± 6 | 94 ± 9 | *87 ± 5 | *71 ± 9 | *53 ± 10 | ||||||
| SAHA | *83±6 | *62±5 | *49±3 | *31±5 | *22±3 | *17±6 | *7±6 |
Cell viability was measured by the Neutral Red Uptake (NRU) test and data normalized as % control. Data are expressed as mean ± s.d. of three experiments repeated in six replicates.
Values are statistically different versus control, p ≤ 0.05.
Safety of 6h in a zebrafish model and in Langendorff perfused rat hearts.
There is a clear potential for zebrafish to provide valuable new insights into chemical toxicity, useful in the drug discovery trajectory, and human disease using recent advances in forward and reverse genetic techniques coupled with large-scale, high-throughput screening. Recently there is an increasing use of zebrafish in toxicology.47 Since zebrafish could provide a sound basis for the risk assessment of drug administration in humans, we decided to use this model to assess the toxic potential of 6h. Three days old zebrafish larvae were treated for 2 days with increasing doses of this compound (Figure 14A). 6h was well tolerated up to 50 μM instead, and only at 100 μM some larvae failed to inflate their swim bladder and presented mild cardiac edema, thus confirming the safety profile of this compound. Additionally, visual behavior analysis conducted on five days old larvae, revealed that there were no significant changes in larvae treated with compound 6h in comparison to vehicle control (0.1% DMSO) treated larvae, thus confirming that the drug is well tolerated (Figure 14B).
Figure 14.
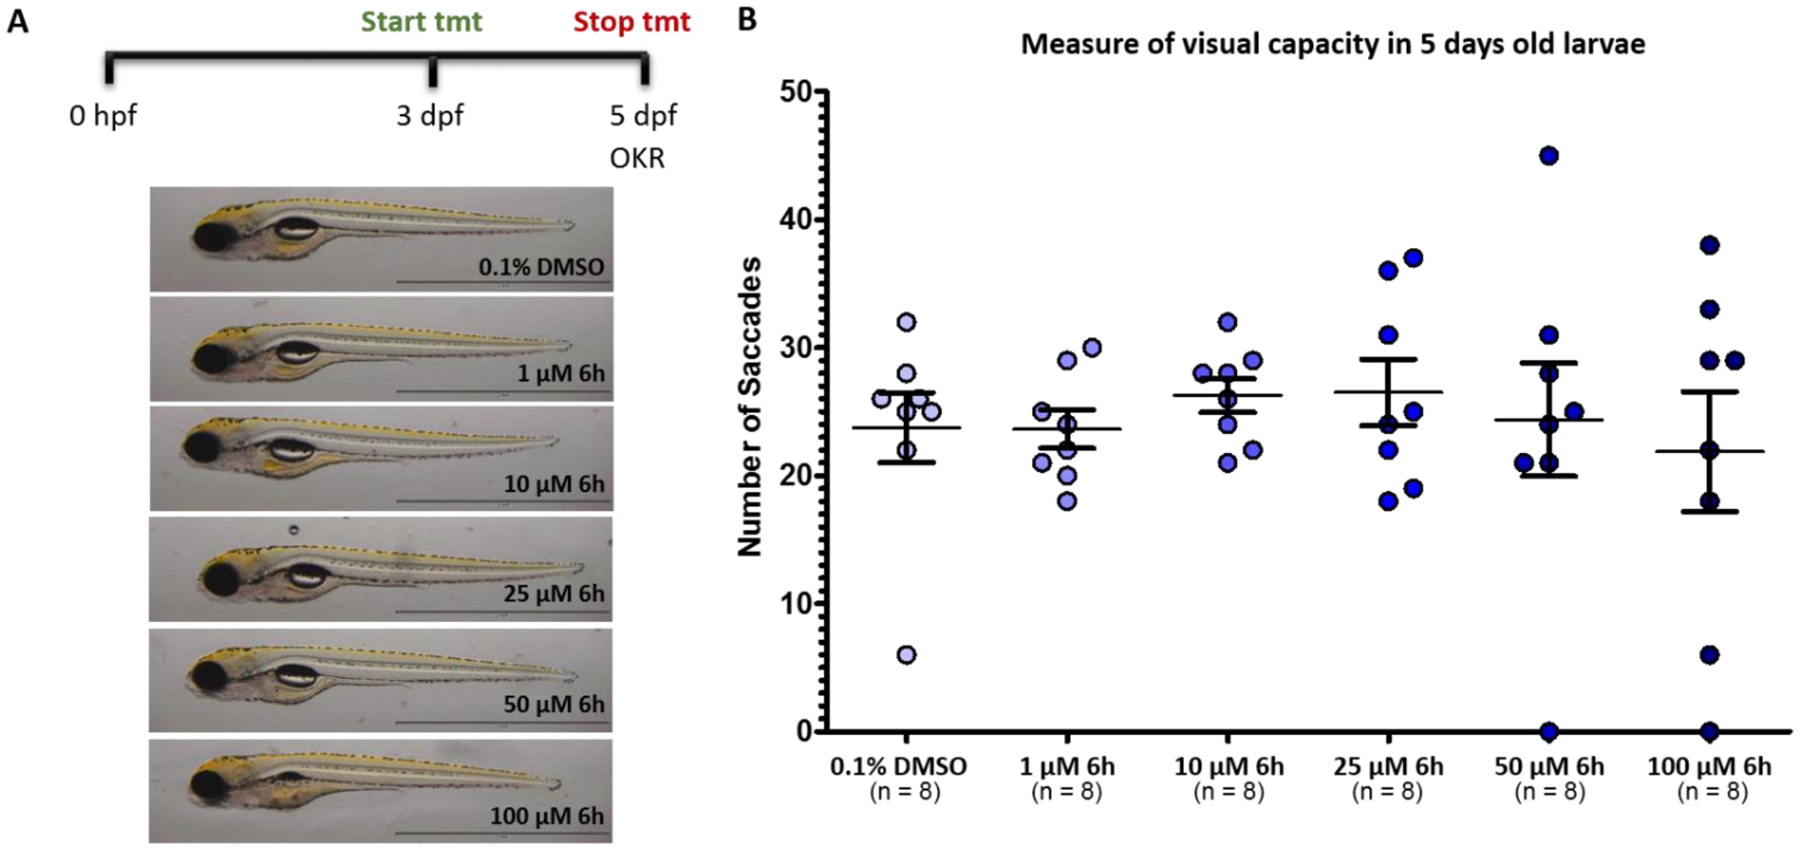
A) Toxicity screen of 6h in zebrafish model; B) Measure of visual capacity in 5-day post-fertilization (dpf) old larvae at different concentrations (1 to 100 μM).
Cardiovascular adverse effects contribute disproportionately to drug withdrawals from the market and represent one of the major hurdles in the development of new drugs. To evaluate the potential cardiovascular toxicity of compound 6h, its effect on cardiac mechanical function and the electrocardiogram (ECG) in Langendorff-isolated rat hearts was assessed, as previously described.48,49 Under control conditions, left ventricle pressure (LVP) and coronary perfusion pressure (CPP) values of 57.53 ± 7.19 and 52.30 ± 5.65 mmHg (n = 5), respectively, were obtained. At the maximum concentration tested (10 μM), 6h significantly increased LVP to 70.99 ± 10.15 mmHg and decreased CPP to 44.11 ± 3.53 mmHg. Moreover, at 10 μM, 6h significantly increased RR, PQ, QRS, though not QTc ECG intervals (Table 6). Therefore, these findings highlight that at the maximum concentration tested, which was however three orders of magnitude higher than that effective in hDAC6 inhibition, 6h exhibited positive inotropic, negative chronotropic, and coronary vasodilating activity, and prolonged the cardiac cycle length as well both the atrioventricular and intraventricular conduction time.
Table 6.
Effects of 6h on HR, RR, PQ, QRS, QT, and QTc in Langendorff perfused rat hearts
| 6h (μM) | HR (BPM) | RR (ms) | PQ (ms) | QRS (ms) | QT (ms) | QTc (ms) |
|---|---|---|---|---|---|---|
| none | 235.7±8.3 | 257.2±8.1 | 43.6±2.5 | 15.2±0.2 | 76.2±2.9 | 150.5±5.5 |
| 0.01 | 235.4±9.2 | 255.9±9.3 | 44.1±2.6 | 15.6±0.5 | 78.1±3.2 | 154.6±5.8 |
| 0.1 | 238.1±10.5 | 253.7±10.0 | 44.6±3.2 | 15.4±0.4 | 78.0±3.3 | 155.1±6.6 |
| 1 | 235.4±12.0 | 257.7±11.2 | 44.5±3.0 | 15.8±0.4 | 76.4±3.1 | 150.8±6.1 |
| 10 | 207.9±17.1** | 294.1±20.9** | 50.4±2.2** | 18.0±0.5** | 78.3±3.4 | 145.3±5.7 |
Each value represents mean ± SEM (n = 5).
P< 0.01, repeated measures ANOVA and Dunnett’s post-test). HR, frequency; RR, cycle length; PQ, atrioventricular conduction time; QRS, intraventricular conduction time; QT, duration of ventricular depolarization and repolarization, i.e., the action potential duration; QTc, corrected QT.
CONCLUSION
Combining structural analysis, bioinformatics, and molecular modeling efforts, we generated a series of new HDAC6 inhibitors, selective over hHDAC1 and hHDAC8. Synthetic accessibility, high potency, and an interesting preliminary pharmacokinetic profile, including low geno/cardio/cyto-toxicity, characterize the novel heterocyclic inhibitors of isoform 6, exemplified by 6h. Using 6h, we confirmed the lack of a stereoselective inhibition of HDAC6 since both enantiomers of 6h showed similar inhibition properties ((R)-6h IC50 hHDAC6 = 91 nM vs (S)-6h IC50 hHDAC6 = 71 nM), with the (R)-enantiomer much more selective over hHDAC1 (Table 1). The binding mode on HDAC6 was determined by X-ray crystallography using 6h in complex with zfHDAC6. SARs of the new inhibitors were analyzed by docking protocols using human enzymes. Selected analogues were not mutagenic moreover, they were not cardiotoxic in Langendorff-isolated rat hearts and are not toxic in vivo. Additionally, selected analogues 6d and 6h showed favorable solubility, chemical stability at both neutral and acidic pH, and metabolic stability to hCYP3A4. By an immunohistochemistry analysis, we confirmed the overexpression of HDAC6 in human IPF lung tissues. Our data suggest that this fact may confer hyperproliferative and profibrotic effects of ABC in IPF. Consecutively, we tested our best performing compounds, resulting from enzymatic assay (6a, 6d, 6h, and 6l), in 3D organoid and MTT assays to evaluate their efficacy in reverting the IPF phenotype and their antifibrotic activity. The results emphasized the important role that HDAC6 inhibition plays for the treatment of IPF. This evidence was further confirmed by the attenuation of TGF-β1-dependent fibrogenesis in human lung tissue with compound 6h. Overall, this work provides robust proof for HDAC6 inhibitors as potential therapeutic tools for the treatment of IPF. In conclusion, we identified 6h as a promising and optimized HDAC6i hit, with efficacy in reverting IPF phenotype, which may pave the way to the development of drug-like leads.
EXPERIMENTAL SECTION
Chemistry.
Unless otherwise specified, materials were purchased from commercial suppliers and used without further purification. Reaction progress was monitored by TLC using silica gel 60 F254 (0.040–0.063 mm) with detection by UV (254 nm). Silica gel 60 (0.040– 0.063 mm) or aluminum oxide 90 (0.063–0.200 mm) were used for column chromatography. 1H NMR and 13C NMR spectra were recorded on Varian 300 MHz or Bruker 400 MHz spectrometers, using the residual signal of the deuterated solvent as internal standard. Splitting patterns are described as singlet (s), doublet (d), triplet (t), quartet (q), quintet (p), and broad (br); the value of chemical shifts (δ) is given in ppm and coupling constants (J) in hertz (Hz). ESI-MS spectra were performed by an Agilent 1100 series LC/MSD spectrometer. Optical rotation values were measured at room temperature using a PerkinElmer model 343 polarimeter operating at = 589 nm, corresponding to the sodium D line. Yields refer to purified products and are not optimized. All moisture-sensitive reactions were performed under argon atmosphere using oven-dried glassware and anhydrous solvents. ESI-MS spectra for exact mass determination were performed on an LTQ Orbitrap Thermo Fischer Scientific instrument. All final compounds were purified by flash column chromatography. Purity of final products (> 95%) was determined by analytical HPLC Merk Purospher® STAR RP-18e (5 μm) LiChroCART® 250–4 column; detection at 254 nm; flow rate = 1.0 mL/min; mobile phase A, 0.01% TFA (v/v) in water; mobile B, acetonitrile; gradient, 90/10–10/90 A/B in 20 min. The gradient was optimized based on the compound polarity.
(1-Methylpiperidin-4-yl)(phenyl)methanone (8a).
Tosylhydrazone 7 (538 mg, 1.91 mmol) and Cs2CO3 (932 mg, 2.86 mmol) were placed in a tube. The tube was backfilled with nitrogen, before the addition of 1,4-dioxane (7 mL) followed by the addition of benzaldehyde (194 μL, 1.91 mmol). The tube was sealed with a silicone/PTFE cap and heated to 110 °C for 12 h. The reaction was cooled to 25 °C, quenched with a saturated solution of NH4Cl (20 mL) and extracted with DCM (3 × 20 mL). The combined organic layers were dried over Na2SO4 and the solvents removed in vacuo to give a residue which was purified by flash column chromatography on silica gel (MeOH/DCM 1:15) to give 8a (155 mg, 40% yield); 1H NMR (400 MHz, CDCl3) δ 7.90 (d, J = 7.2 Hz, 2H), 7.58 – 7.47 (m, 1H), 7.43 (t, J = 7.8 Hz, 2H), 3.28 – 3.11 (m, 1H), 2.92 (m, 2H), 2.29 (s, 3H), 2.17 – 2.00 (m, 2H), 1.97 – 1.73 (m, 4H); ESI MS m/z: [M+H]+ 204.
(4-Chlorophenyl)(1-methylpiperidin-4-yl)methanone (8b).
Starting from 7 (1.0 g, 3.56 mmol) and 4-chlorobenzaldehyde (500 mg, 3.56 mmol) compound 8b was obtained following the procedure described for the preparation of 8a. Purification by column chromatography on silica gel (MeOH/DCM 1:15) afforded 8b (432 mg, 51% yield); 1H NMR (300 MHz, CDCl3) δ 7.86 (d, J = 8.6 Hz, 2H), 7.43 (d, J = 8.8 Hz, 2H), 3.19 – 3.10 (m, 1H), 2.96 – 2.94 (m, 2H), 2.32 (s, 3H), 2.17 – 2.03 (m, 2H), 1.91 – 1.80 (m, 4H); ESI MS m/z: [M+H]+ 239.
(3-Chlorophenyl)(1-methylpiperidin-4-yl)methanone (8c).
Starting from 7 (1.0 g, 3.56 mmol) and 3-chlorobenzaldehyde (500 mg, 3.56 mmol) compound 8c was obtained following the procedure described for the preparation of 8a. Purification by column chromatography on silica gel (MeOH/DCM 1:15) afforded the title compound (633 mg, 75% yield); 1H NMR (300 MHz, CDCl3) δ 7.83 – 7.69 (m, 2H), 7.44 (s, 1H), 7.27 – 7.17 (m, 1H), 3.12 (m, 1H), 2.88 (m, 2H), 2.40 (t, J = 5.0 Hz, 2H), 2.25 (s, 3H), 1.88 – 1.70 (m, 4H); ESI MS m/z: [M+H]+ 238.
(2-Fluorophenyl)(1-methylpiperidin-4-yl)methanone (8d).
Starting from 7 (1.0 g, 3.56 mmol) and 2-fluorobenzaldehyde (442 mg, 3.56 mmol) compound 8d was obtained following the procedure described for the preparation of 8a. Purification by column chromatography on silica gel (MeOH/DCM 1:15) afforded the title compound (598 mg, 76% yield); 1H NMR (300 MHz, CDCl3) δ 7.78 – 7.65 (m, 1H), 7.70 – 7.56 (m, 1H), 7.48 – 7.31 (m, 1H), 7.07 – 6.93 (m, 1H), 3.06 – 2.90 (m, 1H), 2.86 – 2.68 (m, 2H), 2.39 – 2.22 (m, 2H), 2.18 (s, 3H), 2.05 – 1.86 (m, 1H), 1.86 – 1.74 (m, 2H), 1.74 – 1.55 (m, 1H); ESI MS m/z: [M+H]+ 222.
(4-Fluorophenyl)(1-methylpiperidin-4-yl)methanone (8e).
Starting from 7 (1.0 g, 3.56 mmol) and 4-fluorobenzaldehyde (440 mg, 3.56 mmol) compound 8e was obtained following the procedure described for the preparation of 8a. Purification by column chromatography on silica gel (MeOH/DCM 1:20) afforded the title compound (597 mg, 75% yield); 1H NMR (300 MHz, CDCl3) δ 8.02 – 7.89 (m, 2H), 7.14 (t, J = 8.6 Hz, 2H), 3.28 – 3.11 (m, 1H), 3.00 – 2.88 (m, 2H), 2.34 (s, 3H), 2.22 – 2.06 (m, 2H), 1.95 – 1.77 (m, 4H); ESI MS m/z: [M+H]+ 222.
(1-Methylpiperidin-4-yl)(pyridin-3-yl)methanone (8f).
Starting from 7 (500 mg, 1.78 mmol) and 3-pyridinecarboxaldehyde (107 mg, 1.78 mmol) compound 8f was obtained following the procedure described for the preparation of 8a. Title compound was obtained as pure without any further purification (quantitative yield); 1H NMR (300 MHz, CDCl3) δ 9.14 (s, 1H), 8.77 (d, J = 4.8 Hz, 1H), 8.20 (d, J = 8.0 Hz, 1H), 7.48 – 7.36 (m, 1H), 3.26 – 3.11 (m, 1H), 3.02 – 2.89 (m, 2H), 2.33 (s, 3H), 2.22 – 2.05 (m, 4H), 1.95 – 1.83 (m, 2H); ESI MS m/z: [M+H]+ 205.
1’-Methyl-2-phenylspiro[indole-3,4’-piperidine] (9a).
Phenylhydrazine (143 μL, 1.45 mmol) and 8a (295 mg, 1.45 mmol) were dissolved in 1,4-dioxane (5 mL) and cooled to 0 °C. Concentrated sulfuric acid (700 μL) was added dropwise to the reaction at 0 °C. The reaction was then heated at 70 °C for 2 h and stirred for an additional 12 h at 25 °C. The mixture was then treated with a saturated solution of NaHCO3 (20 mL) and extracted with DCM (3 × 20 mL). The combined organic layers were dried over Na2SO4 and solvents were removed in vacuo to give a residue which was purified by flash column chromatography on silica gel (MeOH/DCM 1:15) to give the title compound (120 mg, 30% yield); 1H NMR (300 MHz, CDCl3) δ 8.27 – 7.99 (m, 2H), 7.85 (d, J = 7.5 Hz, 2H), 7.73 (d, J = 7.7 Hz, 2H), 7.61 – 7.32 (m, 4H), 7.22 (t, J = 8.1 Hz, 1H), 2.95 (br, 2H), 2.75 (br, 4H), 2.49 (s, 3H), 1.45 (br, 2H); ESI MS m/z: [M+H]+ 277.
2-(4-Chlorophenyl)-1’-methylspiro[indole-3,4’-piperidine] (9b).
Compound 9b was obtained from 8 (268 mg, 1.13 mmol) following the procedure described for the preparation of 9a. Purification by column chromatography on silica gel (MeOH/DCM 1:30) afforded the title compound (112 mg, 32% yield); 1H NMR (300 MHz, CDCl3) δ 8.16 (d, J = 8.6 Hz, 2H), 7.86 (d, J = 7.1 Hz, 1H), 7.73 (d, J = 7.8 Hz, 1H), 7.44 (d, J = 8.5 Hz, 2H), 7.41 (m, 1H), 7.29 – 7.16 (m, 1H), 3.02 – 2.97 (m, 2H), 2.81 – 2.62 (m, 4H), 2.51 (s, 3H), 1.53 – 1.21 (m, 2H); ESI MS m/z: [M+H]+ 311.
2-(3-Chlorophenyl)-1’-methylspiro[indole-3,4’-piperidine] (9c).
Compound 9c was obtained from 8c (476 mg, 2.0 mmol) following the procedure described for the preparation of 9a. Purification by column chromatography on silica gel (MeOH/DCM 1:20) afforded the title compound (187 mg, 30% yield); 1H NMR (300 MHz, CDCl3) δ 8.16 (s, 1H), 7.97 (d, J = 7.1 Hz, 1H), 7.85 (d, J = 7.7 Hz, 1H), 7.74 (d, J = 7.7 Hz, 1H), 7.50 – 7.36 (m, 3H), 7.30 – 7.20 (m, 1H), 3.00 – 2.92 (m, 2H), 2.81 – 2.59 (m, 4H), 2.51 (s, 3H), 1.50 – 1.42 (m, 2H); ESI MS m/z: [M+H]+ 311.
2-(2-Fluorophenyl)-1’-methylspiro[indole-3,4’-piperidine] (9d).
Compound 9d was obtained from 8d (300 mg, 1.36 mmol) following the procedure described for the preparation of 9a. Purification by column chromatography on silica gel (MeOH/DCM 1:20) afforded the title compound (120 mg, 30% yield); 1H NMR (300 MHz, CDCl3) δ 7.83 (d, J = 7.5 Hz, 1H), 7.72 (d, J = 7.7 Hz, 1H), 7.46 – 7.38 (m, 2H), 7.32 – 7.23 (m, 3H), 7.23 – 7.07 (m, 1H), 2.81 (s, 1H), 2.69 (t, J = 11.6 Hz, 2H), 2.42 (s, 3H), 2.23 (t, J = 12.6 Hz, 2H), 1.57 (d, J = 13.2 Hz, 2H); ESI MS m/z: [M+H]+ 295.
2-(4-Fluorophenyl)-1’-methylspiro[indole-3,4’-piperidine] (9e).
Compound 9e was obtained from 8e (627 mg, 2.8 mmol) following the procedure described for the preparation of 9a. Purification by column chromatography on silica gel (acetone/DCM 1:20) afforded the title compound (412 mg, 50% yield); 1H NMR (300 MHz, CDCl3) δ 8.26 – 8.11 (m, 1H), 7.85 (d, J = 7.5 Hz, 2H), 7.71 (d, J = 7.9 Hz, 2H), 7.41 (t, J = 7.7 Hz, 1H), 7.27 – 7.06 (m, 2H), 3.06 – 2.87 (m, 2H), 2.79 – 2.60 (m, 4H), 2.50 (s, 3H), 1.51 – 1.39 (m, 2H); ESI MS m/z: [M+H]+ 295.
1’-Methyl-2-(pyridin-3-yl)spiro[indole-3,4’-piperidine] (9f).
Starting from 8f (200 mg, 0.98 mmol) the title compound 9f was obtained following the procedure described for the preparation of 9a. Purification by column chromatography on silica gel (MeOH/DCM 1:10) afforded the title compound (180 mg, 66% yield); 1H NMR (300 MHz, CDCl3) δ 9.37 (s, 1H), 8.71 – 8.62 (m, 1H), 8.40 (d, J = 8.1 Hz, 1H), 7.83 (d, J = 6.3 Hz, 1H), 7.76 – 7.63 (m, 1H), 7.47 – 7.32 (m, 2H), 7.28 – 7.14 (m, 1H), 3.03 – 2.91 (m, 2H), 2.80 – 2.56 (m, 4H), 2.50 (s, 3H), 1.46 (d, J = 12.6 Hz, 2H); δ ESI MS m/z: [M+H]+ 279.
(±)-1’-Methyl-2-phenylspiro[indoline-3,4’-piperidine] ((±)-10a).
To a solution of 9a (110 mg, 0.40 mmol) in MeOH (5 mL), NaBH4 (76 mg, 2.00 mmol) was added. The reaction was kept stirring for 12 h at 50 °C. Then reaction was quenched with a saturated solution of NaHCO3 (10 mL) and MeOH was removed under reduced pressure. The residue was dissolved with EtOAc and washed with H2O (3 × 10 mL). The organic phase was dried over Na2SO4 and solvents removed in vacuo to give a residue which was purified by flash column chromatography on silica gel (MeOH/DCM 1:20) affording the title compound (60 mg, 40% yield); 1H NMR (300 MHz, CDCl3) δ 7.32 – 7.20 (m, 6H), 7.09 (td, J = 7.6, 1.1 Hz, 1H), 6.77 (td, J = 7.4, 0.8 Hz, 1H), 6.66 (d, J = 7.7 Hz, 1H), 4.59 (s, 1H), 4.14 (br, 1H), 2.85 – 2.73 (m, 1H), 2.66 – 2.55 (m, 1H), 2.52 – 2.41 (m, 1H), 2.30 (s, 3H), 2.13 – 1.74 (m, 4H), 1.42 (m, 1H); ESI MS m/z: [M+H]+ 279.
(±)-2-(4-Chlorophenyl)-1’-methylspiro[indoline-3,4’-piperidine] ((±)-10b).
Starting from 9b (110 mg, 0.35 mmol) compound (±)-10b was obtained following the procedure described for the preparation of (±)-10a. Purification by column chromatography on silica gel (MeOH/DCM 1:20) afforded the title compound (45 mg, 40% yield); 1H NMR (300 MHz, CDCl3) δ 7.31 – 7.17 (m, 5H), 7.11 (t, J = 7.6 Hz, 1H), 6.78 (t, J = 7.5 Hz, 1H), 6.68 (d, J = 7.7 Hz, 1H), 4.07 (s, 1H), 2.82 (br, 1H), 2.65 – 2.52 (m, 2H), 2.35 (s, 3H), 2.19 – 1.90 (m, 4H), 1.41 (t, J = 9.8 Hz, 2H); ESI MS m/z: [M+H]+ 313.
(±)-2-(3-Chlorophenyl)-1’-methylspiro[indoline-3,4’-piperidine] ((±)-10c).
Starting from 9c (102 mg, 0.33 mmol) compound (±)-10c was obtained following the procedure described for the preparation of (±)-10a. Title compound was used in the next step without any further purification. (quantitative yield); 1H NMR (300 MHz, CDCl3) δ 7.36 – 7.17 (m, 5H), 7.10 (t, J = 8.4 Hz, 1H), 6.77 (t, J = 7.4 Hz, 1H), 6.68 (d, J = 7.8 Hz, 1H), 4.56 (s, 1H), 4.09 (br, 1H), 2.80 – 2.71 (m, 1H), 2.67 – 2.52 (m, 1H), 2.51 – 2.36 (m, 1H), 2.31 (s, 3H), 2.19 – 1.85 (m, 4H), 1.83 – 1.65 (m, 1H); ESI MS m/z: [M+H]+ 313.
(±)-2-(2-Fluorophenyl)-1’-methylspiro[indoline-3,4’-piperidine] ((±)-10d).
A mixture of 9d (113 mg, 0.38 mmol) and a catalytic amount of 10% palladium on carbon in MeOH (2 mL) was stirred under a hydrogen atmosphere at 25 °C. The disappearance of the starting material was monitored by TLC and the Pd/C filtered and washed with MeOH (5 mL). The solvent was removed in vacuo and the title compound was used in the next step without any further purification (quantitative yield); 1H NMR (300 MHz, CDCl3) δ 7.35 – 7.20 (m, 4H), 7.15 – 6.96 (m, 2H), 6.79 (t, J = 7.5 Hz, 1H), 6.68 (d, J = 7.8 Hz, 1H), 5.10 (s, 1H), 4.00 (br, 1H), 3.06 – 2.87 (m, 1H), 2.80 – 2.55 (m, 2H), 2.44 (s, 3H), 2.28 – 1.93 (m, 4H), 1.62 – 1.43 (m, 2H); ESI MS m/z: [M+H]+ 297.
(±)-2-(4-Fluorophenyl)-1’-methylspiro[indoline-3,4’-piperidine] ((±)-10e).
Starting from 9e (300 mg, 1.02 mmol) compound (±)-10e was obtained following the procedure described for the preparation of (±)-10a. Purification by column chromatography on silica gel (acetone/DCM 1:20) afforded the title compound (176, 58% yield); 1H NMR (300 MHz, CDCl3) δ 7.31 – 7.20 (m, 3H), 7.10 (t, J = 7.6 Hz, 1H), 6.96 (t, J = 8.7 Hz, 2H), 6.77 (t, J = 7.5 Hz, 1H), 6.67 (d, J = 7.9 Hz, 1H), 4.58 (s, 1H), 4.09 (br, 1H), 2.89 – 2.73 (m, 1H), 2.70 – 2.55 (m, 1H), 2.55 – 2.41 (m, 1H), 2.33 (s, 3H), 2.15 – 2.04 (m, 1H), 2.04 – 1.89 (m, 2H), 1.84 – 1.79 (m, 1H), 1.45 – 1.29 (m, 1H); ESI MS m/z: [M+H]+ 297.
(±)-1’-Methyl-2-(pyridin-3-yl)spiro[indoline-3,4’-piperidine] ((±)-10f)
Starting from 9f (180 mg, 0.64 mmol) compound (±)-10f was obtained following the procedure described for the preparation of (±)-10a. Title compound was used in the next step without any further purification (quantitative yield); 1H NMR (300 MHz, CDCl3) δ 8.56 (d, J = 2.3 Hz, 1H), 8.54 – 8.48 (m, 1H), 7.59 (d, J = 7.9 Hz, 1H), 7.28 (d, J = 7.9 Hz, 1H), 7.25 – 7.14 (m, 1H), 7.11 (t, J = 7.6 Hz, 1H), 6.79 (t, J = 7.4 Hz, 1H), 6.69 (d, J = 7.7 Hz, 1H), 4.62 (d, J = 1.4 Hz, 1H), 4.10 (br, 1H), 2.87 – 2.72 (m, 1H), 2.69 – 2.54 (m, 1H), 2.54 – 2.40 (m, 1H), 2.31 (s, 3H), 2.16 – 1.86 (m, 4H), 1.88 – 1.71 (m, 1H), 1.42 – 1.24 (m, 1H); ESI MS m/z: [M+H]+ 280.
(±)-Methyl 4-((1’-methyl-2-phenylspiro[indoline-3,4’-piperidin]-1-yl)methyl)benzoate ((±)-11a).
To a solution of (±)-10a (121 mg, 0.438 mmol) and methyl 4-formylbenzoate (72 mg, 0.438 mmol) in EtOH (5 mL), AcOH (700 μL) and NaBH3CN (55 mg, 0.876 mmol) were added. The reaction was then heated to 70 °C for 2 h and stirred for additional 12 h at 25 °C. The mixture was then treated with a saturated solution of NaHCO3 (20 mL) and extracted with EtOAc (3 × 20 mL). The combined organic phases were dried over Na2SO4 and solvents removed in vacuo to give a residue which was purified by flash column chromatography on silica gel (MeOH/DCM 1:15) (65 mg, 35% yield); 1H NMR (300 MHz, CDCl3) δ 7.95 (d, J = 8.2 Hz, 2H), 7.32 – 6.97 (m, 9H), 6.73 (t, J = 7.4 Hz, 1H), 6.35 (d, J = 7.8 Hz, 1H), 4.43 – 4.28 (m, 2H), 3.96 – 3.79 (m, 4H), 2.98 – 2.81 (m, 1H), 2.75 – 2.46 (m, 2H), 2.36 (s, 3H), 2.18 – 1.84 (m, 4H), 1.60 – 1.40 (m, 1H); ESI MS m/z: [M+H]+ 427.
(±)-Methyl 4-((2-(4-chlorophenyl)-1’-methylspiro[indoline-3,4’-piperidin]-1-yl)methyl)benzoate ((±)-11b).
Starting from (±)-10b (40 mg, 0.13 mmol) compound (±)-11b was obtained following the procedure described for the preparation of 11a. Purification by column chromatography on silica gel (acetone/DCM 1:30) afforded the title compound (26 mg, 43% yield); 1H NMR (300 MHz, CDCl3) δ 7.96 (d, J = 8.0 Hz, 2H), 7.34 – 7.20 (m, 5H), 7.10 (t, J = 7.6 Hz, 3H), 6.75 (t, J = 7.4 Hz, 1H), 6.38 (d, J = 7.8 Hz, 1H), 4.43 – 4.31 (m, 2H), 3.91 (s, 3H), 3.85 (d, J = 16.1 Hz, 1H), 2.89 (q, J = 5.8, 5.4 Hz, 2H), 2.68 – 2.54 (m, 2H), 2.38 (s, 3H), 2.18 – 1.91 (m, 2H), 1.58 – 1.39 (m, 2H); ESI MS m/z: [M+H]+ 461.
(±)-Methyl 4-((2-(3-chlorophenyl)-1’-methylspiro[indoline-3,4’-piperidin]-1-yl)methyl)benzoate ((±)-11c).
Starting from (±)-10c (100 mg, 0.32 mmol) compound (±)-11c was obtained following the procedure described for the preparation of (±)-11a. Purification by column chromatography on silica gel (MeOH/DCM 1:20) afforded the title compound (47 mg, 32% yield); 1H NMR (300 MHz, CD3OD) δ 7.94 (d, J = 7.5 Hz, 2H), 7.33 (d, J = 8.2 Hz, 2H), 7.32 – 7.17 (m, 4H), 7.14 – 7.00 (m, 2H), 6.73 (t, J = 7.5 Hz, 1H), 6.50 – 6.35 (m, 1H), 4.47 (s, 1H), 4.40 (d, J = 16.3 Hz, 1H), 3.93 (d, J = 16.8 Hz, 1H), 3.88 (s, 3H), 2.96 – 2.81 (m, 1H), 2.73 – 2.52 (m, 2H), 2.34 (s, 3H), 2.18 – 1.98 (m, 2H), 1.97 – 1.82 (m, 2H), 1.39 (d, J = 30.0 Hz, 1H); ESI MS m/z: [M+H]+ 461.
(±)-Methyl 4-((2-(2-fluorophenyl)-1’-methylspiro[indoline-3,4’-piperidin]-1-yl)methyl)benzoate ((±)-11d).
Starting from (±)-10d (156 mg, 0.53 mmol) compound (±)-11d was obtained following the procedure described for the preparation of (±)-11a. Purification by column chromatography on silica gel (MeOH/DCM 1:20) afforded the title compound (59 mg, 25% yield); 1H NMR (300 MHz, CDCl3) δ 7.97 (d, J = 8.3 Hz, 2H), 7.31 – 7.19 (m, 4H), 7.17 – 6.90 (m, 3H), 6.78 – 6.68 (m, 2H), 6.35 (d, J = 7.8 Hz, 1H), 4.95 (s, 1H), 4.34 (d, J = 16.1 Hz, 1H), 3.87 (s, 3H), 3.86 (d, J = 16.3 Hz, 1H), 2.87 – 2.73 (m, 1H), 2.59 – 2.45 (m, 2H), 2.31 (s, 3H), 2.11 – 1.87 (m, 4H), 1.56 – 1.43 (m, 1H); ESI MS m/z: [M+H]+ 445.
(±)-Methyl 4-((2-(4-fluorophenyl)-1’-methylspiro[indoline-3,4’-piperidin]-1-yl)methyl)benzoate ((±)-11e).
Starting from (±)-10e (178 mg, 0.60 mmol) (±)-11e was obtained following the procedure described for the preparation of (±)-11a. Purification by column chromatography on silica gel (MeOH/DCM 1:20) afforded the title compound (122 mg, 46% yield); 1H NMR (300 MHz, CD3OD) δ 7.92 (d, J = 6.7 Hz, 2H), 7.30 (d, J = 6.7 Hz, 2H), 7.26 – 7.11 (m, 3H), 7.07 – 6.98 (m, 3H), 6.70 (t, J = 7.4 Hz, 1H), 6.43 – 6.34 (m, 1H), 4.46 (s, 1H), 4.37 (d, J = 16.1 Hz, 1H), 3.91 (d, J = 11.0 Hz, 1H), 3.86 (s, 3H), 2.92 – 2.77 (m, 1H), 2.68 – 2.45 (m, 2H), 2.30 (s, 3H), 2.13 – 1.95 (m, 2H), 1.95 – 1.75 (m, 2H), 1.46 – 1.33 (m, 1H); ESI MS m/z: [M+H]+ 445.
(±)-Methyl 4-((1’-methyl-2-(pyridin-3-yl)spiro[indoline-3,4’-piperidin]-1-yl)methyl)benzoate ((±)-11f).
Starting from (±)-10f (189 mg, 0.68 mmol) compound (±)-11f was obtained following the procedure described for the preparation of (±)-11a. Purification by column chromatography on silica gel (EtOAc/n-hexane 1:2) afforded the title compound (73 mg, 25% yield); 1H NMR (300 MHz, CDCl3) δ 8.53 (d, J = 6.4 Hz, 1H), 8.36 (m, 1H), 7.96 (d, J = 8.3 Hz, 2H), 7.48 – 7.37 (m, 1H), 7.32 – 7.21 (m, 3H), 7.19 (d, J = 6.5 Hz, 1H), 7.09 (t, J = 7.7 Hz, 1H), 6.76 (t, J = 6.9 Hz, 1H), 6.39 (d, J = 7.8 Hz, 2H), 4.45 – 4.29 (m, 1H), 3.90 (s, 3H), 2.88 – 2.68 (m, 2H), 2.57 – 2.40 (m, 2H), 2.09 – 1.80 (m, 4H), 1.46 – 1.30 (m, 2H); ESI MS m/z: [M+H]+ 428.
(±)-N-Hydroxy-4-((1’-methyl-2-phenylspiro[indoline-3,4’-piperidin]-1-yl)methyl)benzamide (6a).
To a solution of (±)-11a (66 mg, 0.155 mmol) in DCM /MeOH 1:2 cooled at 0 °C, NH2OH (50% H2O solution, 1.02 mL, 15.50 mmol) and a 4 M solution of KOH (1.94 mL, 7.75 mmol) were added and the reaction mixture was left stirring at 25 °C for 4 h. Then pH was adjusted to 7 with HCl 6N and solvent removed under reduced pressure. The residue was purified by column chromatography on silica gel (MeOH/DCM 1:20) affording the final product (45 mg, 68% yield); 1H NMR (300 MHz, CD3OD) δ 7.68 (d, J = 8.2 Hz, 2H), 7.40 – 7.16 (m, 8H), 7.08 (t, J = 7.7 Hz, 1H), 6.73 (t, J = 7.3 Hz, 1H), 6.45 (d, J = 7.9 Hz, 1H), 4.53 – 4.36 (m, 2H), 3.90 (d, J = 15.9 Hz, 1H), 3.18 (m, 1H), 3.05 (m, 1H), 2.86 (m, 1H), 2.57 (s, 3H), 2.43 (m, 1H), 2.15 (m, 1H), 1.97 (m, 2H), 1.53 (m, 1H). 13C NMR (75 MHz, DMSO) δ 164.7, 151.4, 142.5, 138.1, 136.9, 132.2, 128.8, 128.6, 128.4, 127.7, 124.0, 118.0, 106.8, 77.2, 52.4, 49.9, 46.2, 46.1, 31.4; ESI MS m/z: [M+H]+ 428; HPLC RT: 13.0 min.
(±)-4-((2-(4-Chlorophenyl)-1’-methylspiro[indoline-3,4’-piperidin]-1-yl)methyl)-N-hydroxybenzamide (6b).
Compound 6b was obtained from (±)-11b (26 mg, 0.056 mmol) following the procedure described for the preparation of 6a. Purification by column chromatography on silica gel (NH4OH/MeOH/DCM 0.1:1:10) afforded the title compound as a transparent oil (9 mg, 33% yield); 1H NMR (300 MHz, CD3OD) δ 11.13 (br, 1H), 8.98 (br, 1H), 7.67 (d, J = 8.3 Hz, 2H), 7.44 – 7.30 (m, 2H), 7.28 (d, J = 8.3 Hz, 2H), 7.19 (d, J = 7.2 Hz, 2H), 6.99 (t, J = 7.7 Hz, 1H), 6.63 (t, J = 6.9 Hz, 1H), 6.34 (d, J = 6.9 Hz, 2H), 4.51 (s, 1H), 4.31 (d, J = 16.3 Hz, 1H), 3.83 (d, J = 16.3 Hz, 1H), 2.68 – 2.53 (m, 2H), 2.14 (s, 3H), 1.76 – 1.63 (m, 4H), 1.22 – 1.08 (m, 2H); 13C NMR (75 MHz, DMSO) δ 164.7, 151.1, 142.3, 137.2, 136.9, 133.0, 132.2, 128.9, 128.4, 127.8, 127.7, 124.1, 118.1, 106.8, 76.2, 52.4, 52.1, 49.9, 46.6, 46.2, 37.6, 31.5; ESI MS m/z: [M+H]+ 462; calcd for C27H29N3O2Cl 462.1943; found 462.1929; HPLC RT: 12.2 min.
(±)-4-((2-(3-Chlorophenyl)-1’-methylspiro[indoline-3,4’-piperidin]-1-yl)methyl)-N-hydroxybenzamide (6c).
Compound 6c was obtained from (±)-11c (37 mg, 0.08 mmol) following the procedure described for the preparation of 6a. Purification by column chromatography on silica gel (NH4OH/MeOH/DCM 0.1:1:10) afforded the title compound (21 mg, 57% yield); 1H NMR (300 MHz, CD3OD) δ 11.15 (br, 1H), 8.99 (br, 1H), 7.67 (d, J = 8.2 Hz, 2H), 7.34 (s, 1H), 7.29 (d, J = 6.5 Hz, 2H), 7.20 (d, J = 7.4 Hz, 2H), 7.00 (t, J = 7.6 Hz, 2H), 6.64 (t, J = 8.1 Hz, 1H), 6.43 – 6.22 (m, 2H), 4.54 (s, 1H), 4.32 (d, J = 14.0 Hz, 1H), 3.86 (d, J = 16.3 Hz, 1H), 2.74 – 2.58 (m, 1H), 2.49 – 2.32 (m, 1H), 2.17 (s, 3H), 2.00 – 1.82 (m, 2H), 1.79 – 1.57 (m, 2H), 1.29 – 1.09 (m, 2H); 13C NMR (75 MHz, CD3OD) δ 164.9, 149.5, 139.6, 138.3, 137.7, 132.9, 130.6, 128.9, 128.5, 127.8, 127.7, 126.5, 124.2, 121.3, 110.3, 84.4, 52.1, 51.3, 50.6, 46.0, 34.7; ESI MS m/z: [M+H]+ 462; HPLC RT: 10.4 min.
(±)-4-((2-(2-Fluorophenyl)-1’-methylspiro[indoline-3,4’-piperidin]-1-yl)methyl)-N-hydroxybenzamide (6d).
Compound 6d was obtained from (±)-11d (30 mg, 0.07 mmol) following the procedure described for the preparation of 6a. Purification by column chromatography on silica gel (NH4OH/MeOH/DCM 0.1:1:10) afforded the title compound (12 mg, 40%); 1H NMR (300 MHz, CD3OD) δ 11.15 (br, 1H), 8.99 (br, 1H), 7.66 (d, J = 8.3 Hz, 2H), 7.41 – 7.27 (m, 2H), 7.31 – 7.15 (m, 2H), 7.17 – 7.04 (m, 2H), 7.02 (t, J = 8.3 Hz, 2H), 6.65 (t, J = 6.9 Hz, 1H), 6.43 (d, J = 7.8 Hz, 1H), 4.84 (s, 1H), 4.41 (d, J = 16.0 Hz, 1H), 3.78 (d, J = 16.0 Hz, 1H), 2.74 – 2.57 (m, 1H), 2.44 – 2.24 (m, 2H), 2.15 (s, 3H), 1.91 – 1.67 (m, 4H), 1.29 – 1.09 (m, 1H); 13C NMR (75 MHz, DMSO) δ 164.7, 162.5, 159.2, 151.2, 141.9, 136.5, 132.2, 130.5, 129.4, 128.6, 127.9, 127.7, 125.1, 124.8, 124.1, 118.2, 116.7, 116.4, 106.8, 67.5, 52.4, 51.9, 49.7, 46.5, 46.4, 37.7, 31.7; ESI MS m/z: [M+H]+ 446; HRMS-ESI m/z: [M+H]+ calcd for C27H29FN3O2 446.2238; found 446.2225; HPLC RT: 10.6 min.
(±)-4-((2-(4-Fluorophenyl)-1’-methylspiro[indoline-3,4’-piperidin]-1-yl)methyl)-N-hydroxybenzamide (6e).
Compound 6e was obtained from (±)-11e (60 mg, 0.13 mmol) following the procedure described for the preparation of 6a. Purification by column chromatography on silica gel (NH4OH/MeOH/DCM 0.1:1:10) afforded the title compound (32 mg, 56% yield); 1H NMR (300 MHz, CD3OD) δ 11.12 (br, 1H), 8.99 (br, 1H), 7.67 (d, J = 8.0 Hz, 2H), 7.28 (d, J = 8.0 Hz, 2H), 7.21 – 7.04 (m, 4H), 6.98 (t, J = 7.6 Hz, 2H), 6.63 (t, J = 7.3 Hz, 1H), 6.33 (d, J = 7.8 Hz, 1H), 4.50 (s, 1H), 4.30 (d, J = 16.2 Hz, 1H), 3.83 (d, J = 16.3 Hz, 1H), 2.60 (s, 1H), 2.35 – 2.23 (m, 1H), 2.12 (s, 3H), 1.95 – 1.79 (m, 2H), 1.79 – 1.53 (m, 2H), 1.33 – 1.07 (m, 2H); 13C NMR (75 MHz, CD3OD) δ 166.7, 164.4, 161.1, 150.9, 142.7, 136.0, 133.4, 132.0, 131.2, 129.1, 127.9, 127.6, 127.1, 123.3, 117.8, 114.7, 106.4, 76.2, 51.9, 51.8, 49.6, 45.6, 44.9, 36.6, 30.8; ESI MS m/z: [M+H]+ 446; HRMS-ESI m/z: [M+H]+ calcd for C27H29FN3O2 446.2238; found 446.2227; HPLC RT: 11.4 min.
(±)-N-Hydroxy-4-((1’-methyl-2-(pyridin-3-yl)spiro[indoline-3,4’-piperidin]-1-yl)methyl)benzamide (6f)
Compound 6f was obtained from (±)-11f (45 mg, 0.11 mmol) following the procedure described for the preparation of 6a. Purification by column chromatography on silica gel (NH4OH/MeOH/DCM 0.1:1:10) afforded the title compound (34 mg, 73% yield); 1H NMR (300 MHz, CD3OD) δ 11.16 (br, 1H), 8.99 (br, 1H), 8.53 (s, 1H), 7.68 (d, J = 7.9 Hz, 2H), 7.35 (s, 2H), 7.29 (d, J = 8.0 Hz, 2H), 7.07 (t, J = 7.6 Hz, 1H), 6.71 (t, J = 7.4 Hz, 1H), 6.44 (d, J = 7.8 Hz, 1H), 4.59 (s, 1H), 4.36 (d, J = 16.1 Hz, 1H), 3.85 (d, J = 16.1 Hz, 2H), 3.05 – 2.87 (m, 1H), 2.64 (s, 3H), 2.14 – 1.86 (m, 4H), 1.30 – 1.16 (m, 2H); 13C NMR (75 MHz, CD3OD) δ 166.6, 150.7, 149.3, 142.1, 136.3, 133.8, 133.4, 131.3, 128.8, 127.7, 127.3, 124.2, 123.3, 118.7, 107.4, 73.9, 51.4, 49.9, 44.9, 42.9, 34.2, 34.1, 29.1; ESI MS m/z: [M+H]+ 429; HRMS-ESI m/z: [M+H]+ calcd for C26H29N4O2 429.2285; found 429.2271; HPLC RT: 7.1 min.
Methyl 4-bromobutanoate (13).
4-Bromobutyryl chloride (1.6 mL, 13.82 mmol) was treated with MeOH (7 mL) at 0 °C. Reaction mixture was stirred at 0 °C for 2 h, and then at 25 °C for 12 h. Solvent was removed under reduced pressure. The title compound was obtained as pure compound without further purification (quantitative yield); 1H NMR (300 MHz, CDCl3) δ 3.65 (s, 3H), 3.43 (t, J = 5.7 Hz, 2H), 2.48 (t, J = 6.4 Hz, 2H), 2.22 – 2.04 (m, 2H).
Methyl 4-(p-tolyloxy)butanoate (14).
To a solution of p-cresol (500 mg, 2.76 mmol) in dry MeCN (2.5 mL) Cs2CO3 (900 mg, 2.76 mmol) and mixture was stirred at 95 °C for 30 minutes. Then a solution of 13 (149 mg, 1.38 mmol) in dry MeCN (2.5 mL) was added and the reaction mixture was left at 95 °C for 12 h. The reaction was cooled down to 25 °C, then the solvent was removed under reduced pressure. The residue was dissolved in EtOAc, washed with a saturated solution of NaHCO3, dried over Na2SO4, and evaporated in vacuo. Purification by column chromatography on silica gel (EtOAc/n-hexane 1:8) afforded the title compound (425 mg, 74% yield); 1H NMR (300 MHz, CDCl3) δ 7.07 (d, J = 8.1 Hz, 2H), 6.78 (d, J = 8.6 Hz, 2H), 3.97 (t, J = 6.1 Hz, 2H), 3.68 (s, 3H), 2.52 (t, J = 7.3 Hz, 2H), 2.28 (s, 3H), 2.17 – 1.99 (m, 2H).
Methyl 4-(4-formylphenoxy)butanoate (16). Methyl 4-(4-(bromomethyl)phenoxy)butanoate (15).
To a solution of 14 (420 mg, 2.01 mmol) in CCl4 were added NBS (77 mg, 0.9 mmol) and AIBN (33 mg, 0.20 mmol), and the reaction mixture was kept stirring at 80 °C for 4 h. The solvent was evaporated to obtain compound 15 that was immediately used in the next reaction without further purification.
To a solution of 15 (100 mg, 0.35 mmol) in DMSO (1.5 mL) was added NBS (87 mg, 0.49mmol) and reaction mixture was kept stirring at 60 °C for 1 h, then at 100 °C for an additional hour. After cooling H2O was added (15 mL) and organic products were extracted with EtOAc (3 × 15 mL). Organic phase was dried over Na2SO4 and reduced in vacuo. Purification by column chromatography on silica gel (EtOAc/n-hexane 1:4) afforded the title compound (23 mg, 30% yield over two steps); 1H NMR (300 MHz, CDCl3) δ 9.87 (s, 1H), 7.87 (d, J = 7.6 Hz, 2H), 7.15 (d, J = 7.5 Hz, 2H), 4.02 (t, J = 7.5 Hz, 2H), 3.64 (s, 3H), 2.48 (t, J = 8.1 Hz, 2H), 2.16 – 2.06 (m, 2H).
Methyl 5-methylthiophene-2-carboxylate (18).
To a solution of 5-methyl-2-thiophenecarboxylic acid (1.0 g, 7.0 mmol) in MeOH (15 mL), SOCl2 (2 mL) was added dropwise at 0 °C. The reaction mixture was allowed to reach 25 °C and then was left stirring for 12 h. The solvent was removed, and the residue was dissolved in EtOAc and washed with a saturated solution of NaHCO3. Title compound was used in the next step without any further purification (quantitative yield). 1H NMR (300 MHz CDCl3) δ 7.60 (d, J = 3.7 Hz, 1H), 6.76 (d, J = 3.7 Hz, 1H), 3.85 (s, 3H), 2.51 (s, 3H). ESI MS m/z: [M+H]+ 157.
Methyl 5-(bromomethyl)thiophene-2-carboxylate (19).
To a solution of 18 (570 mg, 3.65 mmol) in CCl4 (8 mL), NBS (584 mg, mmol) and AIBN (60 mg, 0.37 mmol) were added and reaction mixture was stirred at 80 °C for 4 h. CCl4 was removed under reduced pressure and residue diluted with DCM and purified by column chromatography on silica gel (EtOAc/n-hexane 1:30) (512 mg, 60% yield); 1H NMR (300 MHz, CDCl3) δ 7.63 (d, J = 3.8 Hz, 1H), 7.08 (d, J = 3.8 Hz, 1H), 4.66 (s, 3H), 3.87 (s, 3H); ESI MS m/z: [M+H]+ 235.
Methyl 5-formylthiophene-2-carboxylate (20).
To a solution of 4-methylmorpholine N-oxide (449 mg, 3.83 mmol) in MeCN (5 mL), cooled at 0 °C and in presence of 3Å molecular sieves, a solution of 19 (300 mg, 1.28 mmol) in MeCN was added. The reaction mixture was stirred at 25 °C for 12 h and then it was purified by column chromatography on silica gel (EtOAc/ n-hexane 1:20) obtaining the title compound (152 mg, 70% yield); 1H NMR: (300 MHz, CDCl3) δ 9.96 (s, 1H), 7.82 (d, J = 1.1 Hz, 1H), 7.72 (d, J = 2.8 Hz, 1H), 3.93 (s, 3H); ESI MS m/z: [M+H]+ 171.
2-Methyl-1-(pyridin-3-yl)propan-1-one (22b).
Starting from 21 (513 mg, 2.27 mmol) and 3-pyridinecarboxaldehyde (214 μL , 2.27 mmol) compound 22b was obtained following the procedure described for the preparation of 8a. Purification by column chromatography on silica gel (EtOAc/EtPet 1:2) afforded the title compound (301 mg, 89% yield); 1H NMR (300 MHz, CDCl3) δ 9.11 (s, 1H), 8.72 (d, J = 4.8 Hz, 1H), 8.23 – 8.13 (m, 1H), 7.44 – 7.33 (m, 1H), 3.60 – 3.36 (m, 1H), 1.20 (s, 3H), 1.18 (s, 3H); ESI MS m/z: [M+H]+ 150.
2-Methyl-1-(pyridin-4-yl)propan-1-one (22c).
Starting from 21 (1.0 g, 4.41 mmol) and 4-pyridinecarboxaldehyde (474 μL, 4.41 mmol) compound 22c was obtained following the procedure described for the preparation of 8a. The title compound was used in the next step without any further purification (quantitative yield); 1H NMR (300 MHz, CDCl3) δ 8.79 (d, J = 4.5 Hz, 2H), 7.70 (d, J = 4.5 Hz, 2H), 3.53 – 3.43 (m, 1H), 1.23 (s, 3H), 1.21 (s, 3H); ESI MS m/z: [M+H]+ 150.
3,3-Dimethyl-2-phenyl-3H-indole (23a).
To a solution of the commercially available 2-methyl-1-phenylpropan-1-one (22a, 506 μL, 3.37 mmol) in AcOH (5 mL), phenylhydrazine (331 μL, 3.37 mmol) was added. The reaction was heated at 80 °C for 12 h then it was concentrated to dryness, extracted with EtOAc and washed with Na2CO3. The organic layer was dried over Na2SO4, evaporated and purification by column chromatography on silica gel (EtOAc/n-hexane 1:30) afforded the title compound (357 mg, 48% yield); 1H NMR (300 MHz, CDCl3) δ 8.22 – 8.09 (m, 2H), 7.77 – 7.65 (m, 1H), 7.55 – 7.45 (m, 3H), 7.40 – 7.21 (m, 3H), 1.60 (s, 6H); ESI MS m/z: [M+Na]+ 222.
3,3-Dimethyl-2-(pyridin-3-yl)-3H-indole (23b).
Starting from 22b (300 mg, 2.01 mmol) compound 23b was obtained following the procedure described for the preparation of 23a. Purification by column chromatography on silica gel (EtOAc/ n-hexane 1:2) afforded the title compound (134 mg, 30% yield); 1H NMR (300 MHz, CDCl3) δ 9.31 (s, 1H), 8.70 (d, J = 4.7 Hz, 1H), 8.48 (d, J = 8.1 Hz, 1H), 7.70 (d, J = 7.6 Hz, 1H), 7.45 – 7.25 (m, 4H), 1.59 (s, J = 0.6 Hz, 6H); ESI MS m/z: [M+H]+ 223.
3,3-Dimethyl-2-(pyridin-4-yl)-3H-indole (23c).
Compound 23c was obtained from 22c (745 mg, 5.0 mmol) following the procedure described for the preparation of 23a. Purification by column chromatography on silica gel (EtOAc/ n-hexane 1:1) afforded the title compound (333 mg, 30% yield); 1H NMR (300 MHz, CDCl3) δ 8.76 (d, J = 4.7 Hz, 2H), 7.96 (d, J = 6.2 Hz, 2H), 7.79 – 7.69 (m, 1H), 7.48 – 7.29 (m, 3H), 1.59 (s, 6H); ESI MS m/z: [M+H]+ 223.
5-Methoxy-3,3-dimethyl-2-(pyridin-3-yl)-3H-indole (23d).
Starting from 22b (500 mg, 3.36 mmol) and 4-methoxyphenyl)hydrazine (587 mg, 3.36 mmol), compound 23d was obtained following the procedure described for the preparation of 23b. Purification by column chromatography on silica gel (EtOAc/ n-hexane 1:1) afforded the title compound (322 mg, 38% yield); 1H NMR (300 MHz, CDCl3) δ 9.27 (s, 1H), 8.67 (d, J = 3.2 Hz, 1H), 8.51 – 8.36 (m, 1H), 7.61 (d, J = 9.2 Hz, 1H), 7.46 – 7.34 (m, 1H), 6.95 – 6.80 (m, 2H), 3.87 (s, 3H), 1.58 (s, 6H); ESI MS m/z: [M+H]+ 253.
(±)-3,3-Dimethyl-2-phenylindoline ((±)-24a).
To a solution of 23a (500 mg, 2.26 mmol) in MeOH (25 mL), NaBH4 (513 mg, 13.56 mmol) was added. The reaction was stirred for 12 h at 50 °C. Then the reaction was quenched with a saturated solution of NaHCO3 (10 mL), MeOH was removed under reduced pressure, and the residue was dissolved with EtOAc and washed with H2O (3 × 20 mL). The organic phase was dried over Na2SO4 and solvents removed in vacuo to give a residue which was purified by flash column chromatography on silica gel (MeOH/DCM 1:30) (304 mg, 60% yield); 1H NMR (300 MHz, CDCl3) δ 7.45 – 7.38 (m, 1H), 7.34 – 7.26 (m, 3H), 7.26 – 7.13 (m, 2H), 6.80 – 6.71 (m, 1H), 6.63 – 6.56 (m, 1H), 4.69 (s, 1H), 3.71 (br, 1H), 1.36 (s, 3H), 0.98 (s, 3H).
(±)-3,3-Dimethyl-2-(pyridin-3-yl)indoline ((±)-24b).
Starting from 23b (500 mg, 2.26 mmol), (±)-24a was obtained following the procedure described for (±)-24a. Purification by column chromatography on silica gel (MeOH/DCM 1:30) (305 mg, 60% yield); 1H NMR (300 MHz, CDCl3) δ 8.67 (s, 1H), 8.56 (d, J = 6.4 Hz, 1H), 7.92 – 7.80 (m, 1H), 7.84 – 7.73 (m, 1H), 7.36 – 7.21 (m, 1H), 7.14 – 6.99 (m, 1H), 6.81 (t, J = 8.0 Hz, 1H), 6.74 (d, J = 7.4 Hz, 1H), 4.61 (s, 1H), 4.08 (br, 1H), 1.44 (s, 3H), 0.74 (s, 3H).
(±)-3,3-Dimethyl-2-(pyridin-4-yl)indoline ((±)-24c).
Starting from 23c (300 mg, 1.02 mmol) compound (±)-24c was obtained following the procedure described for the preparation of (±)-24a. Purification by column chromatography on silica gel (MeOH/DCM 1:20) afforded the title compound (115 mg, 50% yield); 1H NMR (300 MHz, CDCl3) δ 8.57 (d, J = 4.9 Hz, 2H), 7.39 (d, J = 5.1 Hz, 2H), 7.17 – 6.96 (m, 2H), 6.85 – 6.77 (m, 1H), 6.73 (d, J = 7.7 Hz, 1H), 4.57 (s, 1H), 4.10 (br, 1H), 1.46 (s, 3H), 0.72 (s, 3H); ESI MS m/z: [M+H]+ 225.
(±)-5-Methoxy-3,3-dimethyl-2-(pyridin-3-yl)indoline ((±)-24d).
Starting from 23d (327 mg, 1.29 mmol) compound (±)-24d was obtained following the procedure described for the preparation of (±)-24a. Purification by column chromatography on silica gel (MeOH/DCM 1:30) afforded the title compound (259 mg, 79% yield); 1H NMR (300 MHz, CDCl3) δ 8.67 (s, 1H), 8.56 (d, J = 5.5 Hz, 2H), 7.85 (d, J = 7.9 Hz, 1H), 7.44 – 7.31 (m, 1H), 6.90 – 6.80 (m, 1H), 6.73 – 6.52 (m, 2H), 4.59 (s, 1H), 3.87 (s, 3H), 1.42 (s, 3H), 0.74 (s, 3H); ESI MS m/z: [M+H]+ 255.
(±)-Methyl 4-((3,3-dimethyl-2-phenylindolin-1-yl)methyl)benzoate ((±)-25a).
Starting from (±)-24a (506 mg, 3.37 mmol) compound (±)-25a was obtained following the procedure described for the preparation of (±)-11a. Purification by column chromatography on silica gel (EtOAc/ n-hexane 1:20) afforded the title compound (1050 mg, 84% yield); 1H NMR (300 MHz, CDCl3) δ 7.99 (d, J = 8.3 Hz, 2H), 7.44 – 7.15 (m, 6H), 7.14 – 6.88 (m, 2H), 6.79 (t, J = 7.9 Hz, 1H), 6.39 (d, J = 7.8 Hz, 1H), 4.43 (d, J = 16.4 Hz, 1H), 4.29 (s, 1H), 4.05 (d, J = 16.4 Hz, 1H), 3.92 (s, 3H), 1.41 (s, 3H), 0.84 (s, 3H); ESI MS m/z: [M+H]+ 372, [M+Na]+ 394.
(±)-Methyl 4-((3,3-dimethyl-2-(pyridin-3-yl)indolin-1-yl)methyl)benzoate ((±)-25b).
Starting from (±)-24b (130 mg, 0.585 mmol) compound (±)-25b was obtained following the procedure described for the preparation of (±)-11a. Purification by column chromatography on silica gel (EtOAc/ n-hexane 1:3) (43 mg, 20% yield); 1H NMR (300 MHz, CDCl3) δ 8.57 (br, 1H), 7.97 (d, J = 8.2 Hz, 2H), 7.70 (br, 1H), 7.33 (d, J = 8.0 Hz, 2H), 7.06 (dd, J = 12.1, 4.4 Hz, 2H), 6.82 (t, J = 7.4 Hz, 1H), 6.43 (d, J = 7.9 Hz, 1H), 4.37 (d, J = 16.2 Hz, 1H), 4.28 (s, 1H), 4.04 (d, J = 16.4 Hz, 1H), 3.91 (s, 3H), 1.40 (s, 3H), 0.83 (s, 3H); ESI MS m/z: [M+H]+ 372, [M+Na]+ 394;
(+)-Methyl 4-((3,3-dimethyl-2-(pyridin-3-yl)indolin-1-yl)methyl)benzoate ((+)-25b).
1H NMR data are identical to those of the racemic mixture (±)-25b; [α]D20 = +51.0 (c 0.58, CHCl3);
(−)-Methyl 4-((3,3-dimethyl-2-(pyridin-3-yl)indolin-1-yl)methyl)benzoate ((−)-25b).
1H NMR data are identical to those of the racemic mixture (±)-25b; [α]D20 D = −52.0 (c 0.63, CHCl3).
(±)-Methyl 4-((5-methoxy-3,3-dimethyl-2-(pyridin-3-yl)indolin-1-yl)methyl)benzoate ((±)-25c).
Starting from (±)-24c (102 mg, 0.40 mmol) compound (±)- 25c was obtained following the procedure described for the preparation of (±)-21a. Purification by column chromatography on silica gel (EtOAc/ n-hexane 1:2) afforded the title compound (39 mg, 24% yield); 1H NMR (300 MHz, CDCl3) δ 8.57 (s, 1H), 7.97 (d, J = 8.4 Hz, 2H), 7.36 (d, J = 7.9 Hz, 2H), 7.33 – 7.18 (m, 2H), 6.70 (d, J = 2.5 Hz, 1H), 6.61 – 6.53 (m, 1H), 6.30 (d, J = 8.5 Hz, 2H), 4.28 (d, J = 16.4 Hz, 1H), 4.22 (s, 1H), 3.98 (d, J = 16.2 Hz, 1H), 3.91 (s, 3H), 3.76 (s, 3H), 1.39 (s, 3H), 0.83 (s, 3H); ESI MS m/z: [M+H]+ 403 [M+Na]+ 426.
(±)-Methyl 5-((3,3-dimethyl-2-(pyridin-3-yl)indolin-1-yl)methyl)thiophene-2-carboxylate ((±)-25d).
To a solution of (±)-24b (140 mg, 0.63 mmol) in dry DCM (3 mL), was added a solution of 20 (106 mg, 0.63 mmol) in dry DCM (3 mL). After 1 h at 25 °C, NaBH(OAc)3 (668 mg, 2.52 mmol) was added and reaction mixture was stirred at 50 °C for 12 h. The reaction was treated with a saturated solution of NaHCO3 and organic products were extracted with DCM. The combined organic layers were washed with brine, dried over Na2SO4 and concentrated in vacuo. Purification by column chromatography on silica gel (PetEt/Et2O 2:1) afforded the title compound (126 mg, 53% yield); 1H NMR (300 MHz, CDCl3) δ 8.64 – 8.49 (m, 2H), 7.81 (br, 1H), 7.62 (d, J = 3.8 Hz, 1H), 7.39 – 7.28 (m, 1H), 7.15 – 6.98 (m, 2H), 6.87 – 6.75 (m, 2H), 6.61 (d, J = 7.8 Hz, 1H), 4.50 (d, J = 16.2 Hz, 1H), 4.22 (s, 1H), 4.16 (d, J = 16.3 Hz, 1H), 1.35 (s, 3H), 0.79 (s, 3H); ESI MS m/z: [M+H]+ 379.
(±)-Methyl 4-(4-((3,3-dimethyl-2-(pyridin-3-yl)indolin-1-yl)methyl)phenoxy)butanoate ((±)-25e).
Starting from (±)-24b (61 mg, 0.27 mmol) and 16 (60 mg, 0.27 mmol) compound (±)-25f was obtained following the procedure described for the preparation of (±)-25e. Purification by column chromatography on silica gel (PetEt/Et2O 1:1) and afforded the title compound (23 mg, 20% yield); 1H NMR (300 MHz, CDCl3) δ 8.56 (d, J = 4.8 Hz, 2H), 7.71 (br, 1H), 7.32 – 7.18 (m, 2H), 7.16 – 6.99 (m, 4H), 6.85 – 6.71 (m, 2H), 6.55 (d, J = 7.8 Hz, 1H), 4.35 (d, J = 15.5 Hz, 1H), 4.22 (s, 1H), 3.97 (t, J = 6.1 Hz, 2H), 3.90 (d, J = 15.5 Hz, 1H), 3.69 (s, 3H), 2.52 (t, J = 7.3 Hz, 2H), 2.15 – 2.01 (m, 2H), 1.37 (s, 3H), 0.79 (s, 3H); ESI MS m/z: [M+H]+ 431.
(±)-Methyl 4-((3,3-dimethyl-2-(pyridin-4-yl)indolin-1-yl)methyl)benzoate ((±)-25f).
Starting from (±)-24d (150 mg, 0.67 mmol) compound (±)- 25d was obtained following the procedure described for the preparation of (±)-11a. Purification by column chromatography on silica gel (EtOAc/n-hexane 1:2) afforded the title compound (62 mg, 25% yield); 1H NMR (300 MHz, CDCl3) δ 8.57 (d, J = 5.1 Hz, 2H), 7.98 (d, J = 8.4 Hz, 2H), 7.38 – 7.21 (m, 4H), 7.11 – 6.96 (m, 2H), 6.88 – 6.72 (m, 1H), 6.43 (d, J = 8.2 Hz, 1H), 4.39 (d, J = 16.4 Hz, 1H), 4.25 (s, 1H), 4.05 (d, J = 16.4 Hz, 1H), 3.91 (s, 3H), 1.42 (s, 3H), 0.81 (s, 3H); ESI MS m/z: [M+Na]+ 395.
(±)-4-((3,3-Dimethyl-2-phenylindolin-1-yl)methyl)-N-hydroxybenzamide (6g).
Starting from (±)-25a (100 mg, 0.27 mmol) compound 6g was obtained following the procedure described for the preparation of 6a. Purification by column chromatography on silica gel (MeOH/DCM NH4OH 1:20:0.1) afforded the title compound (18 mg, 18% yield); 1H NMR (300 MHz, DMSO) δ 7.67 (d, J = 8.2 Hz, 2H), 7.43 – 7.21 (m, 7H), 7.12 – 6.84 (m, 2H), 6.71 (t, J = 7.4 Hz, 1H), 6.43 (d, J = 7.8 Hz, 1H), 4.45 (d, J = 16.2 Hz, 1H), 4.24 (s, 1H), 4.00 (d, J = 16.3 Hz, 1H), 1.35 (s, 3H), 0.76 (s, 3H); 13C NMR (75 MHz, DMSO) δ 164.2, 150.8, 141.7, 138.7, 137.9, 132.4, 129.0, 128.4, 127.4, 127.9, 127.6, 122.7, 119.0, 108.7, 79.7, 50.7, 44.6, 27.2, 25.8; ESI MS m/z: [M+H]+ 373, [M+Na]+ 395; HRMS-ESI m/z: [M+Na]+ calcd for C24H24N2O2Na 395.1730; found 395.1727; HPLC RT: 19.0 min.
(±)-4-((3,3-Dimethyl-2-(pyridin-3-yl)indolin-1-yl)methyl)-N-hydroxybenzamide (6h).
Starting from (±)-25b (40 mg, 0.114 mmol), compound (±)-6h was obtained following the procedure described for the preparation of 6a. Purification by column chromatography on silica gel (MeOH/DCM/ NH4OH 1:8:0.1) afforded the title compound (14 mg, 33% yield); 1H NMR (300 MHz, CD3OD) δ 11.01 (br, 1H), 9.06 (br, 1H), 8.52 (dd, J = 4.8, 1.5 Hz, 2H), 7.75 (d, J = 7.8 Hz, 1H), 7.67 (d, J = 8.2 Hz, 2H), 7.44 – 7.37 (m, 1H), 7.29 (d, J = 8.2 Hz, 2H), 7.07 (d, J = 7.2 Hz, 1H), 6.99 (dd, J = 8.2, 7.1 Hz, 1H), 6.70 (t, J = 7.3 Hz, 1H), 6.44 (d, J = 7.8 Hz, 1H), 4.46 – 4.29 (m, 2H), 3.97 (d, J = 16.4 Hz, 1H), 1.32 (s, 3H), 0.71 (s, 3H); 13C NMR (75 MHz, CD3OD): δ 167.3, 166.7, 150.5, 148.9, 148.4, 142.5, 138.0, 134.5, 131.2, 127.6, 127.5, 127.2, 123.9, 122.0, 119.3, 108.6, 77.8, 53.6, 44.6, 25.9, 24.5; ESI MS m/z: [M+H]+ 374; HRMS-ESI m/z: [M+H]+ calcd for C23H24N3O2 374.1869; found 374.1862; HPLC RT: 10.4 min.
(+)-4-((3,3-Dimethyl-2-(pyridin-3-yl)indolin-1-yl)methyl)-N-hydroxybenzamide ((+)-6h).
Starting from (+)-25b (23 mg, 0.062 mmol), compound (+)-6h was obtained following the procedure described for the preparation of 6a. Purification by column chromatography on silica gel (MeOH/DCM/NH4OH 1:8:0.1) afforded the compound (9 mg, 38% yield); 1H NMR data are identical to those of the racemic mixture ((±)-6h); [α]D20 = +35.0 (c 0.16, CHCl3);
(−)-4-((3,3-Dimethyl-2-(pyridin-3-yl)indolin-1-yl)methyl)-N-hydroxybenzamide ((−)-6h).
Starting from (−)-25b (20 mg, 0.054 mmol), compound (−)-6h was obtained following the procedure described for the preparation of 6a. Purification by column chromatography on silica gel (MeOH/DCM/NH4OH 1:8:0.1) afforded the title compound (8 mg, 34% yield); 1H NMR data are identical to those of the racemic mixture ((−)-6h); [α]D20 = −36.0 (c 0.39, CHCl3);
(±)-N-Hydroxy-4-((5-methoxy-3,3-dimethyl-2-(pyridin-3-yl)indolin-1-yl)methyl)benzamide (6i).
Compound 6i was obtained from (±)-25c (32 mg, 0.08 mmol) following the procedure described for the preparation of 6a. Purification by column chromatography on silica gel (DCM/ MeOH/NH4OH 0.1:1:8) afforded the title compound (16 mg, 49% yield); 1H NMR (300 MHz, CD3OD) δ 11.12 (br, 1H), 8.98 (br, 1H), 8.61 – 8.44 (m, 2H), 7.67 (d, J = 8.1 Hz, 2H), 7.43 – 7.33 (m, 1H), 7.32 (d, J = 8.1 Hz, 2H), 6.75 (d, J = 2.5 Hz, 1H), 6.62 – 6.51 (m, 2H), 6.30 (d, J = 8.4 Hz, 1H), 4.32 – 4.21 (m, 2H), 3.90 (d, J = 16.3 Hz, 1H), 3.64 (s, 3H), 1.30 (s, 3H), 0.71 (s, 3H); 13C NMR (75 MHz, CD3OD) δ 166.7, 154.4, 148.9, 148.3, 144.6, 142.7, 139.6, 137.2, 134.5, 131.1, 127.6, 127.1, 123.8, 112.0, 109.4, 109.2, 78.6, 55.1, 52.3, 44.7, 25.2, 24.3; ESI MS m/z: [M+H]+ 404; HPLC RT: 9.5 min.
(±)5-((3,3-dimethyl-2-(pyridin-3-yl)indolin-1-yl)methyl)-N-hydroxythiophene-2-carboxamide (6j).
Compound 6j was obtained from (±)-25d (65 mg, 0.17 mmol) following the procedure described for the preparation of 6a. Purification by column chromatography on silica gel (NH4OH/MeOH/DCM 0.1:1:10) afforded the title compound (52 mg, 77% yield); 1H NMR (300 MHz, DMSO) δ 11.14 (br, 1H), 8.99 (br, 1H), 8.54 (d, J = 5.2 Hz, 2H), 7.67 (d, J = 8.2 Hz, 2H), 7.37 – 7.22 (m, 4H), 7.06 (d, J = 7.3 Hz, 1H), 6.99 (t, J = 7.7 Hz, 1H), 6.70 (t, J = 7.4 Hz, 1H), 6.45 (d, J = 7.8 Hz, 1H), 4.40 (d, J = 16.4 Hz, 1H), 4.31 (s, 1H), 3.98 (d, J = 16.4 Hz, 1H), 1.34 (s, 3H), 0.69 (s, 3H); 13C NMR (75 MHz, DMSO) δ 172.7, 164.7, 150.6, 150.3, 147.2, 141.7, 138.3, 132.2, 128.0, 127.7, 123.8, 122.7, 119.3, 108.9, 78.5, 55.5, 44.8, 27.3, 25.6; ESI MS m/z: [M+H]+ 374 [M+Na]+ 396; HRMS-ESI m/z: [M+H]+ calcd for C23H24N3O2 374.1863; found 374.1853; HPLC RT: 10.1 min.
(±)-4-(4-((3,3-Dimethyl-2-(pyridin-3-yl)indolin-1-yl)methyl)phenoxy)-N-hydroxybutanamide (6k).
Compound 6k was obtained from (±)-25e (74 mg, 0.20 mmol) following the procedure described for the preparation of 6a. Purification by column chromatography on silica gel (NH4OH/MeOH/DCM 0.1:1:12) afforded the title compound (48 mg, 63% yield); 1H NMR (300 MHz, CD3OD) δ 8.61 – 8.45 (m, 2H), 7.92 (br, 1H), 7.50 – 7.45 (m, 1H), 7.43 – 7.35 (m, 1H), 7.08 – 7.01 (m, 2H), 6.86 – 6.74 (m, 2H), 6.70 (d, J = 7.8 Hz, 1H), 4.60 (d, J = 16.3 Hz, 1H), 4.25 (s, 1H), 4.17 (d, J = 16.3 Hz, 1H), 1.33 (s, 3H), 0.74 (s, 3H); 13C NMR (75 MHz, CD3OD) δ 161.7, 149.4, 149.0, 148.5, 145.9, 138.2, 137.2, 134.9, 134.0, 128.1, 127.5, 126.4, 124.3, 122.0, 119.2, 109.1, 76.9, 45.7, 44.7, 25.4, 24.6. ESI MS m/z: [M+H]+ 380; HRMS-ESI m/z: [M+H]+ calcd for C21H22N3O2S 380.1427; found 380.1422; HPLC RT: 11.7 min.
(6l).
Compound 6l was obtained from (±)-25f (20 mg, 0.047 mmol) following the procedure described for the preparation of 6a. Purification by column chromatography on silica gel (NH4OH/MeOH/DCM 0.1:1:12) afforded the title compound (16 mg, 79% yield); 1H NMR (300 MHz, CD3OD) δ 8.47 (d, J = 4.9 Hz, 2H), 7.81 (s, 1H), 7.48 – 7.33 (m, 1H), 7.15 – 6.94 (m, 4H), 6.80 (d, J = 8.6 Hz, 2H), 6.73 (t, J = 7.9 Hz, 1H), 6.60 (d, J = 8.8 Hz, 1H), 4.36 (d, J = 15.4 Hz, 1H), 4.23 (s, 1H), 4.06 – 3.80 (m, 3H), 2.27 (t, J = 7.3 Hz, 2H), 2.10 – 1.99 (m, 2H), 1.34 (s, 3H), 0.74 (s, 3H); 13C NMR (75 MHz, CD3OD) δ 171.1, 158.3, 150.6, 148.9, 148.1, 137.9, 137.1, 134.7, 129.9, 128.9, 127.4, 123.8, 121.8, 118.8, 114.3, 108.6, 77.0, 66.7, 50.4, 44.4, 29.1, 25.9, 25.2, 24.5; ESI MS m/z: [M+H]+ 432; HRMS-ESI m/z: [M+Na]+ calcd for C26H29N3O3Na 454.2101; found 454.2099; HPLC RT: 10.0 min.
tert-Butyl 4-nicotinoylpiperidine-1-carboxylate (27).
Compound 27 was obtained from 26 (1.9 g, 5.09 mmol) following the procedure described for the preparation of 8a. Purification by column chromatography on silica gel (DCM/MeOH 30:1) afforded the title compound (quantitative yield); 1H NMR (300 MHz, CDCl3) δ 9.23 – 9.03 (m, 1H), 8.79 (dd, J = 4.8, 1.7 Hz, 1H), 8.22 (dt, J = 8.0, 2.0 Hz, 1H), 7.52 – 7.33 (m, 1H), 4.36 – 3.89 (m, 2H), 3.52 – 3.20 (m, 1H), 2.91 (t, J = 12.7 Hz, 2H), 1.97 – 1.79 (m, 2H), 1.79 – 1.64 (m, 2H), 1.46 (s, 9H); ESI MS m/z: [M+H]+ 291.
tert-Butyl 2-(pyridin-3-yl)spiro[indole-3,4’-piperidine]-1’-carboxylate (28).
Compound 28 was obtained from 27 (116 mg, 0.40 mmol) following the procedure described for the preparation of 9a. The crude of this reaction was immediately dissolved in THF (5 mL) and 0.5 M NaOH (5 mL) then treated with Boc2O (134 mg, 0.62 mmol). The mixture was stirred at 25 °C for 2 h then H2O was added, and the crude was extracted with EtOAc (3 × 10 mL). The combined organic layers were dried over Na2SO4, evaporated and purification by column chromatography on alumina (EtOAc/ n-hexane 1:4) affording the title compound (20 mg, 14% yield, over two steps); 1H NMR (300 MHz, CDCl3) δ 9.26 (dd, J = 2.3, 1.0 Hz, 1H), 8.70 (dd, J = 4.8, 1.5 Hz, 1H), 8.46 – 8.23 (m, 1H), 7.78 (t, J = 8.0 Hz, 2H), 7.55 – 7.35 (m, 2H), 7.35 – 7.13 (m, 1H), 4.25 (br, 2H), 3.47 (t, J = 13.4 Hz, 2H), 2.61 – 2.29 (m, 2H), 1.63 – 1.31 (m, 11H); ESI MS m/z: [M+H]+ 364.
tert-Butyl 2-(pyridin-3-yl)spiro[indoline-3,4’-piperidine]-1’-carboxylate ((±)-29).
Compound (±)-29 was obtained from 28 (24 mg, 0.29 mmol) following the procedure described for the preparation of 10d. The crude material was used in the next step without further purification, affording the title compound (24 mg, quantitative yield); 1H NMR (300 MHz, CDCl3) δ 8.69 – 8.42 (m, 2H), 7.64 (d, J = 8.1 Hz, 1H), 7.35 – 7.18 (m, 2H), 7.12 (td, J = 7.6, 1.2 Hz, 1H), 6.90 – 6.54 (m, 2H), 4.61 (s, 1H), 4.19 (br, 1H), 3.88 – 3.53 (m, 2H), 3.48 – 3.27 (m, 1H), 3.27 – 2.97 (m, 1H), 1.98 – 1.75 (m, 2H), 1.75 – 1.55 (m, 1H), 1.42 (s, 10H); ESI MS m/z: [M+H]+ 366.
tert-Butyl 1-(4-(methoxycarbonyl)benzyl)-2-(pyridin-3-yl)spiro[indoline-3,4’-piperidine]-1’-carboxylate ((±)-30).
Compound (±)-30 was obtained from (±)-29 (24 mg, 0.07 mmol) following the procedure described for the preparation of 11a. Purification by column chromatography on silica gel (PetEt/EtOAc 4:1) afforded the title compound (10 mg, 30% yield); 1H NMR (300 MHz, CDCl3) δ 8.56 (dd, J = 4.9, 1.7 Hz, 1H), 8.34 (br, 1H), 7.97 (d, J = 8.3 Hz, 2H), 7.52 (br, 1H), 7.37 – 7.16 (m, 4H), 7.11 (td, J = 7.7, 1.2 Hz, 1H), 6.78 (td, J = 7.5, 1.0 Hz, 1H), 6.42 (d, J = 7.8 Hz, 1H), 4.50 – 4.21 (m, 2H), 4.02 – 3.83 (m, 4H), 3.83 – 3.66 (m, 1H), 3.66 – 3.50 (m, 1H), 3.50 – 3.31 (m, 1H), 3.09 (s, 1H), 1.97 – 1.80 (m, 2H), 1.80 – 1.60 (m, 2H), 1.42 (s, 9H).; ESI MS m/z: [M+H]+ 514.
tert-Butyl 1-(4-(hydroxycarbamoyl)benzyl)-2-(pyridin-3-yl)spiro[indoline-3,4’-piperidine]-1’-carboxylate (6m).
Compound (±)-6m was obtained from (±)-30 (10 mg, 0.02 mmol) following the procedure described for the preparation of 6a. Purification by column chromatography on silica gel (NH4OH/DCM/MeOH 0.1:30:1) afforded the title compound (5 mg, 51% yield); 1H NMR (300 MHz, CD3OD) δ 8.48 (s, 1H), 8.38 (s, 1H), 7.68 (d, J = 8.1 Hz, 3H), 7.50 – 7.17 (m, 4H), 7.09 (t, J = 7.7 Hz, 1H), 6.75 (t, J = 7.4 Hz, 1H), 6.48 (d, J = 7.9 Hz, 1H), 4.57 (s, 1H), 4.41 (d, J = 16.1 Hz, 1H), 3.95 (d, J = 15.9 Hz, 1H), 3.87 – 3.68 (m, 1H), 3.68 – 3.40 (m, 2H), 3.13 – 2.86 (m, 1H), 2.06 – 1.63 (m, 4H), 1.41 (s, 9H); 13C NMR (75 MHz, CD3OD) δ 166.5, 155.1, 150.5, 148.7, 142.2, 135.2, 134.0, 131.0, 129.5, 129.3, 128.0, 127.4, 127.0, 123.4, 123.3, 118.2, 106.9, 79.7, 49.8, 36.1, 31.0, 29.4, 29.1, 27.2; ESI MS m/z: [M+H]+ 515; HRMS-ESI m/z: [M+Na]+ calcd for C30H34N4O4Na 537.2472; found 537.2463; HPLC RT: 12.3 min.
Stereochemical Characterization of compound 25b.
Enantioselective HPLC.
The racemic mixture of compound (±)-25b (1 mg/mL) was resolved by enantioselective HPLC using a Daicel Chiralcel OD column (cellulose tris(3,5-dimethylphenylcarbamate), 250×10 mm I.D.), n-hexane/2-propanol (60:40 v/v) mixture as mobile phase, 4.5 mL/min flow rate, and 50 μL injection volume. The two enantiomers were collected and analyzed by polarimetry to determine their specific rotation ([α]D20). The enantiomeric excess (e.e.) of both fractions was then determined by HPLC analysis using the same enantioselective method used for the resolution of the racemic mixture (Figure S1).
Experimental spectroscopy.
The experimental chiroptical properties of 25b were determined by spectroscopic analysis on a sample of (−)-25b (300 μM in 2-propanol). Ultraviolet (UV) absorption and ECD spectra were measured in the 400–215 nm spectral range at 25 °C on a Jasco J-810 spectropolarimeter (Tokyo, Japan) using a QS grade quartz cell (Hellma Analytics, Germany) with a 1 mm optical pathlength, a 2 nm spectral bandwidth, a 2 s data integration time, a 50 nm/min scanning speed, a 0.2 nm data pitch and an accumulation cycle of 3 runs. Spectra were then blank-corrected and converted to molar units.
Computational spectroscopy.
The theoretical chiroptical properties of 25b were determined by quantum mechanical (QM) calculations based on TD-DFT. A preliminary conformational search on (S)-25b was performed by molecular mechanics (MM) calculations using the MMFF94s force field50 and the Spartan’0251 software. DFT geometry optimization was carried out on 35 conformers having relative MM energy (ΔEMM) below 5 kcal mol−1 using the Gaussian 09 software;52 the B97D functional,53 the def2-TZVP basis set54,55 and the IEFPCM solvation model56 for 2-propanol (2-PrOH) were employed. Conformational clustering was performed with a RMSD threshold value of 0.01 Å for heavy atoms; details on the resulting 27 optimized conformers, including relative electronic energies (ΔEQM), are reported in the Supporting Information (Table S1). TD-DFT calculations were performed on all optimized conformers using the Gaussian 09 software;52 the PBE0 functional57,58 was used in combination with the def2-TZVP basis set and the IEFPCM(2-PrOH) solvation model. Oscillator strengths (fj), rotational strengths in dipole length formalism (Rj), and excitation energies (expressed as wavelengths (Table S2). The theoretical UV and ECD spectra of conformers were determined by approximation of fj and Rj values to Gaussian bands (Δσ = 0.4 eV)59 and sum over all states; the theoretical spectra of (S)-25b were derived by conformational averaging, according to the Boltzmann populations of conformers at 298.15 K and 1 atm based on ΔEQM values (χQM), then compared to the experimental spectra of (−)-25b by means of the Pearson correlation coefficient (r).
Crystal Structure determination of the zfHDAC6 Complex.
The expression, purification, and crystallization of histone deacetylase 6 catalytic domain 2 (CD2) from Danio rerio (zebrafish; here, referred to simply as “zfHDAC6”) was achieved as recently described.33,60 Using a Mosquito crystallization robot (TTP Labtech), a 100-nL drop of protein solution [10 mg/mL zfHDAC6, 50 mM 4-(2-hydroxyethyl)-1-piperazineethanesulfonic acid (HEPES) (pH 7.5), 100 mM KCl, 5% glycerol (v/v), 1 mM tris(2-carboxyethyl)phosphine (TCEP), and 2 mM 6h] was combined with a 100-nL drop of precipitant solution [0.2 M ammonium phosphate dibasic and 20% PEG 3350] and equilibrated against 80 μL of precipitant solution in the well reservoir surrounding the sitting drop. Crystals formed within 2–3 days at 4 °C were soaked in mother liquor augmented with 20% ethylene glycol for cryoprotection before flash-cooling.
X-ray diffraction data were collected on Northeastern Collaborative Access Team (NE-CAT) beamline 24-ID-C at the Advanced Photon Source (APS). The CCP4 program suite was employed for data reduction:61 iMosflm62 was used to index the data, and Aimless63 was used to scale the data. In order to phase the initial electron density map of the enzyme-inhibitor complex by molecular replacement, Phaser64 was utilized; the structure of unliganded zfHDAC6 (PDB 5EEM) was used as a search probe. The atomic model of the enzyme-inhibitor complex was built and manipulated using the interactive graphics program Coot,65 and the structure was refined using Phenix.66 The inhibitor was added to well-defined electron density in the final stages of refinement. Occasional spurious electron density peaks were left unmodelled. MolProbity67 was used to validate the final structure prior to deposition of the atomic coordinates in the Protein Data Bank (www.rcsb.org). All data reduction and refinement statistics are recorded in Table S3.
Molecular docking simulations.
Molecular docking simulations were performed using a multicore workstation (72 Intel Xeon E5–2695 v4@2.10 GHz processors and two NVIDIA GeForce 1070 GTX GPU) with Ubuntu 18.04 OS, running Maestro release 2016 (Schrödinger, LLC, New York, NY, 2016). Figures illustrating docking outputs were prepared using PyMOL (The PyMOL Molecular Graphics System, v1.8.4.0, Schrödinger LLC, New York, 2015).
Proteins and ligands preparation.
Crystal structures of human HDAC1 (PDB ID 4BKX)68 and HDAC6 (PDB ID 5EDU)33 were taken from PDB, while zfHDAC6 was provided by our co-workers. The proteins were submitted to Protein Preparation Wizard (PPW) protocol implemented in Maestro suite release 2016 in order to obtain suitable protein structures for molecular docking calculations as previously reported for the same proteins.28,29 Ligands, water molecules and compounds used in the crystallization process were removed maintaining the Zn2+.28,29 By following PPW protocol we performed a series of computational steps to: (1) generate metal binding state for the enzymes (2) add hydrogens, (3) optimize the orientation of hydroxyl groups, Asn, and Gln, and the protonation state of His, and (4) perform a constrained minimization refinement with the impref utility. The refined proteins were used in molecular docking calculation as reported in the next paragraph.
Ligands were built in Maestro and minimized by MacroModel (MacroModel, Schrödinger Release 2016) software using OPLS-2005 as force field. Moreover, the resulting compounds were treated by LigPrep application (LigPrep, Schrödinger Release 2016) in order to generate the most probable ionization state at cellular pH (7.4 ± 0.2) as reported by us.69,70 Moreover, according to the evidence reported in literature,71–74 we used a neutral hydroxamic acid moiety of the compounds since the hydroxamic acid proton should not be transferred in HDAC isoforms containing histidine residues in the binding site, close to the reactive metal center as in the case of HDAC1 and HDAC6.28,31
Computational procedure.
Glide software (Glide, Schrödinger Release 2016) has been employed to perform the docking studies presented in this paper, using the ligands and proteins prepared as above-mentioned, applying Glide extra precision (XP) scoring function. Energy grids were prepared using default value of protein atom scaling factor (1.0 Å) within a cubic box centered on the zinc ion which roughly represents the center of the active sites.28,29 After grid generation with the introduction of metal constrains, the ligands were docked into the enzymes. The number of poses entered to post-docking minimization was set to 50. Glide SP score was evaluated. In order to assess the validity of docking protocol, SAHA and Trichostatin A were used as reference compounds for a re-docking procedure. The docking results revealed a similar accommodation for the above-mentioned reference compounds with respect to the previously published results (data not shown).33,75
In vitro testing of HDAC1, HDAC6, and HDAC8.
OptiPlate-96 black microplates (Perkin Elmer) were employed with an assay volume of 60 μL. Human recombinant HDAC1 (BPS Bioscience, Catalog #: 50051) or human recombinant HDAC6 (BPS Bioscience, Catalog #: 50006) were diluted in incubation buffer (50 mM Tris-HCl, pH 8.0, 137 mM NaCl, 2.7 mM KCl, 1 mM MgCl2 and 1 mg/mL BSA). A total of 52 μL of this dilution were incubated with 3 μL of increasing concentrations of inhibitors in DMSO and 5 μL of the fluorogenic substrate ZMAL (Z-(Ac)Lys-AMC)76,77 (126 μM) at 37 °C. After 90 min incubation time, 60 μL of the stock solution (33 μM Trichostatin A and 6 mg/mL trypsin in trypsin buffer [Tris-HCl 50 mM, pH 8.0, NaCl 100 mM]), were added. After a following incubation at 37 °C for 30 min, the fluorescence was measured on a BMG LABTECH POLARstar OPTIMA plate reader (BMG Labtechnologies, Germany) with an excitation wavelength of 390 nm and an emission wavelength of 460 nm.77,78
Recombinant human HDAC8 was purchased as part of the Fluor de Lys HDAC8 fluorometric drug discovery kit (Enzo Life Sciences, No. BMLAK518). Inhibition assays were performed as previously described (Marek et al, 2018) with minor modifications.30,79 DMSO concentration was kept constant to 0.5%, the enzyme incubated with DMSO only was used as control. To keep safe from the possibility of a slow-binding inhibition, enzyme was preincubated with the selected compounds 15 min before substrate addition to the mixture. The Fluor de Lys substrate was added at the final concentration of 50 μM whereas the enzyme was at concentration of 0.45U/reaction; the reaction was allowed to proceed for 1 h at 30 °C. 2 μM TSA within 50 μL of 1× Developer II was added to quench the reaction and the mixture was further incubated for 1 h at 30 °C. Fluorescence was measured in a plate reader (Varioskan Lux, Thermofisher Scientifica) with excitation wavelength at λ = 370 nm and emission wavelength at λ = 450 nm. IC50 was estimated by nonlinear regression curve fit performed by means of GNU/Octave, according to a generalized form of a dose-response curve equation, as reported by Copeland.80
Cellular studies.
NB4 cells were grown in RPMI-1640 (Sigma-Aldrich, Milan, Italy) culture media, supplemented with 1% L-glutamine (EuroClone, Milan, Italy), 10% heat-inactivated Fetal Bovine Serum (FBS) (GIBCO, Monza, Italy) and antibiotics ((100 U/mL penicillin, 100 μg/mL streptomycin and 250 ng/mL amphotericin-B). U87 cell line was maintained in Eagle’s Minimum Essential Medium (Sigma-Aldrich, Milan, Italy), in presence of 10% FBS. U2OS cells were cultured in high-glucose Dulbecco’s modified Eagle’s medium (DMEM; Gibco; Thermo Fisher Scientific) enriched with 10% FBS and 1% glutamine. All cell lines were maintained in an incubator at 37 °C and 5% CO2.
Western blot analysis methods.
Cancer cells were treated with 6a, 6d, 6e, 6h, and 6l at 5 μM for 30 h. SAHA was used as a positive control at the same time and concentration. For protein extraction lysis buffer (50 mmol/L Tris-HCl, pH 7.4, 150 mmol/L NaCl, 1% NP40, 10 mmol/L NaF, 1 mmol/L PMSF, and protease inhibitor cocktail) was used. Samples were then centrifuged at 13,000 rpm for 30 min at 4 °C and protein concentration quantified by Bradford assay (Bio-Rad). For histone extraction, cells were collected and resuspended in triton extraction buffer [TEB; PBS containing 0.5% Triton × 100 (v/v), 2 mmol/L PMSF, 0.02% (w/v) NaN3], for 10 minutes at 4 °C. Samples were centrifuged at 2,000 rpm for 10 minutes at 4 °C and pellets washed in TEB (half volume). Samples were then resuspended in 0.2 N HCl, and acid histone extraction was carried out overnight at 4 °C. Protein concentration was determined by Bradford assay (Bio-Rad). 35 μg for each protein extract were loaded on 10% polyacrylamide gels and 2 μg of histone extract were instead used on 15% polyacrylamide gel. Samples were then transferred on nitrocellulose membrane (Trans-blot turbo, Biorad catalog: 1704150) and revealed with Anti-Acetylated Tubulin (clone 6–11B-1, Sigma) and Anti-acetyl-histone H3 Antibody (cod: 06599, Millipore). GAPDH (cod: 14C10, Cell Signaling) and H4 (ab31830, Abcam) antibodies were used as loading controls.
3D organoid model assay and MTT assay.
Study population.
ABC from 12 patients with IPF were obtained during bronchoscopy at routine diagnostic work-up. IPF diagnosis was established by a multidisciplinary board according to the American Thoracic Society/European Respiratory Society criteria and was later determined to be consistent with recent guidelines.81–83 All IPF patients signed informed consent prior to inclusion to the study. The studies were approved by the local ethic committees.
Bronchoscopy.
Bronchial epithelial cells were harvested by bronchial brushes of sub-segmental bronchi of the right lower lobe during flexible bronchoscopy within the routine diagnostic work-up at initial diagnosis. None of the patients received antifibrotic treatment prior to bronchoscopy. None of the included subjects was currently smoking.
Isolation of ABC.
ABC were isolated from bronchial brushes of sub-segmental bronchi of the right lower lobe using a similar protocol as recently described.39,84,85 Bronchial brushes were placed in 2 ml of pre-warmed (37 °C) Clonetics™ Bronchial Epithelium Cell Growth Medium (BEGM) (Lonza, CC-3170). Then, airway epithelial cells were pelleted by centrifugation (250×g, 5 min) and disaggregated by resuspension in trypsin/EDTA-solution (0.05%/0.02%) (Merck, L2143) for 5 min at 37 °C. Afterwards, the cell pellet was resuspended in 5 ml of BEGM and seeded in T25 flasks (Merck, CLS3056) in BEGM, supplemented with growth factors according to the manufacturer’s instructions. Cultures were maintained in a humidified atmosphere of 5% CO2 at 37 °C. Media was changed every 7 days and cells were harvested at day 21 when the cells were 90% confluent. Therefore, cells were trypsinized, harvested, and counted. Purity of the ABC was determined by immunocytology (cytokeratin 5 staining) of cytospins and always exceeded 98%.
3D organoid assay.
The bronchosphere forming assay was performed as recently described.39 Briefly, IPF-ABC (104 cells) were added to 50 μL ice cold matrigel (corning® matrigel® matrix (Corning®, 356231) in transwell inserts (Corning Lifesciences Costar, 3470) and cultured for 30 min in the incubator (5% CO2, 37 °C) until the matrigel became stiff. Then 600 μL of a 1:1 ratio of BEGM and DMEM was added below the inserts and additional 100 μl on top of the inserts. Plates (Corning lifesciences Costar, 3470) were cultured at 5% CO2, 37 °C w/wo treatment with compounds 6a, 6d, 6h and 6l. The molecules were tested in a concentration range of 1 to 50 nM for 14 days. Medium exchange was done every 7 days.
Detection of organoid counts and measurement of cell proliferation.
Mosaic photomicrographs were taken from HDAC6 inhibitor treated 3D organoid assays by microscopy using Axio Observer Inverted microscope/Zeiss® and ZEN microscope navigation Software. Numbers of organoids per well were counted by bright field microscopy on day 14. Only organoids with a size of 5 μm or larger were counted. Cell proliferation was quantified using the colorimetric MTT assay (Sigma Aldrich, CT01) on day 14 according to the manufacturer’s instructions. IC50 value were determined from bronchosphere counts and cell proliferation MTT Assay by IC50 Calculator software (AAT Bioquest, Inc. Sunnyvale/USA). The mean value is determined from the IC50 value of the organoid counts and the MTT assay.
Immunohistochemistry.
Formalin fixed IPF lung and normal tissue were used for immunohistochemistry as described.86 Three micrometer thick sections of paraffin blocks were deparaffinized in xylene and rehydrated with a descending alcohol row (as described above). Heat induced antigen retrieval was performed at 110 °C for 2 min in citrate buffer (pH 6.0) using a pressure cooker. At first, staining slides were washed for 5 min with Tris-NaCL buffer and then blocked for 20 min with normal goat serum blocking solution 1:20 (Vector, S1000). For staining procedure rabbit monoclonal Anti HDAC6 antibody [EPR1698(2)] (Abcam, ab133493) was incubated for 1 h at room temperature (1:100). Isotype Control was performed with Universal Negative Control for IS-Series Rabbit Primary Antibodies (Dako/Agilent Technologies, IS60061–2) (1:1000 dilution) overnight at 4 °C.
Slides were washed with Tris NaCl buffer. Incubation time of the Goat IgG anti-rabbit IgG (H + L)-Biotin (Dianova, 111-065-003) (1:800 dilution) was 30 min at 25 °C. Slides were washed with Tris NaCl buffer. Activation was done using alkaline phosphatase Strept AP (1:800 dilution) (Vector, SA-5100) for 30 min and Slides were washed with Tris NaCl buffer. Visualization was performed by DAKO REAL Chromogen Red (Dako Real Kit) (Dako/Agilent Technologies, K500311–2) (incubation time 20 min). Slides were washed with aqua dest.
Counterstain with mMayer`s hemalum solution (Merck, 109249) 1:10 for 90 sec. Slides were washed shortly with aqua dest. and for 90 sec with Shandon™ Bluing Reagent/ (ThermoScientific, 6769001). Before mounting, slides were washed 1 time with aqua dest followed with 3 shortly washing steps in 90% Ethanol (CG Chemikalien), 6 shortly washing steps in 100% Ethanol (CG Chemikalien) and 6 shortly washing steps in Xylol (CG Chemikalien). Finally, slides were cover slipped with Eukitt® Quick-hardening mounting medium, (Merck, 03989). All samples were digitalized using Mirax Scan 150 BF/FL (Zeiss, Germany).
Human lung tissue.
Human lung tissue samples were obtained from healthy areas of lung from patients undergoing lung resection for carcinoma at Glenfield Hospital, Leicester, UK. All patients gave written informed consent, and the study was approved by the National Research Ethics service (reference 10/H0402/12 and 17/EM/0231). Samples obtained were anonymized and coded before use.
Human lung tissue explant culture model.
Pieces of human lung tissue (2 mm3) were generated as described previously40 Tissue was cultured in DMEM + vehicle control (0.1% DMSO) ± TGF-β1 (10 ng/ml) as described,40 or DMEM + TGF-β1 (10 ng/mL) + 6h (0.41 and 4.1 μM) or vehicle control (0.1% DMSO). Tissue was collected on day 7 for RNA extraction.
RNA extraction was performed as described previously.40 Tissue was dissociated using a Precellys® 24 tissue homogenizer (Bertin Technologies, Montigny-le-Bretonneux, France) and total RNA purified using the automated QIAcube with RNeasy Fibrosis Mini kit (Qiagen, CA, USA) according to the manufacturer’s instructions. The RNA integrity was assessed with the Bioanalyzer 2100 system (Agilent, CA, USA), and RIN values >8 accepted as suitable for PCR profiling. RNA concentrations were then measured using the Nanodrop 2000 (Labtech International, East Sussex, UK).
Quantitative Real-time PCR (qRT-PCR) was used to measure mRNA expression levels of α-smooth muscle actin (αSMA), collagens type I and III, and fibronectin using the Quantstudio 5 Real-Time PCR machine (Applied Biosystems). Primer sequences for Collagen type I, III and αSMA have previously been described in Roach et al 2013.87 Qiagen quantitect primer assays (QT00038024) were used for fibronectin, and Taqman assays for HDAC6 (Hs00997427_m1) were acquired from Thermofisher. Gene expression was quantified using Brilliant SYBR Green QRT-PCR 1-Step master mix (Strategene, the Netherlands). All expression data were normalized to β2microglobulin using Quantitect primer assay primers (Qiagen, Germany), HS_B2M_1_SG, and corrected using the reference dye ROX. PCR products were run on a 1.5% agarose gel to confirm product size and each product was sequenced to confirm specificity of the primers. Relative expression was calculated using the 2−ΔΔCt method.
Solubility and chemical stability studies.
HPLC analysis of compounds 6d and 6h.
For the HPLC analysis a Chromolith HPLC column RP-18 was employed. The runs were performed by a gradient elution starting from a mixture 0% MeCN (0.1% TFA as phase modifier) in H2O (0.1% TFA as phase modifier) to 20% MeCN (0.1% TFA) in H2O (0.1% TFA) in 4 min then up to 50% MeCN (0.1% TFA) in H2O in 3 min. The flow speed was settled at 0.8 mL/min and the temperature was maintained at 25 °C. The volume of injection of the sample was of 10 mL and the wavelength selected for the detection was 254 nM. The retention times obtained following this protocol for compounds 6d and 6h were 6.7 min and 6.4 min, respectively.
Solubility assay and chemical stability at 25 °C.
A stock solution for each tested compound was prepared dissolving the sample in DMSO to a final concentration of 10 mM. From the stock solution, three samples were prepared: one was used as the standard solution and the other two as the test solutions at pH 3.0 and pH 7.4. The samples’ concentration of these solutions was 250 μM with a DMSO content of 2.5% (v/v). The standard solution was prepared by dilution of the stock solution in PBS-buffer solution (MeCN/water, 60:40); the dilution of the stock solution in 50 mM acetic acid afforded the samples’ solution at pH 3.0; and the dilution of the stock solution in 50 mM aqueous PBS-buffer afforded the samples’ solution at pH 7.4. These suspensions/solutions were sealed and left for 24 h at 25 °C under orbital shaking to achieve “pseudothermodynamic equilibrium”. After that time the solutions were filtered using PTFE filters and successively diluted 1:2 with the buffer solution used for the preparation of the samples. Then they were analyzed by HPLC/UV/ DAD, using UV detection at 254 nm for quantitation. Solubility was calculated by comparing areas of the sample and of the standard:
S = solubility of the compound (μM); Asmp = UV area of the sample solution; FD = dilution factor (2); Cst = standard concentration (250 μM); Ast = UV area of the standard solution.
For each sample the analysis was performed in triplicate and the solubility result reported was obtained from the average of the three values. The same sample solutions were prepared to evaluate the chemical stability of the compounds after 24 h at 25 °C and analyzed by HPLC/UV/DAD, using UV detection at 254 nm for quantitation. Stability was calculated by comparing the area of the peak at T0 and the area of the peak of the same solution after 24 h. A stability percentage value was calculated by this method at pH 3.0 and pH 7.4 for each compound by applying the following formula:
Ac24 = area of the sample after 24 h at 25 °C; AcT0 = area of the sample at T0. For each sample the analysis was performed in triplicate and the stability result reported was obtained from the average of the three values.
Analysis of in vitro metabolic stability of 6d and 6h in HLM.
The tested compound (6d or 6h), dissolved in MeCN, was incubated at 37 °C, at 5 μM concentration in 100 mM phosphate buffer (pH 7.4) with 0.5 mg/mL rat and human liver microsomal proteins as previously reported.88 CYP-dependent reactions were started by addition of a NADPH-GS (2 mM NADPH), 66 mM glucose-6-phosphate, 0.4 U/mL glucose-6-phosphate dehydrogenase, in 66 mM MgCl2). Reactions were terminated at regular time intervals (overall range 0–60 min) by adding a 1 mL of MeCN. All incubations were performed in triplicate. HPLC analysis was performed on Shimatzu Prominence apparatus equipped with a Chromolith HPLC column RP-18 and coupled with UV-VIS detector, set at λ 254 nm. The analysis was carried out as described above. The intrinsic clearance (Clint) was calculated by the equation:
where k is the rate constant for the depletion of substrate, V is the volume of incubation in μL and P is the amount of microsomal proteins as reported elsewhere.43
Cytotoxicity and mutagenicity assays.
Materials.
Dulbecco’s Modified Eagle’s Medium, trypsin solution, and all the solvents used for cell culture were purchased from Lonza (Switzerland). Mouse immortalized fibroblasts NIH3T3 were purchased from American Type Culture Collection (USA). The mutagenicity assay was supplied by Biologik s.r.l. (Trieste, Italy).
Cell cultures and cytotoxicity assay.
NIH3T3 were utilized for cytotoxicity experiments. Cells were maintained in DMEM at 37 °C in a humidified atmosphere containing 5% CO2. The culture media were supplemented with 10% fetal calf serum (FCS), 1% L-glutamine-penicillin-streptomycin solution, and 1% MEM Non-Essential Amino Acid Solution. Once at confluence, cells were washed with PBS 0.1 M, taken up with trypsin-EDTA solution and then centrifuged at 1000 rpm for 5 min. The pellet was re-suspended in medium solution (dilution 1:15). The stock solution for each compound was prepared in pure DMSO and diluted with complete culture medium. The solution/suspension obtained was then added to the cell monolayer. Cell viability after 24 h of incubation with the different concentrations of each test compound was evaluated by Neutral Red Uptake by the procedure previously reported.89 The data processing included the Student’s t-test with p < 0.05 taken as significance level. First, the following solutions were prepared in order to determine the percentage of viable cells:
Neutral Red (NR) Stock Solution: 0.33 g NR Dye powder in 100 mL sterile H2O
NR Medium: 1.0 mL NR Stock solution +99.0 Routine Culture Medium pre-warmed to 37 °C
NR Desorb solution: 1% glacial acetic acid solution + 50% ethanol + 49% H2O
At the end of the incubation the routine culture medium was removed from each well, and cells were carefully rinsed with 1mL of pre-warmed D-PBS. Multiwells were then gently blotted with paper towels. 1.0 mL of NR Medium was added to each well and further incubated at 37 °C, 95% humidity, 5.0% CO2 for 3 h. The cells were checked during the NR incubation for NR crystal formation. After incubation, the NR Medium was removed; cells were carefully rinsed with 1 mL of pre-warmed D-PBS. Then, the PBS was decanted and blotted from the wells and exactly 1 mL of NR Desorb solution was added to each sample. Multiwells were then put on a shaker for 20–45 min to extract NR from the cells and form a homogeneous solution. During this step the samples were covered in order to protect them from light. After 5 min from the plate shaker removal the absorbance was read at 540 nm by a UV/visible spectrophotometer (Lambda 25, PerkinElmer).
Mutagenicity assay:
Ames test.
The TA100 and TA98 strains of Salmonella Typhimurium and S9 fraction were utilized for mutagenicity assay. Approximately 107 bacteria were exposed to 6 concentrations of each test compound, as well as a positive and a negative control, for 90 min in medium containing sufficient histidine to support approximately two cell divisions. After 90 min, the exposure cultures were diluted in pH indicator medium lacking histidine, and aliquoted into 48 wells of a 384-well plate. Within two days, cells which had undergone the reversion to His grew into colonies. Metabolism by the bacterial colonies reduced the pH of the medium, changing the color of that well. This color change can be detected visually or by microplate reader. The number of wells containing revertant colonies were counted for each dose and compared to a zero-dose control. Each dose was tested in six replicates. The test was performed both with and without S9 fraction.
Toxicity screen of 6h in zebrafish larvae.
All experiments with in-house wildtype zebrafish larvae (Danio rerio) were performed according to ethical exemptions granted by the UCD Animal Research Ethics Committee, University College Dublin (AREC-Kennedy). No animals were used as under European Union Directive 2010/63/EU, larval forms of zebrafish that are not independently feeding and free-living, are not classified as animals. Zebrafish larval experiments were performed with approval from UCD Animal Research Ethics Committee, Ireland. Wildtype (Tübingen) larvae were reared in embryo medium (0.137 M NaCl, 5.5 mM Na2HPO4, 5.4 mM KCl, 1.3 mM CaCl2, 0.44 mM KH2PO4, 1.0 mM MgSO4 and 4.2 mM NaHCO3, conductivity 1200 μS, pH 7) containing methylene blue, at 28.5 °C, 14 h light/10 h dark cycle (parameters measured in the zebrafish facility for the year 2018: pH, temperature and conductivity are reported).90 Adult zebrafish were maintained in a recirculating water system at 28 °C under 14 h light/10 h dark cycle and fed daily with brine shrimp and dry pellet food. Wildtype zebrafish larvae were obtained by incrosses of wildtype adults. The embryos were raised and treated at 3 days old with either increasing concentrations (1, 10, 25, 50 and 100 μM) of compound 6 h or 0.1% of DMSO (vehicle control) for 2 days. 4 larvae were placed per well in 400 μL of respective drug concentrations prepared in embryo media. Eight larvae were used in total per treatment group and experiment was performed in a 48 well plate. Visual behavioural assay – optokinetic reflex assay was performed at 2 days post treatment as described previously,90 to determine to effect of compound 6h on visual function.
Isolated rat heart preparation and perfusion.
All animal care and experimental protocols conformed to the European Union Guidelines for the Care and the Use of Laboratory Animals (European Union Directive 2010/63/EU) and were approved by the Italian Department of Health (666/2015-PR). Male Sprague–Dawley rats (350 g; Charles River Italia, Calco, Italy) n =5 were used for this experiment. Rats were anaesthetized (ip) with a mixture of Zoletil 100® (7.5 mg kg-1 tiletamine and 7.5 mg kg−1 zolazepam; Virbac Srl, Milano, Italy) and Xilor® (4 mg kg−1 xylazine; Bio 98, San Lazzaro, Italy) containing heparin (5000 U/kg), decapitated and bled. The hearts, spontaneously beating, were rapidly explanted and mounted on a Langendorff apparatus for retrograde perfusion via the aorta at a constant flow rate of 10 mL/min with a Krebs–Henseleit solution of the following composition (mM): NaCl 118, KCl 4.7, CaCl2 2.5, MgSO4 1.2, NaHCO3 25, KH2PO4 1.2, glucose 11.5, Na pyruvate 2, and EDTA 0.5, bubbled with a 95% O2−5% CO2 gas mixture (pH 7.4), and kept at 37 °C, as described elsewhere.91 The hearts were allowed to equilibrate for at least 20 min before drug exposure. Heart contractility was measured as left ventricle pressure (LVP) by means of latex balloon, inserted into the left ventricle via the mitral valve and connected to a pressure transducer (BLPR, WPI, Berlin, Germany). The balloon was inflated with deionized water from a microsyringe until a left ventricular end diastolic pressure of 10 mmHg was obtained. Alteration in coronary perfusion pressure (CPP), arising from changes in coronary vascular resistance, were recorded by pressure transducer (BLPR, WPI, Berlin, Germany) placed in the inflow line.92 A surface electrocardiogram (ECG) was recorded at a sampling rate of 1 kHz by means of two steel electrodes, one placed on the apex and the other on the left atrium of the heart. The ECG analysis included the following measurements: RR (cycle length), HR (frequency), PQ (atrioventricular conduction time), QRS (intraventricular conduction time), and QT (overall action potential duration). LVP, CPP, and ECG were recorded with a digital PowerLab data acquisition system (PowerLab 8/30; ADInstruments, Castle Hill, Australia) and analyzed by using Chart Pro for Windows software (PowerLab; ADInstruments, Castle Hill, Australia). LVP was calculated by subtracting the left ventricular diastolic pressure from the left ventricular systolic pressure.48 As the QT interval is affected by heart rate changes (e.g., it shortens with rapid heart rate), Bazett’s formula (QTc = QT/(RR)1/2) was routinely used to avoid confounding effects. Compound 6h was dissolved in DMSO. Solvents failed to alter the response of the preparations (data not shown).
Statistical Analysis.
Data are reported as mean ± SEM; n (indicated in parentheses) represents the number of rat hearts. Analysis of data was accomplished using GraphPad Prism version 5.04 (GraphPad Software, U.S.A.). Statistical analyses and significance as measured by repeated measures ANOVA (followed by Dunnett’s post test or Friedman test) were obtained using GraphPad InStat version 3.06 (GraphPad Software, U.S.A.). In all comparisons, P < 0.05 was considered significant.
Supplementary Material
Table S1. Relative MM energies (ΔEMM), electronic energies (EQM and ΔEQM), free energies (G and ΔG) and corresponding Boltzmann populations (χ) for the conformers of (S)-25b, as obtained after B97D/def2 TZVP/IEFPCM(2 PrOH) optimization.
Table S2. Oscillator strengths (fj), rotational strengths in dipole length formalism (Rj) and excitation wavelengths (λj) for the conformers of (S)-25b, as obtained by PBE0/def2-TZVP/IEFPCM (2-PrOH)//B97D/def2-TZVP/IEFPCM(2-PrOH) calculations.
Table S3. X-ray Crystallographic Data Collection and Refinement Statistics, zfHDAC6–6h complex. Docking Studies of compounds 6a-m (Figures S2–S15).
Figure S16. Isolation of human airway basal cells (ABCs).
Figure S17. Bronchosphere generation blocked by compounds 6a, 6d, 6h and 6l.
1H, 13C NMR spectra and HPLC purity of final compounds (±)-6a-m.
ACKNOWLEDGMENTS
We thank the Regione Toscana-IT grant HIDE-IPF (Bando Salute 2018) and NIH for grant GM49758 (D.W.C.) in support of this research. This research was also funded by AIRC-17217; Campania Regional Government Technology Platform Lotta alle Patologie Oncologiche: iCURE-B21C17000030007; “Epigenetic Hallmarks of Multiple Sclerosis” (acronym Epi-MS) (id:415, Merit Ranking Area ERC LS) in VALERE 2019 Pro-gram; V:ALERE 2020—“CIRCE” D.R. n. 138 del 17/02/2020 Program; Campania Regional Government FASE2: IDEAL; MIUR, Proof of Concept-EPICUREPOC01_00043-B64I19000290008; P.O.R. CAMPANIA Campania ESF Regional Operational Programme 2014/2020 Axis III-B27D18001070006. This work is based upon research conducted at the Northeastern Collaborative Access Team beamlines, which are funded by the National Institute of General Medical Sciences from the National Institutes of Health (P30 GM124165). This research used resources of the Advanced Photon Source; a U.S. Department of Energy (DOE) Office of Science User Facility operated for the DOE Office of Science by Argonne National Laboratory under Contract No. DE-AC02-06CH11357. Prof. Riccardo Zanasi (Department of Chemistry and Biology, University of Salerno, Italy) kindly provided access to the computing cluster used to perform MM and QM calculations for the stereochemical characterization of compound 25b. We thank K. Schmidtkunz for technical assistance in IC50 determination.
ABBREVIATIONS
- ABC
airway basal cells
- AIBN
azobisisobutirronitrile
- BAL
bronchoalveolar lavage
- CLint
intrinsic clearance
- CPP
coronary perfusion pressure
- DCM
dichloromethane
- DMSO
dimethyl sulfoxide
- ECD
electronic circular dichroism
- ECG
electrocardiogram
- EMT
epithelial mesenchymal transition
- EMT
epithelial-mesenchymal transitions
- HDAC
histone deacetylase
- HDACi
HDAC inhibitors
- HLM
human liver microsomal preparations
- ILDs
interstitial lung disease
- IPF
idiopathic pulmonary fibrosis
- k
apparent decay constants
- LVP
left ventricle pressure
- NBS
N-bromosuccinimide
- NMO
4-methylmorpholine N-oxide
- NRU
Neutral Red Uptake
- PQ
atrioventricular conduction time
- QRS
intraventricular conduction time
- RR
cycle length
- t1/2
half-life time
- TD-DFT
time-dependent density functional theory
- TGF-β1
transforming growth factor β1
- THF
tetrahydrofuran
- ZBG
zinc-binding group
- zfHDAC6
zebrafish HDAC6
Footnotes
The authors declare no competing financial interests.
Supporting Information
The Supporting Information is available free of charge on the ACS Publications website at DOI: HPLC separation of racemic mixture (±)-25b.
Recommended compound characterization checklist (PDF)
Recommended compound characterization checklist (XLS)
Molecular Formula Strings
Accession codes
The atomic coordinates and crystallographic structure factors of the HDAC6 complex with inhibitor 6h has been deposited in the Protein Data Bank (www.rcsb.org) with accession code 6V79. Authors will release the atomic coordinates and experimental data upon article publication.
REFERENCES
- (1).Richeldi L; Collard HR; Jones MG Idiopathic Pulmonary Fibrosis. Lancet 2017, 389(10082), 1941–1952. 10.1016/S0140-6736(17)30866-8. [DOI] [PubMed] [Google Scholar]
- (2).Bargagli E; Piccioli C; Rosi E; Torricelli E; Turi L; Piccioli E; Pistolesi M; Ferrari K; Voltolini L Pirfenidone and Nintedanib in Idiopathic Pulmonary Fibrosis: Real-Life Experience in an Italian Referral Centre. Pulmonology 2019, 25(3), 149–153. 10.1016/j.pulmoe.2018.06.003. [DOI] [PubMed] [Google Scholar]
- (3).Selman M; King TE Jr.; Pardo A Idiopathic Pulmonary Fibrosis: Prevailing and Evolving Hypotheses about Its Pathogenesis and Implications for Therapy. Ann. Intern. Med 2001, 134(2), 136–151. 10.7326/0003-4819-134-2-200101160-00015. [DOI] [PubMed] [Google Scholar]
- (4).Chakraborty S; Chopra P; Ambi SV ; Dastidar SG; Ray A Emerging Therapeutic Interventions for Idiopathic Pulmonary Fibrosis. Expert Opin. Investig. Drugs 2014, 23(7), 893–910. 10.1517/13543784.2014.913569. [DOI] [PubMed] [Google Scholar]
- (5).Richeldi L; du Bois RM; Raghu G; Azuma A; Brown KK; Costabel U; Cottin V; Flaherty KR; Hansell DM; Inoue Y; Kim DS; Kolb M; Nicholson AG; Noble PW; Selman M; Taniguchi H; Brun M; Le Maulf F; Girard M; Stowasser S; Schlenker-Herceg R; Disse B; Collard HR Efficacy and Safety of Nintedanib in Idiopathic Pulmonary Fibrosis. N. Engl. J. Med 2014, 370(22), 2071–2082. 10.1056/NEJMoa1402584. [DOI] [PubMed] [Google Scholar]
- (6).King TE; Bradford WZ; Castro-Bernardini S; Fagan EA; Glaspole I; Glassberg MK; Gorina E; Hopkins PM; Kardatzke D; Lancaster L; Lederer DJ; Nathan SD; Pereira CA; Sahn SA; Sussman R; Swigris JJ; Noble PW A Phase 3 Trial of Pirfenidone in Patients with Idiopathic Pulmonary Fibrosis. N. Engl. J. Med 2014, 370(22), 2083–2092. 10.1056/NEJMoa1402582. [DOI] [PubMed] [Google Scholar]
- (7).Brindisi M; Saraswati AP; Brogi S; Gemma S; Butini S; Campiani G Old but Gold: Tracking the New Guise of Histone Deacetylase 6 (HDAC6) Enzyme as a Biomarker and Therapeutic Target in Rare Diseases. J. Med. Chem 2020, 63(1), 23–39. 10.1021/acs.jmedchem.9b00924. [DOI] [PubMed] [Google Scholar]
- (8).Wang XX; Wan RZ; Liu ZP Recent Advances in the Discovery of Potent and Selective HDAC6 Inhibitors. Eur. J. Med. Chem 2018, 143, 1406–1418. 10.1016/j.ejmech.2017.10.040. [DOI] [PubMed] [Google Scholar]
- (9).Roche J; Bertrand P Inside HDACs with More Selective HDAC Inhibitors. Eur. J. Med. Chem 2016, 121, 451–483. 10.1016/j.ejmech.2016.05.047. [DOI] [PubMed] [Google Scholar]
- (10).Yang F; Zhao N; Ge D; Chen Y Next-Generation of Selective Histone Deacetylase Inhibitors. RSC Adv. 2019, 9(34), 19571–19583. 10.1039/C9RA02985K. [DOI] [PMC free article] [PubMed] [Google Scholar]
- (11).Chuang DM; Leng Y; Marinova Z; Kim HJ; Chiu CT Multiple Roles of HDAC Inhibition in Neurodegenerative Conditions. Trends Neurosci. 2009, 32(11), 591–601. 10.1016/j.tins.2009.06.002. [DOI] [PMC free article] [PubMed] [Google Scholar]
- (12).Landucci E; Brindisi M; Bianciardi L; Catania LM; Daga S; Croci S; Frullanti E; Fallerini C; Butini S; Brogi S; Furini S; Melani R; Molinaro A; Lorenzetti FC; Imperatore V; Amabile S; Mariani J; Mari F; Ariani F; Pizzorusso T; Pinto AM; Vaccarino FM; Renieri A; Campiani G; Meloni I IPSC-Derived Neurons Profiling Reveals GABAergic Circuit Disruption and Acetylated α-Tubulin Defect Which Improves after IHDAC6 Treatment in Rett Syndrome. Exp. Cell Res 2018, 368(2), 225–235. 10.1016/j.yexcr.2018.05.001. [DOI] [PMC free article] [PubMed] [Google Scholar]
- (13).Ropero S; Esteller M The Role of Histone Deacetylases (HDACs) in Human Cancer. Mol. Oncol 2007, 1(1), 19–25. 10.1016/j.molonc.2007.01.001. [DOI] [PMC free article] [PubMed] [Google Scholar]
- (14).Qin HT; Li HQ; Liu F Selective Histone Deacetylase Small Molecule Inhibitors: Recent Progress and Perspectives. Expert Opin. Ther. Pat 2017, 27(5), 621–636. 10.1080/13543776.2017.1276565. [DOI] [PubMed] [Google Scholar]
- (15).Mai A; Massa S; Rotili D; Cerbara I; Valente S; Pezzi R; Simeoni S; Ragno R Histone Deacetylation in Epigenetics: An Attractive Target for Anticancer Therapy. Med. Res. Rev 2005, 25(3), 261–309. 10.1002/med.20024. [DOI] [PubMed] [Google Scholar]
- (16).Lyu X; Hu M; Peng J; Zhang X; Sanders YY. HDAC Inhibitors as Antifibrotic Drugs in Cardiac and Pulmonary Fibrosis. Ther. Adv. Chronic Dis 2019, 10, 204062231986269. 10.1177/2040622319862697. [DOI] [PMC free article] [PubMed] [Google Scholar]
- (17).Shan B; Yao TP; Nguyen HT; Zhuo Y; Levy DR; Klingsberg RC; Tao H; Palmer ML; Holder KN; Lasky JA Requirement of HDAC6 for Transforming Growth Factor-B1-Induced Epithelial-Mesenchymal Transition. J. Biol. Chem 2008, 283(30), 21065–21073. 10.1074/jbc.M802786200. [DOI] [PMC free article] [PubMed] [Google Scholar]
- (18).Valenzuela C; Torrisi SE; Kahn N; Quaresma M; Stowasser S; Kreuter M Ongoing Challenges in Pulmonary Fibrosis and Insights from the Nintedanib Clinical Programme. Respir. Res 2020, 21(1), 7. 10.1186/s12931-019-1269-6. [DOI] [PMC free article] [PubMed] [Google Scholar]
- (19).Thiery JP; Sleeman JP Complex Networks Orchestrate Epithelial–Mesenchymal Transitions. Nat. Rev. Mol. Cell Biol 2006, 7(2), 131–142. 10.1038/nrm1835. [DOI] [PubMed] [Google Scholar]
- (20).Zavadil J; Böttinger EP TGF-β and Epithelial-to-Mesenchymal Transitions. Oncogene 2005, 24(37), 5764–5774. 10.1038/sj.onc.1208927. [DOI] [PubMed] [Google Scholar]
- (21).Conforti F; Davies ER; Calderwood CJ; Thatcher TH; Jones MG; Smart DE; Mahajan S; Alzetani A; Havelock T; Maher TM; Molyneaux PL; Thorley AJ; Tetley TD; Warner JA; Packham G; Ganesan A; Skipp PJ; Marshall BJ; Richeldi L; Sime PJ; O’Reilly KMA; Davies DE The Histone Deacetylase Inhibitor, Romidepsin, as a Potential Treatment for Pulmonary Fibrosis. Oncotarget 2017, 8(30), 48737–48754. [DOI] [PMC free article] [PubMed] [Google Scholar]
- (22).Korfei M; Stelmaszek D; MacKenzie BA; Skwarna S; Chillappagari S; Bach AC; Ruppert C; Saito S; Mahavadi P; Klepetko W; Fink L; Seeger W; Lasky JA; Pullamsetti SS; Krämer OH; Guenther A Comparison of the Antifibrotic Effects of the Pan-Histone Deacetylase-Inhibitor Panobinostat versus the IPF-Drug Pirfenidone in Fibroblasts from Patients with Idiopathic Pulmonary Fibrosis. PLoS One 2018, 13(11), e0207915. 10.1371/journal.pone.0207915 [DOI] [PMC free article] [PubMed] [Google Scholar]
- (23).Wang Z; Chen C; Finger SN; d/o Kwajah M.M S; Jung M; Schwarz H; Swanson N; Lareu RR; Raghunath M Suberoylanilide Hydroxamic Acid: A Potential Epigenetic Therapeutic Agent for Lung Fibrosis? Eur. Respir. J 2009, 34(1), 145–155. 10.1183/09031936.00084808. [DOI] [PubMed] [Google Scholar]
- (24).Saito S; Zhuang Y; Shan B; Danchuk S; Luo F; Korfei M; Guenther A; Lasky J Tubastatin Ameliorates Pulmonary Fibrosis by Targeting the TGFβ-PI3K-Akt Pathway. PLoS One 2017, 12 (10), e0186615. [DOI] [PMC free article] [PubMed] [Google Scholar]
- (25).Bruserud O; Stapnes C; Ersvær E; Ryningen BTG and Histone A Deacetylase Inhibitors in Cancer Treatment: A Review of the Clinical Toxicity and the Modulation of Gene Expression in Cancer Cells. Curr Pharm Biotechnol 2007, 8(6), 388–400. 10.2174/138920107783018417. [DOI] [PubMed] [Google Scholar]
- (26).Thomas EA Focal Nature of Neurological Disorders Necessitates Isotype-Selective Histone Deacetylase (HDAC) Inhibitors. Mol. Neurobiol 2009, 40(1), 33–45. 10.1007/s12035-009-8067-y. [DOI] [PubMed] [Google Scholar]
- (27).Yoon S; Kang G; Eom GH HDAC Inhibitors: Therapeutic Potential in Fibrosis-Associated Human Diseases. Int. J. Mol. Sci 2019, 20(6), 1329. 10.3390/ijms20061329. [DOI] [PMC free article] [PubMed] [Google Scholar]
- (28).Brindisi M; Senger J; Cavella C; Grillo A; Chemi G; Gemma S; Cucinella DM; Lamponi S; Sarno F; Iside C; Nebbioso A; Novellino E; Shaik TB; Romier C; Herp D; Jung M; Butini S; Campiani G; Altucci L; Brogi S Novel Spiroindoline HDAC Inhibitors: Synthesis, Molecular Modelling and Biological Studies. Eur. J. Med. Chem 2018, 157, 127–138. 10.1016/j.ejmech.2018.07.069. [DOI] [PubMed] [Google Scholar]
- (29).Brindisi M; Cavella C; Brogi S; Nebbioso A; Senger J; Maramai S; Ciotta A; Iside C; Butini S; Lamponi S; Novellino E; Altucci L; Jung M; Campiani G; Gemma S Phenylpyrrole-Based HDAC Inhibitors: Synthesis, Molecular Modeling and Biological Studies. Future Med. Chem 2016, 8(13), 1573–1587. 10.4155/fmc-2016-0068. [DOI] [PubMed] [Google Scholar]
- (30).Saccoccia F; Brindisi M; Gimmelli R; Relitti N; Guidi A; Saraswati AP; Cavella C; Brogi S; Chemi G; Butini S; Papoff G; Senger J; Herp D; Jung M; Campiani G; Gemma S; Ruberti G Screening and Phenotypical Characterization of Schistosoma Mansoni Histone Deacetylase 8 (SmHDAC8) Inhibitors as Multistage Antischistosomal Agents. ACS Infect. Dis 2020, 6(1), 100–113. 10.1021/acsinfecdis.9b00224. [DOI] [PubMed] [Google Scholar]
- (31).Saraswati AP; Relitti N; Brindisi M; Osko JD; Chemi G; Federico S; Grillo A; Brogi S; McCabe NH; Turkington RC; Ibrahim O; O’Sullivan J; Lamponi S; Ghanim M; Kelly VP; Zisterer D; Amet R; Hannon Barroeta P; Vanni F; Ulivieri C; Herp D; Sarno F; Di Costanzo A; Saccoccia F; Ruberti G; Jung M; Altucci L; Gemma S; Butini S; Christianson DW; Campiani G Spiroindoline-Capped Selective HDAC6 Inhibitors: Design, Synthesis, Structural Analysis, and Biological Evaluation. ACS Med. Chem. Lett 2020, 11(11), 2268–2276. 10.1021/acsmedchemlett.0c00395. [DOI] [PMC free article] [PubMed] [Google Scholar]
- (32).Relitti N; Saraswati AP; Chemi G; Brindisi M; Brogi S; Herp D; Schmidtkunz K; Saccoccia F; Ruberti G; Ulivieri C; Vanni F; Sarno F; Altucci L; Lamponi S; Jung M; Gemma S; Butini S; Campiani G Novel Quinolone-Based Potent and Selective HDAC6 Inhibitors: Synthesis, Molecular Modeling Studies and Biological Investigation. Eur. J. Med. Chem 2021, 212, 112998. 10.1016/j.ejmech.2020.112998. [DOI] [PubMed] [Google Scholar]
- (33).Hai Y; Christianson DW Histone Deacetylase 6 Structure and Molecular Basis of Catalysis and Inhibition. Nat. Chem. Biol 2016, 12(9), 741–747. 10.1038/nchembio.2134. [DOI] [PMC free article] [PubMed] [Google Scholar]
- (34).Chakrabarti A; Oehme I; Witt O; Oliveira G; Sippl W; Romier C; Pierce RJ; Jung M HDAC8: A Multifaceted Target for Therapeutic Interventions. Trends Pharmacol. Sci 2015, 36 (7), 481–492. 10.1016/j.tips.2015.04.013. [DOI] [PubMed] [Google Scholar]
- (35).Ho TCS; Chan AHY; Ganesan A Thirty Years of HDAC Inhibitors: 2020 Insight and Hindsight. J. Med. Chem 2020, 63(21), 12460–12484. 10.1021/acs.jmedchem.0c00830. [DOI] [PubMed] [Google Scholar]
- (36).Potts PR; Yu H The SMC5/6 Complex Maintains Telomere Length in ALT Cancer Cells through SUMOylation of Telomere-Binding Proteins. Nat. Struct. Mol. Biol 2007, 14(7), 581–590. 10.1038/nsmb1259. [DOI] [PubMed] [Google Scholar]
- (37).Prasse A; Binder H; Schupp JC; Kayser G; Bargagli E; Jaeger B; Hess M; Rittinghausen S; Vuga L; Lynn H; Violette S; Jung B; Quast K; Vanaudenaerde B; Xu Y; Hohlfeld JM; Krug N; Herazo-Maya JD; Rottoli P; Wuyts WA; Kaminski N BAL Cell Gene Expression Is Indicative of Outcome and Airway Basal Cell Involvement in Idiopathic Pulmonary Fibrosis. Am. J. Respir. Crit. Care Med 2019, 199(5), 622–630. 10.1164/rccm.201712-2551OC. [DOI] [PMC free article] [PubMed] [Google Scholar]
- (38).Prasse A; Carleo A; Jaeger B; Schupp J; Rottoli P; Wuyts W; Kaminski N BAL Cell Transcriptome Predicts Survival in IPF and Can Be Used to Gauge and Model Treatment Effects Interfering with the TGF-Beta Pathway. Eur. Respir. J 2018, 52, OA5359. 10.1183/13993003.congress-2018.OA5359. [DOI] [Google Scholar]
- (39).Jaeger B; Schupp JC; Plappert L; Terwolbeck O; Kayser G; Engelhard P; Adams TS; Zweigerdt R; Kempf H; Lienenklaus S; Garrels W; Nazarenko I; Jonigk D; Wygrecka M; Klatt D; Schambach A; Kaminski N; Prasse A Airway Basal Cells Show a Dedifferentiated KRT17high Phenotype and Promote Fibrosis in Idiopathic Pulmonary Fibrosis. bioRxiv 2020, 2020.09.04.283408. 10.1101/2020.09.04.283408. [DOI] [PMC free article] [PubMed] [Google Scholar]
- (40).Roach KM; Sutcliffe A; Matthews L; Elliott G; Newby C; Amrani Y; Bradding P A Model of Human Lung Fibrogenesis for the Assessment of Anti-Fibrotic Strategies in Idiopathic Pulmonary Fibrosis. Sci. Rep 2018, 8(1), 342. 10.1038/s41598-017-18555-9. [DOI] [PMC free article] [PubMed] [Google Scholar]
- (41).Gemma S; Camodeca C; Brindisi M; Brogi S; Kukreja G; Kunjir S; Gabellieri E; Lucantoni L; Habluetzel A; Taramelli D; Basilico N; Gualdani R; Tadini-Buoninsegni F; Bartolommei G; Moncelli MR; Martin RE; Summers RL; Lamponi S; Savini L; Fiorini I; Valoti M; Novellino E; Campiani G; Butini S Mimicking the Intramolecular Hydrogen Bond: Synthesis, Biological Evaluation, and Molecular Modeling of Benzoxazines and Quinazolines as Potential Antimalarial Agents. J. Med. Chem 2012, 55(23), 10387–10404. 10.1021/jm300831b. [DOI] [PubMed] [Google Scholar]
- (42).Grillo A; Chemi G; Brogi S; Brindisi M; Relitti N; Fezza F; Fazio D; Castelletti L; Perdona E; Wong A; Lamponi S; Pecorelli A; Benedusi M; Fantacci M; Valoti M; Valacchi G; Micheli F; Novellino E; Campiani G; Butini S; Maccarrone M; Gemma S Development of Novel Multipotent Compounds Modulating Endocannabinoid and Dopaminergic Systems. Eur. J. Med. Chem 2019, 183(2019), 111674. 10.1016/j.ejmech.2019.111674. [DOI] [PubMed] [Google Scholar]
- (43).Williamson B; Wilson C; Dagnell G; Riley RJ Harmonised High Throughput Microsomal Stability Assay. J. Pharmacol. Toxicol. Methods 2017, 84, 31–36. 10.1016/j.vascn.2016.10.006. [DOI] [PubMed] [Google Scholar]
- (44).Xu Q; Liu C; Zang J; Gao S; Chou CJ; Zhang Y Discovery of a Novel Hybrid of Vorinostat and Riluzole as a Potent Antitumor Agent. Front. Cell Dev. Biol 2020, 8, 1–8. 10.3389/fcell.2020.00454. [DOI] [PMC free article] [PubMed] [Google Scholar]
- (45).Skipper PL; Tannenbaum SR; Thilly WG; Furth EE; Bishop WW Mutagenicity of Hydroxamic Acids and the Probable Involvement of Carbamoylation. Cancer Res. 1980, 40(12), 4704–4708. [PubMed] [Google Scholar]
- (46).Shen S; Kozikowski AP Why Hydroxamates May Not Be the Best Histone Deacetylase Inhibitors—What Some May Have Forgotten or Would Rather Forget? ChemMedChem 2016, 11(1), 15–21. 10.1002/cmdc.201500486. [DOI] [PMC free article] [PubMed] [Google Scholar]
- (47).Caballero MV; Candiracci M Zebrafish as Toxicological Model for Screening and Recapitulate Human Diseases. J. Unexplored Med. Data 2018, 3(2), 4. 10.20517/2572-8180.2017.15. [DOI] [Google Scholar]
- (48).Fusi F; Durante M; Gorelli B; Perrone MG; Colabufo NA; Saponara S MC225, a Novel Probe for P-Glycoprotein PET Imaging at the Blood–Brain Barrier: In Vitro Cardiovascular Safety Evaluation. J. Cardiovasc. Pharmacol 2017, 70(6), 405–410. [DOI] [PubMed] [Google Scholar]
- (49).Brindisi M; Maramai S; Gemma S; Brogi S; Grillo A; Di Cesare Mannelli L; Gabellieri E; Lamponi S; Saponara S; Gorelli B; Tedesco D; Bonfiglio T; Landry C; Jung K-M; Armirotti A; Luongo L; Ligresti A; Piscitelli F; Bertucci C; Dehouck M-P; Campiani G; Maione S; Ghelardini C; Pittaluga A; Piomelli D; Di Marzo V; Butini S Development and Pharmacological Characterization of Selective Blockers of 2-Arachidonoyl Glycerol Degradation with Efficacy in Rodent Models of Multiple Sclerosis and Pain. J. Med. Chem 2016, 59(6), 2612–2632. 10.1021/acs.jmedchem.5b01812. [DOI] [PubMed] [Google Scholar]
- (50).Halgren TA MMFF VI. MMFF94s Option for Energy Minimization Studies. J. Comput. Chem 1999, 20(7), 720–729. . [DOI] [PubMed] [Google Scholar]
- (51).Irvine CA Spartan ‘02, Wavefunction. Inc; 2002. [Google Scholar]
- (52).Frisch MJ; Trucks GW; Schlegel HB; Scuseria GE; Robb MA; Cheeseman JR; Scalmani G; Barone V; Mennucci B; Petersson GA; Nakatsuji H; Caricato M; Li X; Hratchian HP; Izmaylov AF; Bloino J; Zheng G; Sonnenberg JL, D. J Gaussian09, Revision D.01, Gaussian, Inc.. Wallingford CT. 2010. [Google Scholar]
- (53).Grimme S Semiempirical GGA-Type Density Functional Constructed with a Long-Range Dispersion Correction. J. Comput. Chem 2006, 27(15), 1787–1799. 10.1002/jcc.20495. [DOI] [PubMed] [Google Scholar]
- (54).Weigend F; Ahlrichs R Balanced Basis Sets of Split Valence, Triple Zeta Valence and Quadruple Zeta Valence Quality for H to Rn: Design and Assessment of Accuracy. Phys. Chem. Chem. Phys 2005, 7(18), 3297–3305. 10.1039/B508541A. [DOI] [PubMed] [Google Scholar]
- (55).Weigend F Accurate Coulomb-Fitting Basis Sets for H to Rn. Phys. Chem. Chem. Phys 2006, 8(9), 1057–1065. 10.1039/B515623H. [DOI] [PubMed] [Google Scholar]
- (56).Tomasi J; Mennucci B; Cancès E The IEF Version of the PCM Solvation Method: An Overview of a New Method Addressed to Study Molecular Solutes at the QM Ab Initio Level. J. Mol. Struct. THEOCHEM 1999, 464(1), 211–226. 10.1016/S0166-1280(98)00553-3. [DOI] [Google Scholar]
- (57).Perdew JP; Burke K; Ernzerhof M Generalized Gradient Approximation Made Simple. Phys. Rev. Lett 1996, 77 (18), 3865–3868. 10.1103/PhysRevLett.77.3865. [DOI] [PubMed] [Google Scholar]
- (58).Adamo C; Barone V Toward Reliable Density Functional Methods without Adjustable Parameters: The PBE0 Model. J. Chem. Phys 1999, 110(13), 6158–6170. 10.1063/1.478522. [DOI] [Google Scholar]
- (59).Stephens PJ; Harada N ECD Cotton Effect Approximated by the Gaussian Curve and Other Methods. Chirality 2010, 22(2), 229–233. 10.1002/chir.20733. [DOI] [PubMed] [Google Scholar]
- (60).Osko JD; Christianson DW Methods for the Expression, Purification, and Crystallization of Histone Deacetylase 6-Inhibitor Complexes. In Methods Enzymol; 2019; Vol. 626, pp 447–474. [DOI] [PMC free article] [PubMed] [Google Scholar]
- (61).Winn MD; Ballard CC; Cowtan KD; Dodson EJ; Emsley P; Evans PR; Keegan RM; Krissinel EB; Leslie AGW; McCoy A Overview of the CCP4 Suite and Current Developments. Acta Crystallogr. Sect. D Biol. Crystallogr 2011, 67(4), 235–242. [DOI] [PMC free article] [PubMed] [Google Scholar]
- (62).Battye TGG; Kontogiannis L; Johnson O; Powell HR; Leslie AGW IMOSFLM: A New Graphical Interface for Diffraction-Image Processing with MOSFLM. Acta Crystallogr. Sect. D Biol. Crystallogr 2011, 67(4), 271–281. [DOI] [PMC free article] [PubMed] [Google Scholar]
- (63).Evans PR; Murshudov GN How Good Are My Data and What Is the Resolution? Acta Crystallogr. Sect. D Biol. Crystallogr 2013, 69(7), 1204–1214. [DOI] [PMC free article] [PubMed] [Google Scholar]
- (64).McCoy AJ; Grosse-Kunstleve RW; Adams PD; Winn MD; Storoni LC; Read RJ Phaser Crystallographic Software. J. Appl. Crystallogr 2007, 40(4), 658–674. [DOI] [PMC free article] [PubMed] [Google Scholar]
- (65).Emsley P; Lohkamp B; Scott WG; Cowtan K Features and Development of Coot. Acta Crystallogr. Sect. D Biol. Crystallogr 2010, 66(4), 486–501. [DOI] [PMC free article] [PubMed] [Google Scholar]
- (66).Adams PD; Afonine PV ; Bunkóczi G; Chen VB; Davis IW; Echols N; Headd JJ; Hung L-W; Kapral GJ; Grosse-Kunstleve RW PHENIX: A Comprehensive Python-Based System for Macromolecular Structure Solution. Acta Crystallogr. Sect. D Biol. Crystallogr 2010, 66(2), 213–221. [DOI] [PMC free article] [PubMed] [Google Scholar]
- (67).Chen VB; Arendall WB; Headd JJ; Keedy DA; Immormino RM; Kapral GJ; Murray LW; Richardson JS; Richardson DC MolProbity: All-Atom Structure Validation for Macromolecular Crystallography. Acta Crystallogr. Sect. D Biol. Crystallogr 2010, 66(1), 12–21. [DOI] [PMC free article] [PubMed] [Google Scholar]
- (68).Millard CJ; Watson PJ; Celardo I; Gordiyenko Y; Cowley SM; Robinson CV; Fairall L; Schwabe JWR Class I HDACs Share a Common Mechanism of Regulation by Inositol Phosphates. Mol. Cell 2013, 51(1), 57–67. 10.1016/j.molcel.2013.05.020. [DOI] [PMC free article] [PubMed] [Google Scholar]
- (69).Brogi S; Fiorillo A; Chemi G; Butini S; Lalle M; Ilari A; Gemma S; Campiani G Structural Characterization of Giardia Duodenalis Thioredoxin Reductase (GTrxR) and Computational Analysis of Its Interaction with NBDHEX. Eur. J. Med. Chem 2017, 135, 479–490. 10.1016/j.ejmech.2017.04.057. [DOI] [PubMed] [Google Scholar]
- (70).Paolino M; Brindisi M; Vallone A; Butini S; Campiani G; Nannicini C; Giuliani G; Anzini M; Lamponi S; Giorgi G; Sbardella D; Ferraris DM; Marini S; Coletta M; Palucci I; Minerva M; Delogu G; Pepponi I; Goletti D; Cappelli A; Gemma S; Brogi S Development of Potent Inhibitors of the Mycobacterium Tuberculosis Virulence Factor Zmp1 and Evaluation of Their Effect on Mycobacterial Survival inside Macrophages. ChemMedChem 2018, 13(5), 422–430. 10.1002/cmdc.201700759. [DOI] [PubMed] [Google Scholar]
- (71).Wu R; Lu Z; Cao Z; Zhang Y Zinc Chelation with Hydroxamate in Histone Deacetylases Modulated by Water Access to the Linker Binding Channel. J. Am. Chem. Soc 2011, 133(16), 6110–6113. 10.1021/ja111104p. [DOI] [PMC free article] [PubMed] [Google Scholar]
- (72).Zhou J; Wu R; Luo H-B Inhibition Mechanism of SAHA in HDAC: A Revisit. Phys. Chem. Chem. Phys 2015, 17(44), 29483–29488. 10.1039/C5CP05633K. [DOI] [PubMed] [Google Scholar]
- (73).Ganai SA; Farooq Z; Banday S; Altaf M In Silico Approaches for Investigating the Binding Propensity of Apigenin and Luteolin against Class I HDAC Isoforms. Future Med. Chem 2018, 10(16), 1925–1945. 10.4155/fmc-2018-0020. [DOI] [PubMed] [Google Scholar]
- (74).Pottel J; Therrien E; Gleason JL; Moitessier N Docking Ligands into Flexible and Solvated Macromolecules. 6. Development and Application to the Docking of HDACs and Other Zinc Metalloenzymes Inhibitors. J. Chem. Inf. Model 2014, 54(1), 254–265. 10.1021/ci400550m. [DOI] [PubMed] [Google Scholar]
- (75).Bieliauskas AV; Weerasinghe SVW; Negmeldin AT; Pflum MKH Structural Requirements of Histone Deacetylase Inhibitors: SAHA Analogs Modified on the Hydroxamic Acid. Arch. Pharm. (Weinheim) 2016, 349(5), 373–382. 10.1002/ardp.201500472. [DOI] [PMC free article] [PubMed] [Google Scholar]
- (76).Heltweg B; Dequiedt F; Verdin E; Jung M Nonisotopic Substrate for Assaying Both Human Zinc and NAD+-Dependent Histone Deacetylases. Anal. Biochem 2003, 319(1), 42–48. 10.1016/S0003-2697(03)00276-8. [DOI] [PubMed] [Google Scholar]
- (77).Wegener D; Wirsching F; Riester D; Schwienhorst A A Fluorogenic Histone Deacetylase Assay Well Suited for High-Throughput Activity Screening. Chem. Biol 2003, 10(1), 61–68. 10.1016/S1074-5521(02)00305-8. [DOI] [PubMed] [Google Scholar]
- (78).Heltweg B; Trapp J; Jung M In Vitro Assays for the Determination of Histone Deacetylase Activity. Methods 2005, 36(4), 332–337. 10.1016/j.ymeth.2005.03.003. [DOI] [PubMed] [Google Scholar]
- (79).Marek M; Shaik TB; Heimburg T; Chakrabarti A; Lancelot J; Ramos-Morales E; Da Veiga C; Kalinin D; Melesina J; Robaa D; Schmidtkunz K; Suzuki T; Holl R; Ennifar E; Pierce RJ; Jung M; Sippl W; Romier C Characterization of Histone Deacetylase 8 (HDAC8) Selective Inhibition Reveals Specific Active Site Structural and Functional Determinants. J. Med. Chem 2018, 61(22), 10000–10016. 10.1021/acs.jmedchem.8b01087. [DOI] [PubMed] [Google Scholar]
- (80).Copeland RA Reversible Inhibitors; Wiley Online Books; 2000. 10.1002/0471220639.ch8. [DOI] [Google Scholar]
- (81).Raghu G; Collard HR; Egan JJ; Martinez FJ; Behr J; Brown KK; Colby TV; Cordier J-F; Flaherty KR; Lasky JA; Lynch DA; Ryu JH; Swigris JJ; Wells AU; Ancochea J; Bouros D; Carvalho C; Costabel U; Ebina M; Hansell DM; Johkoh T; Kim DS; King TE; Kondoh Y; Myers J; Müller NL; Nicholson AG; Richeldi L; Selman M; Dudden RF; Griss BS; Protzko SL; Schünemann HJ An Official ATS/ERS/JRS/ALAT Statement: Idiopathic Pulmonary Fibrosis: Evidence-Based Guidelines for Diagnosis and Management. Am. J. Respir. Crit. Care Med 2011, 183(6), 788–824. 10.1164/rccm.2009-040GL. [DOI] [PMC free article] [PubMed] [Google Scholar]
- (82).Idiopathic Pulmonary Fibrosis: Diagnosis and Treatment. Am. J. Respir. Crit. Care Med 2000, 161(2), 646–664. 10.1164/ajrccm.161.2.ats3-00. [DOI] [PubMed] [Google Scholar]
- (83).American Thoracic Society/European Respiratory Society International Multidisciplinary Consensus Classification of the Idiopathic Interstitial Pneumonias. Am. J. Respir. Crit. Care Med 2002, 165(2), 277–304. 10.1164/ajrccm.165.2.ats01. [DOI] [PubMed] [Google Scholar]
- (84).Prasse A; Binder H; Schupp JC; Kayser G; Bargagli E; Jaeger B; Hess M; Rittinghausen S; Vuga L; Lynn H; Violette S; Jung B; Quast K; Vanaudenaerde B; Xu Y; Hohlfeld JM; Krug N; Herazo-Maya JD; Rottoli P; Wuyts WA; Kaminski N BAL Cell Gene Expression Is Indicative of Outcome and Airway Basal Cell Involvement in Idiopathic Pulmonary Fibrosis. Am. J. Respir. Crit. Care Med 2018, 199(5), 622–630. 10.1164/rccm.201712-2551OC. [DOI] [PMC free article] [PubMed] [Google Scholar]
- (85).Hackett NR; Butler MW; Shaykhiev R; Salit J; Omberg L; Rodriguez-Flores JL; Mezey JG; Strulovici-Barel Y; Wang G; Didon L; Crystal RG RNA-Seq Quantification of the Human Small Airway Epithelium Transcriptome. BMC Genomics 2012, 13(1), 82. 10.1186/1471-2164-13-82. [DOI] [PMC free article] [PubMed] [Google Scholar]
- (86).Prasse A; Pechkovsky DV; Toews GB; Jungraithmayr W; Kollert F; Goldmann T; Vollmer E; Müller-Quernheim J; Zissel G A Vicious Circle of Alveolar Macrophages and Fibroblasts Perpetuates Pulmonary Fibrosis via CCL18. Am. J. Respir. Crit. Care Med 2006, 173(7), 781–792. 10.1164/rccm.200509-1518OC. [DOI] [PubMed] [Google Scholar]
- (87).Roach KM; Duffy SM; Coward W; Feghali-Bostwick C; Wulff H; Bradding P The K+ Channel KCa3.1 as a Novel Target for Idiopathic Pulmonary Fibrosis. PLoS One 2014, 8(12), e85244. [DOI] [PMC free article] [PubMed] [Google Scholar]
- (88).D’Elia P; De Matteis F; Dragoni S; Shah A; Sgaragli G; Valoti M DP7, a Novel Dihydropyridine Multidrug Resistance Reverter, Shows Only Weak Inhibitory Activity on Human CYP3A Enzyme(S). Eur. J. Pharmacol 2009, 614(1), 7–13. 10.1016/j.ejphar.2009.04.019. [DOI] [PubMed] [Google Scholar]
- (89).Lamponi S; Aloisi AM; Bonechi C; Consumi M; Donati A; Leone G; Rossi C; Tamasi G; Ghiandai L; Ferrini E; Fiorenzani P; Ceccarelli I; Magnani A Evaluation of in Vitro Cell and Blood Compatibility and in Vivo Analgesic Activity of Plant-Derived Dietary Supplements. J. Integr. Med 2019, 17(3), 213–220. 10.1016/j.joim.2019.02.004. [DOI] [PubMed] [Google Scholar]
- (90).Sundaramurthi H; Roche SL; Grice GL; Moran A; Dillion ET; Campiani G; Nathan JA; Kennedy BN Selective Histone Deacetylase 6 Inhibitors Restore Cone Photoreceptor Vision or Outer Segment Morphology in Zebrafish and Mouse Models of Retinal Blindness. Front. Cell Dev. Biol 2020, 8, 689. [DOI] [PMC free article] [PubMed] [Google Scholar]
- (91).Pessina F; Gamberucci A; Chen J; Liu B; Vangheluwe P; Gorelli B; Lorenzini S; Spiga O; Trezza A; Sgaragli G; Saponara S Negative Chronotropism, Positive Inotropism and Lusitropism of 3,5-Di-t-Butyl-4-Hydroxyanisole (DTBHA) on Rat Heart Preparations Occur through Reduction of RyR2 Ca2+ Leak . Biochem. Pharmacol 2018, 155, 434–443. 10.1016/j.bcp.2018.07.026. [DOI] [PubMed] [Google Scholar]
- (92).Ferrara A; Fusi F; Gorelli B; Sgaragli G; Saponara S Effects of Freeze-Dried Red Wine on Cardiac Function and ECG of the Langendorff-Perfused Rat Heart. Can. J. Physiol. Pharmacol 2013, 92 (2), 171–174. 10.1139/cjpp-2013-0262. [DOI] [PubMed] [Google Scholar]
Associated Data
This section collects any data citations, data availability statements, or supplementary materials included in this article.
Supplementary Materials
Table S1. Relative MM energies (ΔEMM), electronic energies (EQM and ΔEQM), free energies (G and ΔG) and corresponding Boltzmann populations (χ) for the conformers of (S)-25b, as obtained after B97D/def2 TZVP/IEFPCM(2 PrOH) optimization.
Table S2. Oscillator strengths (fj), rotational strengths in dipole length formalism (Rj) and excitation wavelengths (λj) for the conformers of (S)-25b, as obtained by PBE0/def2-TZVP/IEFPCM (2-PrOH)//B97D/def2-TZVP/IEFPCM(2-PrOH) calculations.
Table S3. X-ray Crystallographic Data Collection and Refinement Statistics, zfHDAC6–6h complex. Docking Studies of compounds 6a-m (Figures S2–S15).
Figure S16. Isolation of human airway basal cells (ABCs).
Figure S17. Bronchosphere generation blocked by compounds 6a, 6d, 6h and 6l.
1H, 13C NMR spectra and HPLC purity of final compounds (±)-6a-m.


