Abstract
Climate change-induced disasters show the highest risk for agriculture and livelihoods in rural areas of developing countries. Due to changing rainfall pattern, the arid and semiarid region of Pakistan faces frequent droughts. Farming communities affected by drought disasters are causing serious threats to livelihood, global food crises, environmental migration, and sustainable development. The existing study was designed to quantify two key components through (1) analysis of agrometeorological data (1981–2017) with exploratory data analysis and Mann–Kendall trend analysis; (2) extensive field survey (200 households). The multivariate probit model has been run to detect determinants of coping and adaptive strategies by farmers. Our results showed that the farmers supposed that temperature and rainfall were highly fluctuating in recent years equally. Farmers adopted different coping and adaptive measures that include crop diversification, input adjustment, water management, asset depletion, income diversification, and migration to sustain their livelihood during stress periods. The agrometeorological data analysis revealed that the agricultural vulnerability to drought risks increased significantly, and the survey results projected that 64.7% of the population is exposed to drought directly or indirectly. Sen’s slope quantification resulted in (0.025 °C) rise in temperature, (− 2.936 mm) decline in rainfall year−1. Modeling future scenarios resulted in an increase in temperature up to 0.7 °C, 1.2 °C, and a decrease in precipitation up to 161.48 mm, 103.5 mm in 2040 and 2060. The study evaluated a huge gap in the provision of drought risk resilience services, crop insurance, and climate-smart training practices to build capacities among farmers to cope with the impacts of extreme weather conditions. Our research might provide the groundwork to upgrade actions to drought prevention and early warning in water scarcity areas.
Supplementary Information
The online version contains supplementary material available at 10.1007/s11069-021-04913-4.
Keywords: Climate risks, Drought characteristics, Extreme weather events, Food security, Farmer’s perceptions
Introduction
Climate is a naturally changing phenomenon, but what is more intriguing is the recent abrupt changes in climate that put the world temperature on the increasing trend. Climate change is the biggest issue increasing the intensity of extreme environmental conditions, which are worsening in the future (Kaushik and Sharma 2015; Lembi et al. 2020; Yokomatsu et al. 2020). Although the impact is observed across the globe at a different scale, global warming drastically exposed the vulnerability of individuals farming members to drastic changes in climate. The risk in production quality and quantity has been significantly increased (IPCC 2018a; Arshad et al. 2020). These have a major impact on the natural variation of temperature. Abrupt changes in climate pose major effects on precipitation, temperature, biodiversity, health, water resources, sea level, and agricultural production (Edenhofer et al. 2014; Murthy et al. 2015; Balogun et al. 2020).
The recent decade has witnessed drought, floods, cyclones, and hailstorms at the different intensities in the Asia–Pacific region. (UNDP 2018). Overall, South-Asian countries are considered developing, and their primary source of income is agriculture. So, adverse changes in environmental conditions pose severe threats to their social, ecological, and economic well-being (Ahmed Nomman and Schmitz 2011; Keshavarz et al. 2017). Climate warming and prolong-droughts cycles make the agricultural sector vulnerable both physically and economically. (Zahid and Rasul 2012; Bandara and Cai 2014) stated that climate change affects South-Asian countries’ very harder because the economy of these countries is mainly based on agriculture.
The agriculture sector in Pakistan provides food and livelihoods to 70–80% of the population and is directly linked with the environment and weather vulnerable farming communities. It is estimated that agricultural production may further decrease, ranging between 10 and 25%, especially in arid and semiarid regions (Udmale et al. 2014; Ahmad et al. 2016). The sector is already experienced during the worldwide lockdowns imposed due to the spreading COVID-19 pandemic in 2020. Mitigation of changes in climate relies on finance, technology, techniques, infrastructure, and institutional empowerment (IPCC 2014).
Balochistan province is one of the remote and utmost vulnerable regions concerning social, economic, and environmental impacts imposed by environmental changes (Arshad et al. 2020). About half of its land area is on the verge of severe risk by such conditions (Abid et al. 2016). Since 1980s, the deceleration of the agriculture sector (5.4–4.4% in the 1990s to 3.2% in year 2000s, 2.53% in the year 2014–15 causing extreme poverty − 0.2% in 2015–2016) reflects the severity of the situation (Khan et al. 2005, 2020; Naz et al. 2020). The active economic population in agriculture is 45% of the total workforce (male = 36.2%; female 75.4%). The average rainfall of 25.13 mm recorded from 1901 to 2015 reached high 170.67 mm, in August 1916, and lowest 0.15 mm, in December 2014 with an average temperature of 20.6 °C recorded from 1816 to 2015, maximum temperature (31.23 °C) in June 2011 and minimum temperature (5.95 °C) in January 1934 (PMD 2018). The drought faced at the end of the 1990s, and early 2000s in southern parts depict that severe challenges are posed by varying climatic conditions (Ashraf and Routray 2013). The country has also witnessed floods (2010) and severe drought (1998–2001) (Rasul et al. 2012).
Impacts of changing climate make the arid region of the province more vulnerable to frequently witnessed seasonal droughts (Jamro et al. 2020). An increase in surface temperature coupled with low average rainfalls is likely to cause seasonal shifts and disturb weather parameters (Ashraf and Routray 2015; Naz et al. 2020; Yokomatsu et al. 2020). On the other hand, a mean temperature rise by 1.15 °C and a 2.2 mm decrease in rainfall (1960–2007) (PMD 2018). This fertile land stands among the most drought-prone regions, which have been previously witnessed in 1968–1969, 1972, 1973–1974, 1993–94, 1997–2001, and 2008–2016 (Ashraf and Routray 2015; Ahmed et al. 2016; Khan et al. 2020).
The province is facing a limited amount of precipitation along with considerable changes in temperature (Naz et al. 2020). If these conditions prolong, it can make this land extremely prone to severe droughts shortly (Ashraf and Routray 2013; Jamro et al. 2020). Total annual precipitation is meager, owing to dry summer (Zahid and Rasul 2010). Prolonged and frequent drought conditions have adversely damaged the agriculture sector, while warm temperature resulted in higher rates of evaporation and evapotranspiration rate, which further aggravates moisture loss. The higher dependency of agronomic yield relatively increases vulnerability to frequent as well as intense rainfall besides temperature (Rasul et al. 2012).
Natural calamity impact assessment is critical, so field-oriented research and survey was need of the hour to understand up-to-date scenarios of drought risks. Furthermore, the colossal frequency of droughts and its impacts on water resources, agriculture, communities’ livelihoods are observed. This present study analyzes drought and temperature variability and their impacts over a long period of time on farmers’ livelihoods. Perception and experience knowledge of farmers regarding climate-induced disaster risks favor advanced policies. Measures to cope and adapt to this menace are taken by farmers to reduce the damages of abrupt environmental changes at district levels.
Objectives of the study are to (1) quantify the impact of climate-induced disasters on locals, particularly drought; (2) identify and evaluating farmer’s knowledge to resist against extreme weather conditions-based livelihoods; (3) examine farmers perception and capacity to adaptive and mitigate prolong droughts; (4) modeling scenarios of future climate warming and drought escape.
Material and methods
This study is to understand the increasing disaster risks posed by the climatic changes experienced in Zhob, Balochistan. It is situated under the climatically susceptible region of Pakistan. The paper has two major components: (1) the analysis of meteorological data; (2) an extensive field survey for 200 households of farmers.
Study area
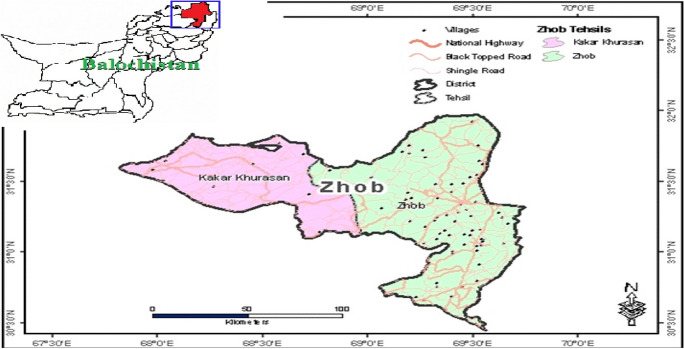
Zhob is a district of Balochistan (69°44′43″ E, 31°57′32″ N) that covers an area of 12,401 km2. The climate ranges from arid to semiarid. The landscape of the study site is as shown in Fig. 1. Daily mean temperatures range from 11.5 °C in the winter season to 36.5 °C in the summer season may rise to 49.5 °C (Ahmed et al. 2016). Precipitation is erratically scattered, limited, and ranged from 32 to 398 mm. Evapotranspiration in the area is about 2900–3000 mm year−1. The total agricultural area is 2.19 million hectares, and out of which only 47.2% (0.97 mh) is under irrigated.
Fig. 1.
Geographical positioning of the study site of Zhob, Balochistan, on the map with the location coordinates
The demographic records show that 85.11% population is living in rural areas. The majority factors of the rural population, less literacy, and high dependence on agriculture make the residents extremely vulnerable to natural disasters.
Climate and agroecological zoning
The area of the present study falls in arid and semiarid climatic conditions. Zhob district receives erratic monsoon rainfall in summer. This area is dry as well as hot in summer, while, on the other hand, it is extremely cold in the winter season. The average minimum and maximum temperatures in June are 23–37 °C, respectively. The average minimum and maximum temperatures in January are − 1 to 13 °C, correspondingly. East and southwest winds are usual, and winds coming from the southwest direction cause rain. From September to April, winds from the north damage crops and cause drought (Ahmed et al. 2016; PMD 2018).
Dust storms are common in both summer and winter seasons. The district is considered in the tropical agroecological zone and covers a potential agricultural area of 126,719 hectares (6.23% geographical area) (Pakistan Bureau of Statistics 2018). Most of the area is barren land and mountainous. There are minimal water resources available for agricultural operations. Crop planting and harvesting are done through traditional methods. There are two cropping seasons in Zhob district (1) Rabi (2) Kharif.
Data collection
Data were collected through both primary and secondary data sources. Qualitative and quantitative methods were used to gain sufficient information about the overall climatic changes, perception, and impact on agriculture.
Primary data
Data were collected by adopting a focused group discussion followed by an extensive questionnaire survey at multistage sampling. The total population of Zhob district was classified into several subgroups. The samples were selected based on an equal number of elements or their proportional allocation in the total population. According to the recent census, the district’s population is 375,142 (Pakistan Bureau of Statistics 2017), and the calculation estimates a sample size of 200 as suggested by Arkin and Colton (1963) to survey. The farm households were randomly selected. The formula is used as mentioned below:
where n = sample size N = total number of households, Z = confidence level (at 25% level Z = 1.96), P = (0.5) estimated population projection, and D = (0.07) error limit.
Secondary data
Meteorology data (1981–2018) were collected from PMD-Quetta (Pakistan Meteorology Department). Agricultural production data were obtained from the Agriculture Department, Quetta 1981–2015(PMD 2018).
Integrated climate modeling projections
The inverse distance weighted (IDW) interpolation method was used to interpret extreme indicators’ spatial distribution. The temporal evolution of each indicator also examined annual anomalies compared to the averages witnessed from 1961 to 1990 (Zahid and Rasul 2012; Ahmad et al. 2015). A censored least absolute deviation (CLAD) model was used to estimate the number of adaptation strategies adopted by farmers. The CLAD estimator is a generalization of the least absolute deviation (LAD) estimator. A probity model was used to study the factors influencing farmers’ adaptation practices toward climate change. A censored least absolute deviation (CLAD) was employed to analyze the determinants of adaptation practices, and a propensity score matching (PSM) approach was used to assess the impacts of adaptation practices on poverty levels and food security (Ali and Erenstein 2017). Month-wise and annual average temperature and precipitation data were processed to seasonal averages, and deviations are shown on the isotherms and isohyets map (Rasul et al. 2011).
Regression analysis was done to find the trends in temperature, rainfall, and crop productivity. The correlation was constructed between productivity and climatic parameters (temperature and rainfall) (Ahmad et al. 2015; Senyolo et al. 2018). The nonparametric Mann–Kendall (MK) method (Ahmad et al. 2015) was used to examine the nonlinear trend of each extreme climate indicator for each station, and a comparative analysis was performed at a 95% confidence level. (Hussain and Mahmud 2019) is coupled with the MK test to estimate the magnitude of seasonal drought trends. This method has been frequently applied for estimating the magnitude of a trend in hydrometeorological time series (Ahmed et al. 2016; Jamro et al. 2020; Naz et al. 2020; Yokomatsu et al. 2020).
Agrometeorological index
Dry periods were evaluated by using the rainfall index. Lang’s index was adopted to estimate the aridity variation in the annual average rainfall. The rainfall index was calculated by following the equation mentioned below: (UNDP 2018)
| 1 |
P is the monthly mean precipitation in millimeters, and T is the monthly mean temperature in °C. The aridity index, characterized by a dearth of water (Beniston et al. 2007), is defined as a permanent climatic condition and can be estimated by Lang’s index (Ahmed et al. 2016)
| 2 |
where AL = Lang’s index, PA = mean total annual precipitation, and TA = average temperature. The coefficient of variation (COV) was calculated as follows:
| 3 |
where SD = standard deviation and M = mean value of a meteorological parameter. The forecasting scenario is developed using the forecast package in R. Using the forecast function takes the time series of data as input. The forecasting scenario is developed until 2060.
Analysis and visualization
Data were analyzed by using the linear regression model, least square method, aridity index, Lang’s index method and descriptive method (SD), coefficient of variation, multiple regression model, comparative graphs, frequency, and percentage. In contrast, the second objective of the study was achieved through a multivariate probit model test (Geweke et al. 1997) in SPSS, along with descriptive statistics. Mann–Kendall and seasonal Mann–Kendal tests on temperature and rainfall are performed in R (0.9.6) using the Kendall package R (≥ 3.1). The data are structured in the time-series format and given as input in the Mann–Kendall function of the package. The output of this gives Kendall’s tau statistics and a two-sided p value. Then, Sen slope is calculated to see the trend in the climate data by ROpenSci package rWBclimate. The R script for the process is given in the annexure. ArcGIS (10.4.1) packages were applied to develop the future drought projections and representation of the model’s information.
Results and discussion
The research started within the primary field survey of the 200 households to reveal their background and knowledge about climate change. Balochistan has a history of droughts, but the recent droughts from 1995 to 2018 were the most prolonged dry spells in recent ages. This deficit results in a water shortage for livelihood activities to locals or the environmental sector. The areas of Kalat, Chaghi, Naukundi, and Zhob were severely affected by drought many times. Majority of the population in these areas lives under poverty line and less food in-take causing different diseases and malnutrition to affected populations. A long-term change in the zone of temperature shifting and rainfall patterns would increase the concentration and intensity of droughts, which is disturbing production directly.
Socioeconomic profiling
Experience and age classification
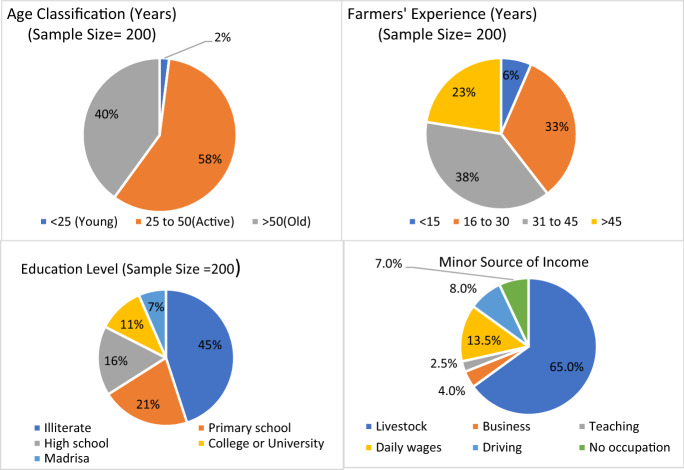
The respondent’s age was classified into three categories. The result indicates that only two percent of farmers were under 25 years of age, while most (58 percent) of farmers were between 25 and 50 years of age. Two-fifths of respondents were over 50 years of age and are considered aged farmers (see Fig. 2). The second part of the figure illustrated farmers’ experiences in farming years. The majority of the farmers (38 percent) had very long experience ranging from 31 to 45 years. Very few of the respondents (only 6.5%) were indeed new to farming and had less than 15 years of farming experience. This showed the high dominance of traditional farmers with long experience in the field.
Fig. 2.
Profiling information of respondents, age classification, years of experience, literacy, and
source of income
Educational status
Farmers’ literacy level plays an important role in coping with and adapting to climate change. As the results showed (Fig. 2), 55% of farmers have some literacy level. However, only 27% had more schooling than primary education. Research findings observed that education could reduce drought exposure and risk not only for farm activities but also their ability to take on new professions.
Landholding and income composition
The status of farmers holding land is divided into three categories (Table 1). Owner of fewer than 25 acres, the farmers were only three-fifths. These are the farmers who had small landholdings. Two-fifths of the farmers had medium-sized landholdings of between 25 and 50 acres, while a tiny number of farmers (2.5%) had large landholdings of over 50 acres in the study area. Almost one-fifth of the total annual income of the farmer was below 5 Lac Rupees. At least three-fifths of the farmers’ total annual income was between 16 and 25 Lac Rupees. Farmers (one-fifth) total annual income ranged from 26 to 35 Lac Rupees, while the total annual income of farmers above 35 Lac Rupees was only 1% due to large landholdings, water availability, and continuous hard work.
Table 1.
Statistics of respondent’s landholding capacity and the status of total annual income in the drought susceptible areas of Zhob, Balochistan
| Variables | Frequency |
|---|---|
| Land hold size (Acres) | |
| < 25 (Small farmers) | 140 |
| 25–50 (Medium size land) | 55 |
| > 50 (Large farmers) | 5 |
| Total | 200 |
| Average land hold size | 21.97 |
| Total annual income (Rupees) | |
| Below 500,000 | 36 |
| 600,000–1,500,000 | 115 |
| 1,600,000–2,500,000 | 31 |
| 2,600,000–3,500,000 | 15 |
| 3,500,000 Above | 3 |
| Total | 200 |
| Average of total income | 1,331,550 |
0.40 Hectare = 1 Acre and 1 USD = 156.85 PKR
Secondary source of livelihood earning
The occupation of farmers in the study area involved making money from other alternative sources besides farming practices (Fig. 2). The majority (three-fifths) of the farmers used livestock as a source of income because they were cheap and profitable to generate income. Only 4% of farmers were engaged in income-generating business activities. Three percent of farmers did government work in schools (Fig. 2), and two-fifths of farmers did daily wages. One-fifth of the respondents were trying to export agricultural products or serve local people in the village to earn money. Farmers (8%) did not engage in any occupation due to limited time or were unable to engage in any other activity with farming practices for earning money.
Quantification of climate variability risks
Mean temperature variability
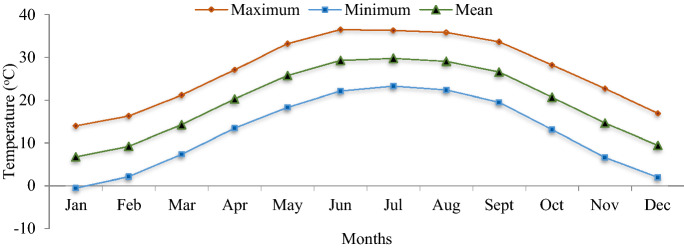
The mean annual temperature has been calculated using the mean monthly average temperature during the study period and presented in Fig. 3. Figure also shows the mean monthly minimum and maximum temperature of the data for the entire period. A higher mean temperature has been observed from May to September during the mentioned time period in the study area. The mean monthly minimum and maximum temperatures are − 0.54 °C and 36.44 °C for January and July, respectively, during the study period.
Fig. 3.
Mean monthly variation of temperature (°C), mean minimum, and mean maximum temperature during 1981–2015
Enormous variations have been observed in the district of Zhob between the mean monthly minimum and monthly maximum temperature. The highest range value of 16.08 °C in November and the lowest value of 12.99 °C in July were all recorded in the record data. In brief, higher variations were observed in the summer months and lower variations in the winter months. The mean annual temperature is analyzed (Fig. 3) where the trend shows that there had been an average increase of 0.03 degrees (C) per year in area temperature from 1981 to 2015. The climate modeling analysis also reported that Balochistan’s warming trend was observed at mean temperatures with a total change of 1.15 °C over the period 1960–2007. Lower average annual temperatures were detected in 1989 at an average temperature of 17.2 °C, while the warmest temperature was recorded in 2003 at an average temperature of 23.1 °C. The overall temperature increase for the entire study period was approximately 1.50 °C in the study area.
Variability in annual mean temperature
The annual mean minimum and maximum temperature are presented in Fig. 3. The trends showed an increase of 0.016 °C and 0.038 °C per year in the annual mean minimum and maximum temperatures throughout the study. Modeling projections of climatic data described that the increase in annual maximum temperature is higher in Balochistan at 1.10 °C as compared to other provinces in the country.
Rainfall variability
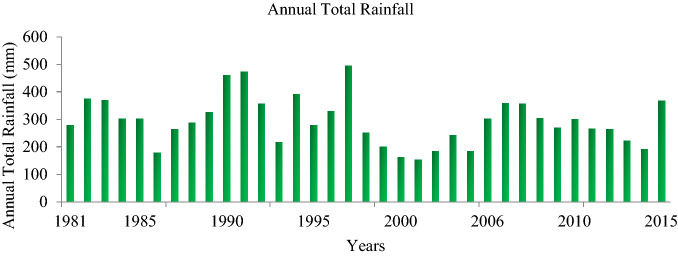
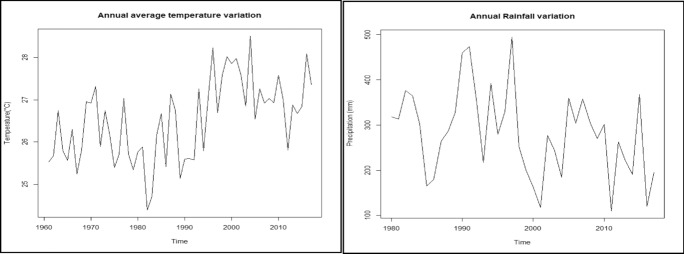
Total annual rainfall is the sum of monthly rainfall, while the maximum rainfall is the highest rainfall value of the specific year—the annual amount of rainfall (mm) and the annual maximum amount of rainfall presented in Fig. 4. After every two years, high variability in rainfall has been observed in the study area. The district received 260 mm of rainfall average with a coefficient of variation (CV) of 35% between 1981 and 2017. The district received a maximum annual rainfall of 495 mm in 1997 and a minimum of 153 mm in 2001. The district recorded cumulative annual rainfall of more than 400 mm during the years 1990, 1991, and 1997 on three occasions. The lowest annual maximum rainfall of 33 mm was observed in 2014, and the highest maximum rainfall of 165.1 mm was observed in August 1990.
Fig. 4.
The modeling of climatic variation in annual total rainfall (mm) amount during the years of 1981–2015
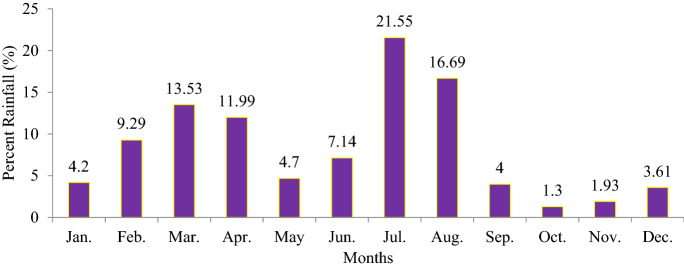
The seasonal rainfall pattern in percentage is shown in Fig. 5. The seasonality of rainfall is such that the district received less than 2% of rainfall during October and November in the study period (1981 to 2015), whereas the maximum rainfall recorded in July and August was 21.55% and 16.69%, respectively. The standard deviation on the average annual basis is shown in Fig. 3c. Results demonstrate the relationship between annual average rainfall and annual rainfall variability. Here, when measuring annual average rainfall, the length of the season must be taken into account. The 10-year data cannot be used to indicate average rainfall, the duration of which must be 30–35 years. A climate data analysis mark shows that there has been a strong variability in rainfall during the district’s study period (R2 = 0.69).
Fig. 5.
Overview of onset of the seasonal monthly amount of rainfall (%) in different months during the year 1981–2015
Trend analysis of the temperature and precipitation in the Zhob district
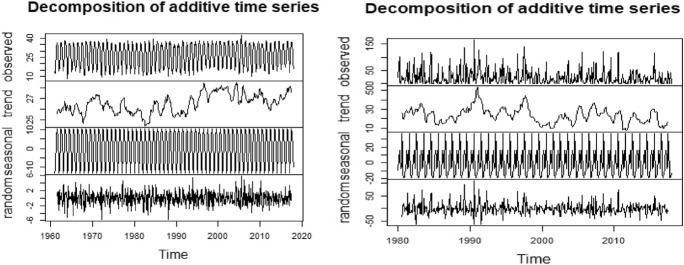
The available climatic data analysis showed that four categories of drought, (1) meteorological; (2) agricultural; (3) hydrological; (4) socioeconomic, occur in Balochistan with changed concentrations. Sources are used to understand the trend in the temperature from 1960 to 2017 and precipitation from 1981 to 2017. The results shown in Figs. 6 and 7 indicate the changes in the temperature and precipitation over the years. The Mann–Kendall tests and seasonal Mann–Kendall tests are used to detect the significance of the trend, and a Sen’s slope estimates help with understanding the direction (positive or negative) and quantum of trend (changes experienced every year).
Fig. 6.
Trend analysis of annual average monthly precipitation (mm), monthly maximum temperature (degree C), and annual cumulative rainfall (ACR) from 1960 to 2019
Fig. 7.
Additive time-series quantification of annual average monthly and maximum temperature anomalies (degree C) and annual cumulative precipitation rate (mm) between 1960 and 2019
Table 2 compiles the test results and important parameters. As the table shows, the seasonal Mann–Kendall test for monthly maximum temperature recorded in Zhob district has seen a significant increasing trend, suggesting that the temperature has been increasing across the seasons (Fig. 3). Similarly, at a macroscale, for annual average maximum temperature shows a significant increasing trend. The maximum temperature provides strong statistical support to the hypothesis that increasing the overall temperature of the Zhob district has been increasing since 1960. The estimated trend shows that the temperature increases at 0.025 degrees (C) a year (Sen’s Slope).
Table 2.
Quantification analysis of Mann–Kendall Test (MKT) for annual and monthly temperature (C) and rainfall (mm) time series
| Parameter | Test | Mann–Kendall | Sen’s Slope | ||
|---|---|---|---|---|---|
| Tau | p value | Remarks | |||
| Monthly maximum temperature | Seasonal Mann–Kendall test | 0.171 | < < 0.05 | ** | 0.025 |
| Annual average maximum temperature | Mann–Kendall test | 0.336 | < < 0.05 | ** | 0.028 |
| Monthly precipitation | Seasonal Mann–Kendall test | − 0.055 | 0.096 | * | − 0.001 |
| Annual precipitation total | Mann–Kendall test | − 0.235 | < < 0.05 | ** | − 2.936 |
*, **, ***Represent statistically significant at 99%, 95%, and 90%, respectively
Similarly, the precipitation analysis of monthly and annual cumulative precipitation suggests that precipitation has decreased since 1981. However, monthly precipitation is not significant at 95% confidence interval but is significant at 90% confidence interval. The annual precipitation shows a much stricter trend, suggesting that the total quantum of annual precipitation has been experiencing the reduction. High Sen’s slope value (− 2.936 mm/Year) on annual precipitation vouches for the rapid reduction in total quantum. Figure 7 shows random seasonal trends observed with visualizing the seasonality in the time-series data of the temperature and precipitation.
Farmer’s perception of climate change
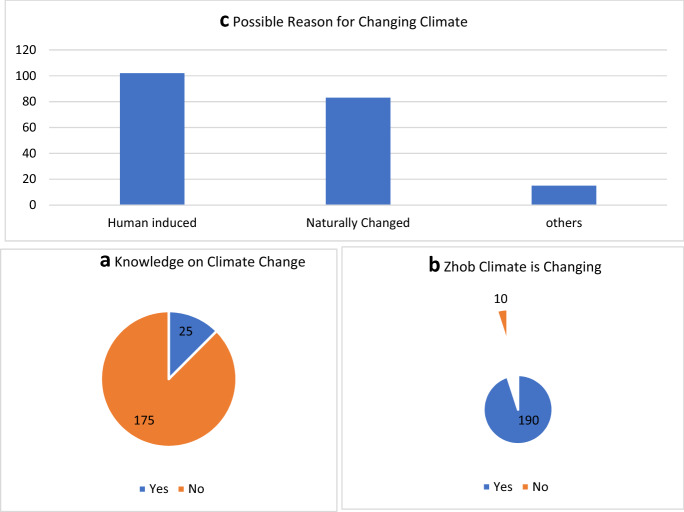
The field survey results indicated that only one-fifth of the respondents had knowledge of climate change and were graduates or high-level academics, while four-fifths of the respondents had no knowledge of climate change (Fig. 8). In response to climate change, the majority (95%) of farmers agreed that Zhob’s climate is changing rapidly. The understanding of factors linked to climate change is discussed. Two half-fifths of the farmers believed that climate change was a punishment of God because of our bad behavior and no worship. Farmers (two-fifths) responded that climate change occurred naturally with time, and only one-fifth of farmers felt that these changes were due to human activities such as deforestation, increased CO2, over-grazing, no land use planning, an increase in the number of pipe wells, the extraction of more underground water by solar panels, etcetera. In addition, about 90% of the farmers’ using their indigenous knowledge pointed out that when permanent or local birds and animals move to other areas, it give us a sign of climate warning, though rest of the farmers did not agree.
Fig. 8.
Perception of farmers about their a knowledge on climate change; b If the farmer has an experienced that the Zhob’s climate is changing; c Causality for the changing climate
Besides, 93% of farmers perceive the loss of plant species as a sign of climate change instability, while 56% of farmers know that spring water has disappeared. Only 15.5% expect otherwise, such as increasing and dropping seasonal temperatures and rainfall, dry snow, increased disease, etcetera. Approximately 93% of the farmers in the study area have seen rainfall variability over the last 20 years (Fig. 9). Besides, farmers have reported that regular variations in weather conditions and seasonal rainfall make it difficult to forecast future climate conditions, whereas 60% of farmers experienced a drop in rainfall in the study area.
Fig. 9.
Farmer’s perception of rainfall and temperature change on the basis of their life experience in the study area
Our results reported that 34% of farmers were unable to predict rainfall variability, and a tiny number of farmers responded to rainfall (Fig. 9). Almost (93%) of farmers agreed that temperatures in the study area have also increased over the last 20 years. Farmers point out that significant changes occur every 35 years as the planet completes its process and returns to its old position. The majority of farmers were observed to respond to an increase in temperature by 48.5%. Just 7% of farmers accepted that thermal waves in the atmosphere would increase the surface temperature. In addition, most of them, 32.5% responded to temperature is erratic and out of their prediction. During the primary rainy season, less rainfall is considered to be insufficient for cropping.
Perception about seasonal changes
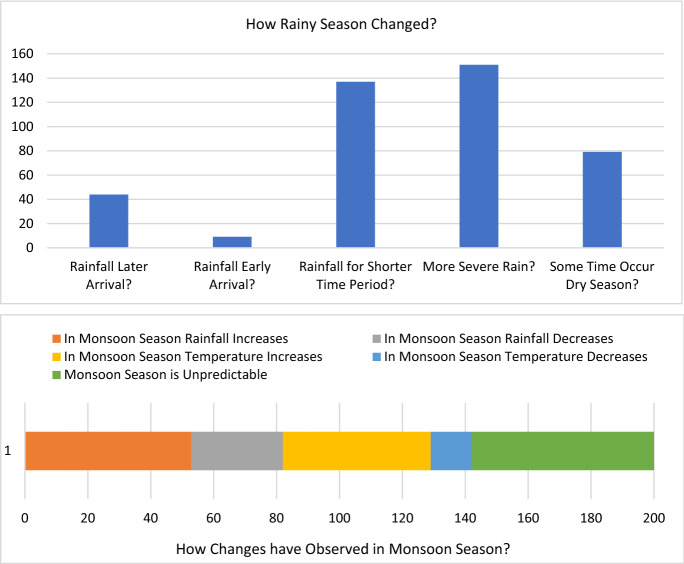
In addition, season analysis (Fig. 10) shows that 81% of the respondents realized changes in the rainy seasons had been observed, and another 78% said that the rainy season had come late with a decrease in rainfall and 95.5% of the farmers had experienced early rainfall. Farmers’ perception of rainfall variation is also consistent with secondary data. The change in precipitation patterns is defined by a decrease in precipitation quantity and frequency. Only 68% of the respondents observed precipitation in seasons over a short period, and 75% of farmers responded by observing a more severe precipitation rash. Very few (39.5%) agreed that there was some dry season in the area.
Fig. 10.
Farmer's observation about seasonal changes of rainfall pattern and shift in the Monsoon rainfall cycle in the region
The shift in monsoon season
The survey findings show the changes observed by farmers during the monsoon season in Fig. 10. Seasonal shifts were found by 96.5% of the respondent. Also, 26.5% of the respondent responded to monsoon rainfall showed significant shift, while 23.5% of the respondents observed an increase in the temperature during the season. The drop in rainfall and the increase in temperature are also unpredictable, whereas 29% of the farmers indicated that seasonal monsoon changes were unpredictable.
Impacts quantification of drought on agricultural production
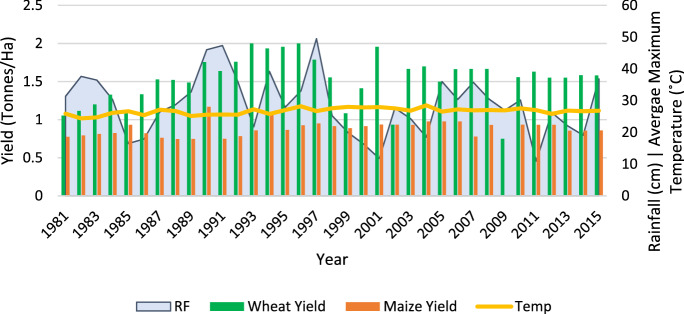
Annual drought risk variability results (Fig. 11) showed inter-annual mean crop production (wheat, maize) and change in climate variables (rainfall, minimum temperature, and maximum temperature) for the period 1981–2015. The production of crops (wheat and maize) depends mostly on the initial rainfall during the winter season after sowing and has also played an essential role in increasing production levels. Estimated mean rainfall and temperature variables indicate that the variation varies significantly from year to year. The graph shows that the highest mean annual rainfall was recorded in the years 1990, 1991, and 1997 relative to the earlier and later years, while the highest mean maximum temperature of 28 degrees (C) was recorded in the year 2000, suggesting that the study region experienced higher rainfall variability, minimum and maximum temperature patterns over the entire period.
Fig. 11.
Annual variability in wheat and maize crops production, mean rainfall, mean minimum, and maximum temperature (1981–2018)
The climatic factors do not reliably predict (F = 1.615, p value = 0.196) the variation in the wheat production (Table 3). While in the maize case, the independent variables reliably predict the variation in the dependent variables (F = 15.863, p = 0.000). Further, it has been observed that 17.7% and 67.9% of the production of wheat and maize have been explained by climatic factors such as rainfall, minimum temperature, and maximum temperature. The VIF values also show that there is no multi-collinearity between the dependent and independent variables.
Table 3.
Coefficient analysis of minimum and maximum temperature, rainfall to calculate the decrease in wheat and maize crop production
| Variables | Coefficient bs | t | p value | VIF |
|---|---|---|---|---|
| Constant | 81,353.473 | 7.442*** | .000 | |
| Minimum temperature | 7.614 | .197 | .845 | 1.070 |
| Maximum temperature | − 39.016 | − .800 | .430 | 1.254 |
| Rainfall | − 14.773 | − 1.398 | .172 | 1.356 |
| Year | − 39.708 | − 7.202*** | .000 | 1.317 |
The climatic factors do not reliably predict the variation in wheat production. Therefore, further results cannot be reported
R2 = .679, F = 15.863***, p value = .000 (Maize), R2 = .177, F = 1.615, p value = .196 (Wheat)]
***,**,*Statistically significant at 99%, 95%, and 90% confidence interval, respectively
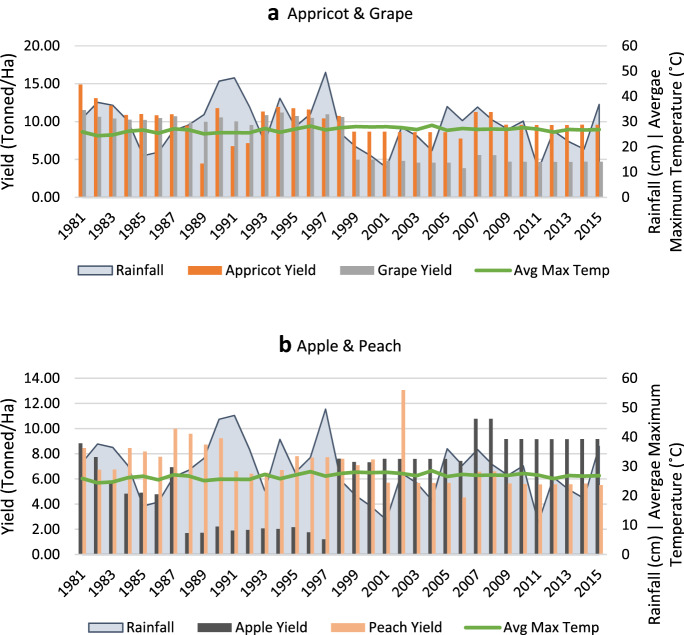
Horticultural yield also declined due to prolong disaster and (Fig. 12) shows that only two fruit varieties (apple, apricot, grapes, and peach) showed high production during the study period. The increase in apple and apricot production trends after 1999 onward shows that there was a positive relationship between apple and apricot production and rainfall. Besides, farmers shifted toward fruit production in the study area. The variability in climate variables had not much affected the production of apple and apricot, which indicates that these two varieties are more resilient to a stressful situation. Furthermore, the increase in apple and apricot production is resulted due from an increase in the cultivated area. On the other hand, grapes and peach production declined dramatically after the year 1998, and their production was significantly affected due to drought.
Fig. 12.
Annual variability in fruit production (apple, peach, grapes and apricot, rainfall, minimum and maximum temperature (1981–2018)
Climatic factors (rainfall & temperature) reliably predict the variation in the production of all fruits. Further, 80.2% and 56.8% of the variation in production of apple and grapes (Table S1) are observed, while 74.2% and 35.9% of the variation in the production of apricot and peach have been explained by the climatic factors such as rainfall, minimum temperature, and maximum temperature, respectively.
Furthermore, vegetable production is also under a decrease due to climate-induced disasters. Climatic factors (rainfall, minimum temperature, maximum temperature) reliably predict the variation in the production of all vegetable varieties. Hence, onion production had a strong relationship with the independent variables. Further, it has been observed that 42.9% and 41.7% variation in potato and tomato (Fig. S2). In comparison, 28.8% of the variation in the production of onion has been explained by climatic factors such as rainfall, minimum temperature, and maximum temperature, respectively.
Future scenarios of temperature and rainfall
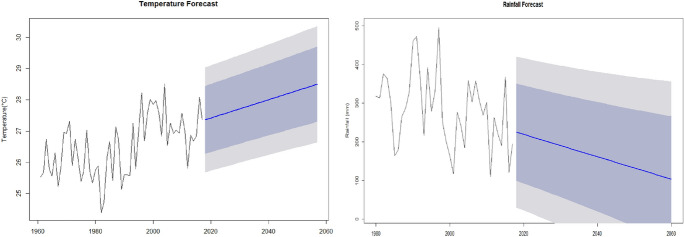
Through trends from past year data observation, forecasts are developed until 2060. The trend on annual average temperature from 1980 to 2017 was found out to be 0.029 °C/year. Therefore, after extrapolating this until 2040 and 2060 (Fig. 13). It was found out that the average temperature in Zhob in 2040 can reach up to 28 °C and by 2060 up to 28.5 °C. This is 0.7 °C (2040) and 1.2 °C (2060) more than the temperature observed in 2017.
Fig. 13.
Modeling future scenarios of the rise in climate warming year−1 and decrease in the rate of rainfall year−1 by using data from 1960to 2060
The average annual rainfall in Zhob has been decreasing significantly from 1980 to 2017. The analysis found out that rainfall decreases at the rate of − 2.896 mm/year, after extrapolating this value up to 2040 and 2060. By 2040, average rainfall in Zhob can go down up to 161.48 mm in 2040 and just about 103.5 mm in 2060. These values are 66.2 mm (2040) and 125 mm (2060) less than the rainfall observed in 2017.
Farmers perception of climate-induced disaster risks
Additional climatic factors, such as heavy wind, escalating temperature, minimum relative humidity, maximum evaporation, desertification, and deforestation, can influence the seasonal drought disaster. Though drought has affected the entire country, the province of Balochistan was the worst hit. It caused massive loss to human life, agriculture, and livestock. Due to increasing temperatures over the year, there is a compounding effect on the water and agriculture sector. Due to an increase in the variability of rainfall, which means more variability in monsoon can increase the probability of extreme events like floods and drought. Literature has shown that Pakistan is one of the most vulnerable counties due to climate change, especially in the Balochistan region due to the longest coastline of the Makran region. Therefore, it is essential to sensitize the community in the region about the impacts of climate change. Globally combined surface and ocean temperature data have shown a warming trend of 0.85 °C over 1880–2012 (IPCC 2018b). Analysis of the temperature from 1980–2017 of Zhob district in the Balochistan region showed that temperature increases at the rate of 0.029 °C/year. The future scenario between 2040 and 2060 indicated that the temperature would increase from 0.7 to 1.2 °C compared to 2017. Analysis of rainfall showed that rainfall decreases at the rate of -2.896 mm/year. By 2040, average rainfall in Zhob could decline up to 161.48 mm in 2040 and just about 103.5 mm in 2060.
Agriculture productivity would be directly impacted because of climate change. Therefore, the perception of farmers is important to understand better the risk associated with climate change, and their behavioral responses will govern the best adaptation strategies. Intercropping might also be helpful as a sustainable practice that can improve resource-use efficiency, such as nutrients and water, allowing low input agricultural practices. Furthermore, introduction to the new agricultural-related sectors like livestock would be a better and sideway initiative to cope extreme weather events and enhance the importance of fodder forage crops cultivation with efficient utilization of natural and available resources in the area.
A small portion of the farmers’ (2%) have mentioned an increase in agriculture production, whereas the majority (89%) of the farmers had experienced a decrease in agriculture production. Farmers (7.5%) had observed little changes in the agriculture production, and very few of the farmers (1.5%) had been observed no changes in the agriculture production over the past 20 years in district Zhob.
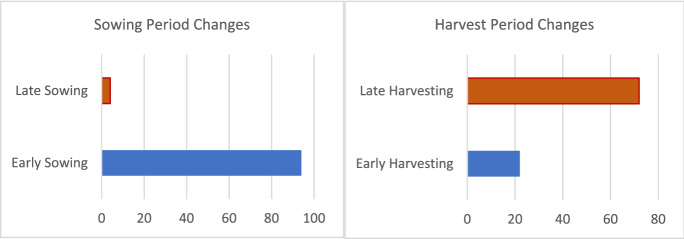
In the study area, farmers have not seen much change in the timing of agriculture practices in farms, like the sowing period, as shown in Fig. 14. About 47% of the surveyed farmers mentioned that they are doing early sowing of crop activities due to the monsoon’s early start. About 2% of the farmers are sowing late. The reason indicated by the farmers for this practice is that early sowing with season could give better production. Further, they mentioned that if the food does not mature or ripe in the growing season, production decreases. A slight cooling and one-degree increase in temperature have been observed in Balochistan and other provinces over the last seventeen years reduced food crop yields by 45 kg hectare−1 reported by Ahmed Nomman and Schmitz (2011).
Fig. 14.
Prolong drought influencing early-late sowing and harvesting practices by the farming communities of the study site
Changes made in the agriculture harvesting activities by farmers (Fig. 14) to cope with the climate-induced impacts are still under discussion. About 79.5% of the farmers mentioned that they did not harvest the crops early since crops take their own time to ripe. About 1/10 of the farmers were harvesting agriculture crops early, mainly due to high prices available in the local and main market. More than 36% of the respondents were harvesting late as they can store the food in the cold storage and wait for the best prices in the market, whereas the majority or 64% of farmers did not harvested their crops. They mention that when a crop ripe, they make it ready for the market. As the food gets spoiled and gets breakdown to the ground, insects and birds also start eating the food.
Climate and agriculture production data were analyzed to discover climate change and its impacts on agriculture production. It was found that there is a moderate variability in the mean temperature with unstable changes in the annual rainfall. These parameters have affected the agriculture farms as there decreases production over time. In the last 20 years, farmers had also observed a change in rainfall patterns and temperature shifts. The perception of farmers on these climatic factors is highly fluctuating from decades with less rainfall in shorter duration and warmer temperature over the years are now became unpredictable. Farmers have experienced changes in rainfall patterns with a short period, dry spells in rainy seasons, early arrival, and the decrease in average rainfall, thus making them hard to predict the rainfall. Farmers perceived that temperature is rising, whereas rainfall decreases. Further, they identify that timing of rainfall is changing, particularly in summer.
On-farm coping and adaptation measures
Crop diversification
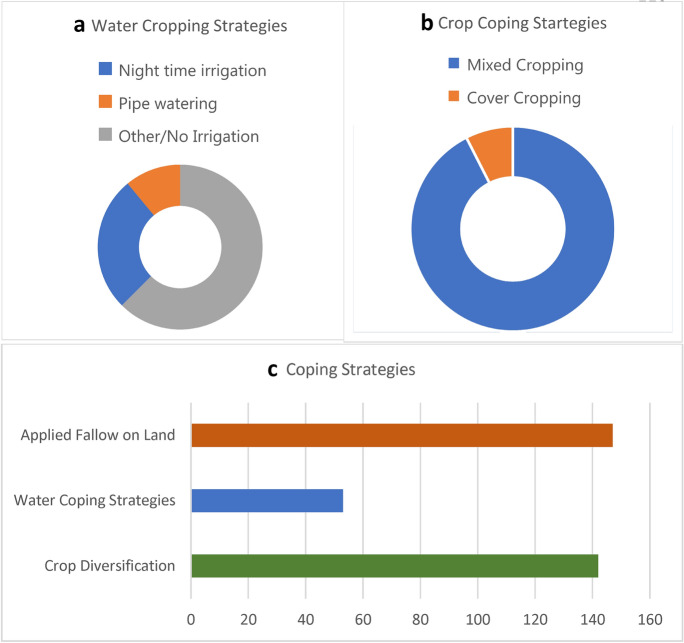
About 80% or 4/5 of the farmers in the study area had shifted or diversified to other crop varieties due to shortage of cash, less agriculture production, the irresistibility of plants in the environment, not having a profitable price to the crop in the market. Further, due to climate change, farmers were shifted to grow more than one crop in the field (Fig. 15). Most (86%) of the farmers were engaged in practices like mixed cropping, while only 14% were doing cover cropping utilizing tree bushes, grass, sowing trees around the field, etcetera., to protect plants/trees from the erosion, heavy winds, and warmer temperature. According to the farmers, mixed crops are sustainable in the environment and give enough production. Even if one crop fails due to water shortage, then it will not impact the other crops.
Fig. 15.
Calibration of farmer’s drought k escapes coping strategies toward water management and production systems
Farmers were adopted to various vegetable varieties as these food varieties ripe in less time and are profitable. This further provides an opportunity for farmers to grow another variety related to the season. Farmers also focused on wheat and maize crop varieties, which can sustain high temperatures and can yield high production. Farmers are also focused on fruit trees, especially apple and apricot, but not others because of low market prices and high expenditure.
Water management
Along with crop diversification, water management is another adaptation strategy practice by the farmers in the agriculture field. Cisse et al. (2019) mentioned that there are many negative impacts associated with climate changes that could harshly influence agriculture productivity. Some of the impacts include, for example, there is a reduction in the quantity of freshwater available for irrigation, geographical shifts; due to sea-level rise, there will be less land available, impacts on productivity due to salinization. Farmers (42.5%) in the study area had adopted water management practices in the field, and the remaining (59.5%) of the respondents had taken no such measures to manage water and using mud water channels because of the inability to pay the expenses. Additionally, there are a few precipitation projections during the monsoon, which may increase by up to 20–30%. Rain spells also contain much of the extra rainwater dropping in high concentration with hailstorms and extreme weather events (EWEs). EWEs such as prolonged dry, hot spells may lead to permanent drought, and erratic rainfalls will convert more recurrent.
Farmers in the area mention that they practice daytime watering practice majorly, which leads to wastage of water. About 26.5% of farmers do night shift watering. About 9% of the farmers adopt pipe watering techniques, while 11% practice water management in different ways, like giving more water to plants/trees with rising temperatures as these plants would need more water to sustain their growth. Farmers had changed their frequency of watering the field from weekly to 2 days a week. They also mention that they dig more tube wells and are using solar pumps to extract water. This results in a decrease in groundwater, and the farmers have observed it. Due to a reduction in rainfall, the groundwater table is declining, leading to less agricultural production. About 73.5% of the respondents applied fallow on land to get high production in the coming year. Climate change adaptation is much need for agriculture production, especially in areas where there is a lack of precipitation. Therefore, new cropping patterns, water management techniques, resistant heat, and drought crop varieties need to encourage (Fao 2016; Imran et al. 2018).
Empirical modeling to farmer’s coping and adaptation strategies
A multivariate probit model was utilized to find the relationship between farmers’ adaptation strategy and the linkage with explanatory variables. The models help in showing the effects of predictor variables on each response variable (coping and adaptation strategies). It also shows the correlation between error terms, the positive (complementarities), and negative (substitutability) correlation by applying various strategies like (a) coping; (b) adaptation to minimize drought impacts (Keshavarz et al. 2017). Models take account of the correlation between error terms. The univariate technique (probit model for binary choice-dependent variables) analyzes each coping and adaptation strategy individually. This approach usually fails to analyze common factors that are not measured and observed but can affect various coping and adaptation variables. It also ignores the potential correlation between unobserved disturbances in different coping and adaptation strategies. This gap in the univariate technique leads to statistical bias and incorrect estimates (Murthy et al. 2015). Due to these limitations with the univariate method, the multivariate probit method was applied. It consists of six (coping and adaptation strategies) binary choice equations that include crop diversification, input adjustment, water management, income diversification, asset depletion, and migration, respectively.
| 4 |
ɛ in are the error terms ~ N (0, V), V is the covariance matrix of the error term. Where V on the leading diagonal has values of 1 and correlations ρjk = ρkjas off-diagonal elements.
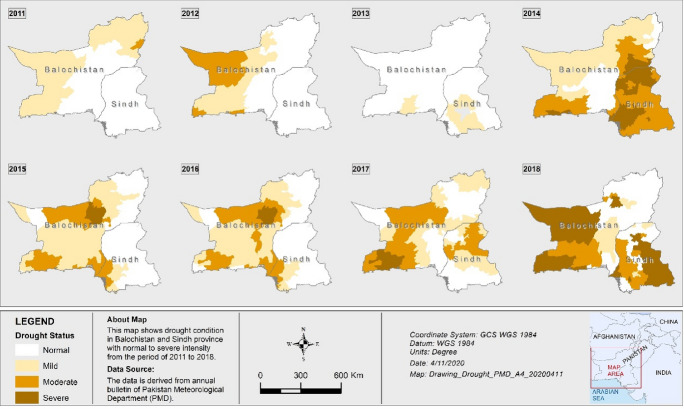
To approximate function value, maximum likelihood function, which is based on the multivariate normal distribution, can be computed by taking multidimensional integration, and the Geweke–Hajivassiliou–Keane (GHK) simulator method (Geweke et al. 1997) can be applied. The study employs a single distinct model optimization to get information on determinants of farmers’ coping and adaptation strategies of both on-farm and off-farm practices by estimating with the help of different prediction variables. Six dummy dependent variables are utilized in this model. Researchers identified different coping and adaptive strategies for climate change, including crop diversification, input adjustment, water management, asset depletion, income diversification, and migration. The drought data digitization and georeferenced quantification of the province showed a significant increase in the province’s drought status (Fig. 16) in the recent decade.
Fig. 16.
Spatial mapping of drought conditions in Baluchistan was normal to severe (normal = 1; severe = 5) intensity from 2010 to 2018
Water management practices are highly dependent on factors like household size, annual income, farmers’ experience, and access to credit. These factors showed statistically significant relationships, as shown in Table S1, and positively influenced farmers’ choice to mitigate the adverse impacts of climate change. Researcher Ashraf and Routray (2013) mentioned that total income and access to credit increased farmers’ ability to invest in water management practices such as the digging of tube wells and improved pesticides and fertilizers or house expenditures to minimize the production loss enhance the probability of climate change adaptation. Water scarcity is the fourth most critical constraint of adaptation next to a lack of information and labor shortage, knowledge, and policy barrier (Fao 2016; Imran et al. 2018).
Our study region is a marginal and highly variable agricultural environment. The increase of temperature over time, it will cause a higher risk to the water and agriculture sector. Along with climatic factors like increased temperature, decreased rainfall, and changed rainy season schedule, farmers also highlighted non-climatic factors such as inadequate electricity supply for irrigation, increased population, deforestation, over-exploration of underground water, etc. Farmers have perceived changes in the last 15 years or so in the middle of the rainy season, rainfall timing, the decline in rainfall precipitation, and increased temperature shifts. With the change in climate and poor water management, groundwater is being exploited at a faster rate than its replenishment in the uplands of Balochistan. The literature shows that groundwater declines at a rate of 3–6 m per year, which threatens the viability of farming communities (Jamro et al. 2020; Naz et al. 2020).
Farmers were taken a different type of combination measures and practices based on the information and financial availability at both on-farm and off-farm levels. Some of these measures applied by farmers are management and diversification in crops, input adjustment, handling water management, income diversification, asset depletion, and migration to other places for generating income and securing their livelihood. Farmers’ coping and adaptations at both on-farm and off-farm levels are identified by using a multivariate probit model, show different results, both positive or negative coefficients, and significant or insignificant output. Furthermore, this study also suggested different strategies of climate change risk reduction and measures for agriculture, which could be part of climate change, agriculture policy to help farmers sustain and manage their agro-based livelihood toward climate change.
Conclusion
Balochistan’s rough topography and arid climate, joined with maximum variability of precipitation, leads to extreme vulnerability and high frequency of droughts. Natural calamity impact assessment is critical so that needed precautionary measures may be taken to sidestep significant disaster. As cities population increase and land areas squeeze very rapidly, it is very important to support vulnerable rural communities to adapt to delicate environments, climate change, human-made, and natural disasters. Governments need to develop disaster-smart coping practices effective for off-farm and on-farm to alleviate the devastating impact of future droughts. Our research also discovered that socioeconomic factors play an important role in acclimatizing to extreme weather conditions. The study suggests that for farmers to adapt to changing climate, revised policies, arrangements of awareness and training programs, provide credits, subsidies, agriculture technology, best fertilizers, and modified/resilient crop varieties are essential. There is a need to initiate a particular focus to strengthen policies and norms and develop institutional and coordination mechanisms for disaster risk management, emphasizing agro-meteorology services preparedness and response. The rural societies in targeted high-risk areas might be empowered to develop early warning systems and eventuality plans and adopt drought risk reduction/management (DRR/M) actions.
Supplementary Information
Below is the link to the electronic supplementary material.
Acknowledgements
We acknowledge the technical support of the Pakistan Meteorological Department (PMD), R&D Division; Flood Forecasting Division (FFD), National Drought Monitoring Centre (NDMC) for the provision of the dataset. Special thanks are due to Dr. Muhammad Hanif and Mr. Nadeem Faisal, Climate Data Processing Center (CDPC), Karachi PMD.
Funding
The funding information is not applicable/no funding was received.
Declarations
Conflict of interest
The authors declare no conflict of interest.
Footnotes
Publisher's Note
Springer Nature remains neutral with regard to jurisdictional claims in published maps and institutional affiliations.
Muhammad Ashraf and Adnan Arshad have contributed equally and considered as first author.
Contributor Information
Muhammad Ashraf, Email: mashrafh75@gmail.com.
Adnan Arshad, Email: ad@cau.edu.cn.
References
- Abid M, Schilling J, Scheffran J, Zulfiqar F. Climate change vulnerability, adaptation and risk perceptions at farm level in Punjab, Pakistan. Sci Total Environ. 2016 doi: 10.1016/j.scitotenv.2015.11.125. [DOI] [PubMed] [Google Scholar]
- Ahmad I, Tang D, Wang T, et al. Precipitation trends over time using Mann-Kendall and spearman’s Rho tests in swat river basin, Pakistan. Adv Meteorol. 2015 doi: 10.1155/2015/431860. [DOI] [Google Scholar]
- Ahmad M, Mustafa G, Iqbal M (2016) Impact of farm households’ adaptations to climate change on food security: Evidence from different agro-ecologies of Pakistan. Pak Dev Rev
- Ahmed K, Shahid S, Harun S, Wang X, jun, Characterization of seasonal droughts in Balochistan Province, Pakistan. Stoch Environ Res Risk Assess. 2016 doi: 10.1007/s00477-015-1117-2. [DOI] [Google Scholar]
- Ahmed Nomman M, Schmitz M. Economic assessment of the impact of climate change on the agriculture of Pakistan. Bus Econ Horizons. 2011 doi: 10.15208/beh.2011.1. [DOI] [Google Scholar]
- Ali A, Erenstein O. Assessing farmer use of climate change adaptation practices and impacts on food security and poverty in Pakistan. Clim Risk Manag. 2017 doi: 10.1016/j.crm.2016.12.001. [DOI] [Google Scholar]
- Arkin H, Colton RR. Tables for statisticians. New York: Barnes and Noble Publication; 1963. [Google Scholar]
- Arshad A, Ashraf M, Sundari RS, et al. Vulnerability assessment of urban expansion and modelling green spaces to build heat waves risk resiliency in Karachi. Int J Disast Risk Reduct. 2020 doi: 10.1016/j.ijdrr.2019.101468. [DOI] [Google Scholar]
- Ashraf M, Routray JK. Perception and understanding of drought and coping strategies of farming households in north-west Balochistan. Int J Disast Risk Reduct. 2013 doi: 10.1016/j.ijdrr.2013.05.002. [DOI] [Google Scholar]
- Ashraf M, Routray JK. Spatio-temporal characteristics of precipitation and drought in Balochistan Province, Pakistan. Nat Hazards. 2015 doi: 10.1007/s11069-015-1593-1. [DOI] [Google Scholar]
- Balogun AL, Marks D, Sharma R, et al. Assessing the potentials of digitalization as a tool for climate change adaptation and sustainable development in urban centres. Sustain Cities Soc. 2020 doi: 10.1016/j.scs.2019.101888. [DOI] [Google Scholar]
- Bandara JS, Cai Y. The impact of climate change on food crop productivity, food prices and food security in South Asia. Econ Anal Policy. 2014 doi: 10.1016/j.eap.2014.09.005. [DOI] [Google Scholar]
- Beniston M, Stephenson DB, Christensen OB, et al. Future extreme events in European climate: an exploration of regional climate model projections. Clim Change. 2007 doi: 10.1007/s10584-006-9226-z. [DOI] [Google Scholar]
- Cisse A, Arshad A, Wang X, et al. Contrasting impacts of long-term application of biofertilizers and organic manure on grain yield of winter wheat in north China plain. Agronomy. 2019 doi: 10.3390/agronomy9060312. [DOI] [Google Scholar]
- Edenhofer O, Pichs-Madruga Y, Sakona E, et al (2014) IPCC, 2014: Summary for policymakers. In: Climate change 2014: Mitigation of climate change. Contribution of Working Group III to the Fifth Assessment Report of the Intergovernmental Panel on Climate Change
- Fao (2016) Planning, implementing and evaluating. Clim Smart Agric Smallholder Farm Systs
- Geweke JF, Keane MP, Runkle DE. Statistical inference in the multinomial multiperiod probit model. J Econom. 1997 doi: 10.1016/S0304-4076(97)00005-5. [DOI] [Google Scholar]
- Hussain M, Mahmud I. pyMannKendall: a python package for non parametric Mann Kendall family of trend tests. J Open Source Softw. 2019 doi: 10.21105/joss.01556. [DOI] [Google Scholar]
- Imran MA, Ali A, Ashfaq M, et al. Impact of Climate Smart Agriculture (CSA) practices on cotton production and livelihood of farmers in Punjab, Pakistan. Sustain. 2018 doi: 10.3390/su10062101. [DOI] [Google Scholar]
- IPCC (2018a) IPCC Special Report 1.5: Summary for Policymakers. In: Global warming of 1.5°C. An IPCC Special Report on the impacts of global warming of 1.5°C above pre-industrial levels and related global greenhouse gas emission pathways, in the context of strengthening the global response to the threat of climate change
- IPCC (2018b) Global warming of 1.5 °C
- IPCC (2014) Climate change 2014: synthesis report. In: Contribution of Working Groups I-III to the fifth assessment report of the IPCC
- Jamro S, Channa FN, Dars GH, et al. Exploring the evolution of drought characteristics in Balochistan, Pakistan. Appl Sci. 2020 doi: 10.3390/app10030913. [DOI] [Google Scholar]
- Kaushik G, Sharma KC. Climate change and rural livelihoods-adaptation and vulnerability in Rajasthan. Glob Nest J. 2015 doi: 10.30955/gnj.001376. [DOI] [Google Scholar]
- Keshavarz M, Maleksaeidi H, Karami E. Livelihood vulnerability to drought: a case of rural Iran. Int J Disaster Risk Reduct. 2017 doi: 10.1016/j.ijdrr.2016.12.012. [DOI] [Google Scholar]
- Khan S, Mu J, Jamnani MAR, et al (2005) Modeling water futures using food security and environmental sustainability approaches. In: MODSIM05: International congress on modelling and simulation: advances and applications for management and decision making, proceedings
- Khan N, Sachindra DA, Shahid S, et al. Prediction of droughts over Pakistan using machine learning algorithms. Adv Water Resour. 2020 doi: 10.1016/j.advwatres.2020.103562. [DOI] [Google Scholar]
- Lembi RC, Cronemberger C, Picharillo C, et al. Urban expansion in the Atlantic forest: applying the nature futures framework to develop a conceptual model and future scenarios. Biota Neotrop. 2020 doi: 10.1590/1676-0611-bn-2019-0904. [DOI] [Google Scholar]
- Murthy CS, Laxman B, Sesha Sai MVR. Geospatial analysis of agricultural drought vulnerability using a composite index based on exposure, sensitivity and adaptive capacity. Int J Disaster Risk Reduct. 2015 doi: 10.1016/j.ijdrr.2015.01.004. [DOI] [Google Scholar]
- Naz F, Dars GH, Ansari K, et al. Drought trends in Balochistan. Water. 2020 doi: 10.3390/w12020470. [DOI] [Google Scholar]
- Pakistan Bureau of Statistics (2017) Population Census 2017. In: Goverment of Pakistan
- Pakistan Bureau of Statistics (2018) Pakistan Statistical Year Book
- PMD (2018) Pakistan Meteorology Department. www.pmd.edu.pk
- Rasul G, Mahmood a, Sadiq a, Khan SI (2012) Vulnerability of the Indus Delta to Climate Change in Pakistan. Pakistan J Meteorol
- Rasul G, Chaudhry QZ, Mahmood A, Hyder KW (2011) Effect of temperature rise on crop growth & productivity. Pakistan J Meteorol
- Senyolo MP, Long TB, Blok V, Omta O. How the characteristics of innovations impact their adoption: an exploration of climate-smart agricultural innovations in South Africa. J Clean Prod. 2018 doi: 10.1016/j.jclepro.2017.06.019. [DOI] [Google Scholar]
- Udmale P, Ichikawa Y, Manandhar S, et al. Farmers’ perception of drought impacts, local adaptation and administrative mitigation measures in Maharashtra State, India. Int J Disaster Risk Reduct. 2014 doi: 10.1016/j.ijdrr.2014.09.011. [DOI] [Google Scholar]
- UNDP (2018) Human development indices and indicators. 2018 Statistical Update
- Yokomatsu M, Ishiwata H, Sawada Y, et al. A multi-sector multi-region economic growth model of drought and the value of water: a case study in Pakistan. Int J Disaster Risk Reduct. 2020 doi: 10.1016/j.ijdrr.2019.101368. [DOI] [Google Scholar]
- Zahid M, Rasul G (2010) Rise in summer heat index over Pakistan. Pakistan J Meteorol
- Zahid M, Rasul G. Changing trends of thermal extremes in Pakistan. Clim Change. 2012 doi: 10.1007/s10584-011-0390-4. [DOI] [Google Scholar]
Associated Data
This section collects any data citations, data availability statements, or supplementary materials included in this article.


