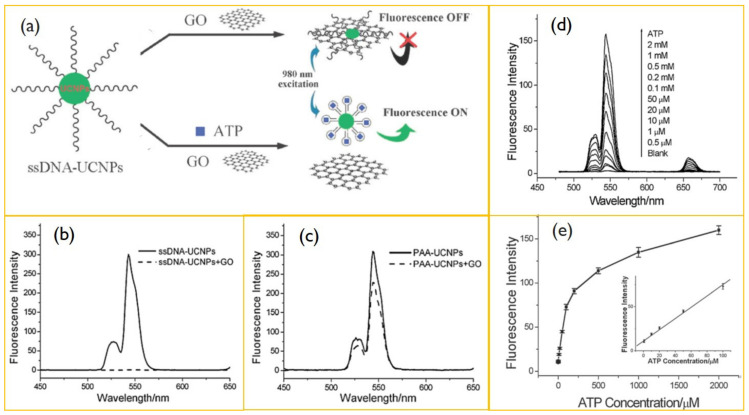
Figure 8.
(a) Schematic illustration of ATP sensing using a resonance energy transfer between ssDNA-UCNPs. (b) Upconversion spectra of ssDNA-UCNPs in Tris-HCl buffer after (dashed line) and before (solid line) incubation with GO. (c) Upconversion emission of PAA-UCNPs in Tris-HCl buffer after (dashed line) and before (solid line) the addition of GO. (d) Upconversion spectra of UCNPs-GO in the presence of 0–2 mM ATP. (e) Plot of upconversion emission intensity (at 547 nm) vs. ATP concentration. Reproduced with permission from [145].

