

Abstract
In this paper, we review the management of neonatal opioid withdrawal syndrome (NOWS) and clinical pharmacology of primary treatment agents in NOWS, including morphine, methadone, buprenorphine, clonidine, and phenobarbital. Pharmacologic treatment strategies in NOWS have been mostly empirical, and heterogeneity in dosing regimens adds to the difficulty of extrapolating study results to broader patient populations. As population pharmacokinetics (PKs) of pharmacologic agents in NOWS become more well‐defined and knowledge of patient‐specific factors affecting treatment outcomes continue to accumulate, PK/pharmacodynamic modeling and simulation will be powerful tools to aid the design of optimal dosing regimens at the patient level. Although there is an increasing number of clinical trials on the comparative efficacy of treatment agents in NOWS, here, we also draw attention to the importance of optimizing the dosing regimen, which can be arguably equally important at identifying the optimal treatment agent.
INTRODUCTION
Neonatal opioid withdrawal syndrome (NOWS), traditionally referred to as neonatal abstinence syndrome (NAS), is the withdrawal syndrome that occurs in neonates who are exposed to opioids in utero. 1 The sharp increase in NOWS incidences from 1.2 to 8.8 for every 1000 hospital births from 2000 to 2016 can be ascribed to a rise in maternal opioid use. 1 NOWS is characterized by hyperactivity of the central nervous system (CNS) and dysregulation of autonomic nervous system. 2 Neonates with NOWS exhibit symptoms that range from tremors, poor feeding, irritability, to increased muscle tone, fever, and seizures, 3 and these newborns are more likely to have low birth weight and respiratory complications than other newborns. 4
The significant growth in the incidence of NOWS in recent years corresponded to a significant upward trend in associated national healthcare expenditures. Hospital costs covered by Medicaid increased substantially from $65.4 million in 2004 to $462 million in 2014. 5 There is a need to improve the effectiveness and efficiency of NOWS treatment, decrease the length of hospitalization of these newborns, and reduce associated healthcare expenditures. Previous retrospective studies showed that use of standard treatment protocols could reduce treatment and hospitalization duration. 6 However, there is a lack of consensus on NOWS treatment protocols on pharmacotherapy procedures, and there exists significant variability in treatment outcomes due to patient‐specific factors and site‐to‐site variations in treatment duration, length of stay, and hospital charges. 7 In‐depth understanding of the clinical pharmacology of treatment agents will greatly enhance our ability to optimize therapy in infants with NOWS, as it is essential for formulating evidence‐based treatment protocols. To this end, we first provide an overview of NOWS management, then delve into the details of clinical pharmacology for primary treatment agents and summarize available pharmacokinetic (PK) studies in the neonates. Finally, we will discuss the current progress and future research needed for dosing regimen optimization integrating PK/pharmacodynamic (PD) evidence. Although NOWS has been the focus of a number of recent review papers, our review paper aims to emphasize on current experiences and future perspectives of dosing regimen optimization in NOWS.
OVERVIEW OF THE MANAGEMENT OF NOWS
The diagnosis and treatment of NAS in clinical practice is typically guided by scoring systems that evaluate the withdrawal symptoms, but there is no consensus on a single scoring tool. The most widely used tool is the Finnegan Neonatal Abstinence Scoring Tool; the modified Finnegan Score from the MOTHER trial is also commonly used. 1 It is also worth mentioning that a new scoring tool named Eat, Sleep, Console has been introduced recently with potential advantages (i.e., reduced use of pharmacologic treatment and hospital stay) over the traditional scoring tools. 8 Overall, these scoring tools support the decision to start pharmacologic intervention in patients who have severe symptoms and/or fail to respond to nonpharmacologic management, and to guide dosing escalation/de‐escalation in these patients. 9
Nonpharmacologic treatment is indicated in all infants as the foundation of care and should be continued throughout hospitalization whether or not the infants receive pharmacologic treatment. 1 Examples of nonpharmacologic interventions include breastfeeding, decreasing environmental stimuli, responding early to signals, and giving small and frequent feedings. 1 , 3 Use of pharmacotherapy is indicated in severe NOWS in addition to nonpharmacologic interventions to relieve withdrawal symptoms and minimize complications from withdrawal. 1 However, it must be noted that the clearly proven benefit of pharmacologic treatment is limited to short‐term symptomatic relief. 3 Unnecessary pharmacologic intervention may lead to prolonged exposure to drugs and hospital stay. 3
A study on the incidence of NAS in 299 neonatal intensive care units in the United States reported that the most commonly prescribed medications, morphine, was used in 72% of the infants in 2013, compared with phenobarbital, methadone, and clonidine in 20%, 15%, and 9% of the infants, respectively. 10 These findings were in line with the American Academy of Pediatrics (AAP) Guidelines on NOWS, which recommended using an opioid as a first‐line treatment agent. 1 The guidelines recognize emerging evidence on the potential advantage of longer‐acting opioids (e.g., methadone and buprenorphine) over morphine in terms of duration of treatment/hospital stay. 1 Additionally, on the use of adjunctive or secondary treatment agent, the guidelines favor clonidine over the more commonly used phenobarbital due to potential safety concerns of phenobarbital, although there is insufficient evidence on the comparative efficacy of the two agents. 1
A recent systematic review, including 18 randomized clinical trials of pharmacological therapy (N = 1072), found that sublingual buprenorphine performed the best in terms of length of treatment, followed by clonidine, dilute tincture of opium (DTO), methadone, morphine, and phenobarbital monotherapy. 11 However, the analysis results were sensitive to imprecision due to insufficiently powered comparisons. 11 The authors commented that although the shorter lengths of treatment associated with buprenorphine might be due to its prolonged half‐life and receptor activity, it was unclear how much of such observed benefits was in fact due to the optimization of treatment protocol and weaning schedule in the buprenorphine trials. 11 When comparing different treatment agents, safety profiles should also be taken into consideration. Clinically, the commonly used opioids and clonidine have favorable safety profiles with inpatient use; phenobarbital appears clinically safe, but its effect on neurodevelopment is a potential concern. 1 Nevertheless, standardized protocols should be used to minimize opioid exposure, 1 given the concerns raised by experimental data on the long‐term neurodevelopmental effect of opioids. 12 Another potential concern may lie with drug formulation. It is still unclear what level of ethanol exposure is considered safe in neonates, but it is recommended that medications containing ethanol should be used with caution in neonates. 13 The AAP established an arbitrary ethanol concentration limit of 0.25 g/L following a single dose. 14 However, ethanol concentrations ranging from 0.01 to 1 g/L have been related to CNS adverse effects in children in the literature. 15 In terms of specific drug formulations, preservative‐free morphine is commercially available, but the commercially available methadone contains 15% ethanol. Preservative‐free methadone has been compounded for use in clinical trials. 16 On the other hand, buprenorphine used in NOWS trials contains a high amount of alcohol, with one reported formulation containing 30% of ethanol. 17
Although there is an increasing number of clinical trials on the comparative efficacy of treatment agents in NOWS, here, we also draw attention to the importance of optimizing the dosing regimen, which can be arguably equally important at identifying the optimal treatment agent. Oftentimes, variations in starting doses, escalation/weaning schemes, and use of adjunctive therapy and nonpharmacological therapy may limit the generalizability of comparative efficacy study results to broader patient populations. Although most treatment protocols involve rapid uptitration of an opioid and subsequent weaning at typically 10% increments, treatment approaches differ significantly across institutions and there is no consensus on the standard of care. 18 Therefore, in addition to studying comparative efficacy, optimization of dosing regimens should also be a priority for future research. In‐depth understanding of clinical pharmacology for individual agents will be key to therapy optimization, as it serves as the basis for the use of population PK/PD modeling and simulation to inform the design of treatment strategies.
DEVELOPMENTAL PHARMACOKINETICS IN NEONATES
Physical and biological differences in children and adults lead to their differences in drug exposure (PKs) and/or exposure response (PDs, with PKs referring to the processes of drug disposition in the body (i.e., absorption, distribution, metabolism, and excretion [ADME]), and PD referring to the body’s physiological and biological response to the therapeutic agent. 19 Developmental changes in childhood comprise maturation of enzyme pathways (related to PKs), as well as expression and activity of receptors and proteins (related to PDs). 19 Such maturation processes are often nonlinear and do not correlate with body weight alone, and therefore linear extrapolations from adult dosing to pediatric dosing based on body weight (i.e., the linear per kilogram model) is often an oversimplification and may lead to under‐ or overdosing. 19 Because pediatric studies often involve sparse sampling and unbalanced design, a population approach with nonlinear mixed effect modeling is the preferred tool to study PK and PD parameters. The power of the population approach lies in its ability to use all available individual data to estimate population mean of the parameters, as well as estimating the inter‐ and within‐individual variability. 20 The resulting models, once validated, can be used to derive rational dosing schemes that are predicted to be safe and effective, which in turn can be challenged and tested in prospective clinical trials. 19
Using the population approach, the effect of developmental changes in children can be investigated mainly by testing size (body weight) and/or age as predictors (covariates) of PK/PD variability. 19 Size can be incorporated in the model either a priori by allometric scaling (fixed allometric model) or as a covariate as any other (systematic covariate model). 19 Allometric scaling relations have been used to describe how biological variables change dependent on body mass. The use of 3/4 as the scaling exponent for metabolic rates is well supported by theoretical and experimental evidence, and therefore it can be used as the power parameter for drug clearance (CL). 21 Volume of distribution (V) has been found to be directly proportional to body weight, so one can be used as the scaling exponent for volume terms. 21 Although the use of allometry can help explain the influence of body size, it cannot fully explain the maturation trajectory of metabolizing enzymes, receptors, and transporters, which contributes to considerable variability observed in neonates. 22 For example, the dominant CYP3A enzyme in the fetus is CYP3A7 and its level gradually decreases after birth as expression of CYP3A4 increases. 23 In fact, the majority of drug metabolizing enzymes are expressed at low levels before birth, and their expression levels mature within a few weeks in the case of CYP2D6, or within 1–2 years after birth in the case of CYP1A2 and CYP3A4. 23 Renal function and liver blood flow also mature as a function of age. 19 Additionally, body composition evolves continuously in childhood, which can affect the volume of distribution of drugs. Neonates have much higher percentage of total body water (80%–90% of body weight) than adults (55%–60% of body weight). As a result, for hydrophilic drugs, a larger volume of distribution is observed in neonates than in adults. 19 Therefore, influence of age should be explored next as a covariate, and postmenstrual age (PMA), gestational age (GA), and postnatal age (PNA) can all be tested as age descriptors.
As an example, Holford et al. 24 proposed a “standard approach” to model PK parameters in children following Equations 1and 2:
| (1) |
| (2) |
where WTstd is usually set to 70 kg; CLstd and Vstd stand for clearance and volume in a reference adult with weight of WTstd; PMA refers to postmenstrual age, TM50 refers to the maturation half‐life, and HILL stands for the Hill coefficient in a sigmoidal maximum effect (Emax) model. The authors proposed that PNA was not as a good predictor as PMA, because most maturation processes start in utero. 25 Maturation of clearance may also be described with other functions, such as linear, exponential, and asymptotic exponential models, the advantages and disadvantages of which are discussed elsewhere. 21 Changes in volume of distribution in relation to age can occur due to changes in body composition, and such changes may be described with similar functions as those used for clearance. 21
Last, one needs to be cautious when interpreting the results from models incorporating both body weight and age‐dependent maturation. We could use such models to predict when the parameter (e.g., CL and V) in neonates reach certain percentage of the adult value, with body weight already taken into account using the weight function in the model. For example, it was reported that the glomerular filtration rate (GFR) in ml/min/70 kg is 35% of the adult value in neonates and reaches adult value at around the age of 1 year. 26 This should not be interpreted as the actual GFR value in children older than 1 year of age is the same as that in adults. Rather, based on this model, the actual GFR value in children aged over 1 year continues to grow, but this growth can be explained by weight alone.
PHARMACOLOGY AND PHARMACOKINETICS OF FIRST‐LINE AGENTS IN NOWS
Morphine
Pharmacology
Morphine is a μ‐opioid agonist used for treating moderate‐to‐severe pain. Its binding to μ‐opioid receptors is responsible for its therapeutic effect of analgesia, sedation, euphoria, and respiratory suppression. 27 Glucuronidation of hydroxyl groups on 3‐ and 6‐positions mainly by UDP‐glucuronosyltransferases 2B7 produces morphine‐3‐glucuronide (M3G) and morphine‐6‐glucoronide (M6G). 28 Multiple studies have shown that M6G is a strong μ‐opioid agonist with analgesic properties that contribute significantly to analgesic effect of morphine, and it appears to have less respiratory depressant effects than morphine. 29 In contrast to M6G, M3G has very low binding affinity for μ‐opioid receptors with no analgesic properties. 30
PK in adults
Morphine undergoes extensive hepatic first‐pass metabolism, leading to relatively low bioavailability (~20%–30%). 31 Time to the maximum plasma concentration (Tmax) is ~ 1 h after oral dosing. 32 Its distribution has been modeled by one, two, and three compartments in reported literature, and studies that had the longest and most frequent sample collection tend to favor three‐compartment models. 31 Reported steady‐state volume of distribution ranges from 1 to 4 L/kg. 33 Ninety percent of the dose is metabolized, with an estimate of 45%–55% of the dose converted to M3G and 10%–15% to M6G, and the rest to minor metabolites, including normorphine, morphine‐3,6‐diglucuronide, morphine‐3‐ethereal sulfate, normorphine‐6‐glucuronide, normorphine‐3‐glucuronide, and codeine. 34 The route of administration has been reported to affect the M3G/M6G to morphine plasma area under the concentration‐time curve (AUC) ratios, indicating these glucuronide metabolites are formed from both first‐pass effect and systemic clearance. 35 Estimated total clearance ranges from 75 to 118 L/h, 31 which supports that morphine has a high hepatic extraction ratio. Estimated elimination half‐life ranges from 1.4 to 2.7 h. 35 , 36 M3G and M6G are both eliminated by the kidneys, and the exposure to both metabolites increases in renal impairment. 37
PKs in neonates
Compared with adults, morphine CL is lower in neonates due to immature glucuronidation capacity, but it is well‐established that term neonates are able to metabolize morphine to M3G and M6G. 38 In term neonates, renal excretion of unchanged morphine accounts for a higher proportion of total body clearance (~19%), compared with adults (~10%). 38
Pediatric studies have found that morphine CL (when expressed on a linear per kg basis) increases with age and reaches adult values between 1 and 6 months of age. 38 , 39 , 40 A meta‐analysis by Kart et al. 38 on estimated PK parameter values in the pediatric population reported that the mean volume of distribution was 2.8 L/kg in neonates and children regardless of the age, which is in the range of the adult value on a linear per kg basis. Pooled estimates of half‐life were 9.0 h and 6.5 h in preterm neonates and term neonates aged 0–57 days, which were significantly longer than adult adults (~1.4 to 2.7 h). 38 Correspondingly, pooled estimates of clearance ranged from 2.2 to 8.1 ml/min/kg (0.13–0.49 L/h/kg) in preterm neonates and term neonates, respectively. 38 It is apparent that in neonates, weight‐normalized morphine CL increases with gestational and postnatal age, although up to a seven‐fold interindividual variation in clearance has been reported in neonate studies. 38
A number of population PK models for morphine have been proposed in the pediatric population that included neonates. However, they differed in terms of the number of compartments for the parent compound and/or the glucuronide metabolites, parameterization of allometric equations, how/which age descriptors were incorporated into clearance and/or volume, and what maturation functions were used. Comparative performance of these models and other published pediatric PK models in describing pediatric morphine PK observations has been studied elsewhere with divergent conclusions. 41 , 42 , 43
Liu et al. 44 reported a morphine population PK model in NOWS based on 88 blood samples collected from 34 neonates who were given DTO orally (containing 0.04 mg morphine per ml). Prior to this report, there had only been studies of morphine PKs following intravenous administration in pediatric patients. In the development of the population PK model, the authors used data from adult patients who received intravenous morphine with rich sampling scheme. 45 The authors started with a three‐compartment model used in the adult study, followed by addition of allometric scaling to PK parameters. Maturation of clearance based on PMA using a sigmoidal maturation model and maturation of central volume based on PNA using an exponential model were also used. Last, the model included the addition of first‐order absorption rate constant and bioavailability parameters (Table 1). 44 Standardized clearance estimate (75.3 L/h/70 kg) was in the range of previously reported adult values. The authors confirmed the findings by Holford et al. 42 that time to reach 50% of adult value of clearance was 58.3 weeks PMA, and that of central volume was 9.65 weeks PNA (standardized to a 70 kg person). 44
TABLE 1.
Summary of published population PK models for pharmacologic agents in neonatal opioid withdrawal syndrome
| References | Agent | Number of samples/subjects | Parameterization a | ||||||
|---|---|---|---|---|---|---|---|---|---|
| Liu et al. 44 , 46 | Morphine |
Liu et al. 44 : 88 samples from 34 neonates. Sampling: 2–3 samples per subject at random |
|
||||||
|
Liu et al. 46 : 348 samples from 81 neonates from three studies. Sampling: ‐ JHU‐Morphine trial: up to 4 samples per subject at random ‐ BBORN trial: pre‐defined sparse sampling (peak, trough, after dose cessation), 4–16 samples per subject ‐ JHU‐DTO trial: 2–3 samples per subject at random (Liu et al. 44 ) | |||||||||
| Wiles et al. 60 | Methadone |
71 samples from 20 neonates. Sampling: 3 samples related to a single dose and 1 optional sample per subject |
|
||||||
| van Donge et al. 61 | Methadone |
121 samples from 31 neonates. Sampling: all taken after a single oral dose |
|
||||||
|
Ng et al. 73 |
Buprenorphine |
209 samples from 24 neonates and 94 samples from 5 adults. Sampling: trough or peak |
|
||||||
| Moore et al. 74 |
265 samples from 28 neonates. Sampling: at least one peak within 24 hours; peak and trough surrounding a single dose or as a mid‐dose Interval timepoint |
||||||||
| Mizuno et al. 75 | Buprenorphine |
52 samples from 19 neonates. Sampling: three samples collected around the second dose |
No covariates included on PK parameters | ||||||
| Xie et al. 92 | Clonidine |
102 samples from 36 neonates. Sampling: 2–3 samples per subject at random |
|
Abbreviations: CL, clearance; CL/F, total apparent clearance; Emax, maximum effect; GA, gestational age; PK, pharmacokinetic; PMA, postmenstrual age; PNA, postnatal age.
Parameters with standard subscript: parameter value standardized to 70 kg adults.
In a more recent publication by Liu et al., the authors expanded their original DTO population PK model by incorporating data from two additional clinical trials in neonates treated with enteral morphine for in utero‐acquired and intensive care unit‐acquired NOWS (Table 1). 46 With this expanded dataset (a total of 81 neonates), a PNA‐dependent model bias was identified; as a result, in the updated model, PNA effect was added to both clearance and bioavailability terms to account for PNA‐dependent morphine CL. 46 In contrast to the bioavailability estimate in the original DTO population PK model (48.5%), with the updated model, bioavailability is predicted to be high shortly after birth and decrease to 20% in patients older than 7 days PNA, a value similar to reported morphine bioavailability in adults. 46 Although enzyme maturation is typically related to PMA, the authors hypothesized that their findings of PNA effect on morphine CL after adjustment of body weight and PMA, may be explained by PNA‐dependent formation of uridine diphosphate glucuronic acid that leads to PNA‐dependent glucuronidation activity during the first week of life. 46 However, further experimental and clinical data will be needed to substantiate this hypothesis.
A summary of neonatal and adult PK parameters and morphine elimination is presented in Figure 1.
FIGURE 1.
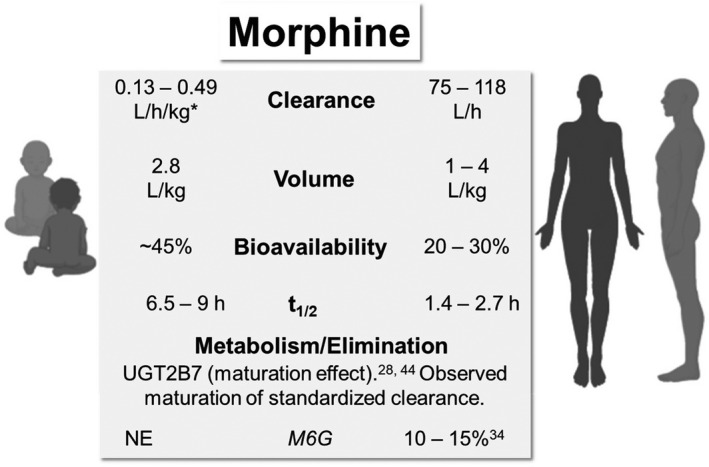
Comparative pharmacokinetic parameters and elimination of morphine in neonates/infants and adults. *Clearance increases with age (0–57 days). 38 NE, not estimated; t1/2, terminal half‐life
Methadone
Pharmacology
Methadone is synthetic μ‐opioid agonist widely used for treatment of opioid addiction and chronic pain. 47 Although methadone is a full μ‐opioid receptor agonist, it has lower abuse potential than morphine, likely due to its long duration of effect in suppressing withdrawal; it is thus used for addiction treatment. 36 Methadone is marketed as a racemic mixture. Compared with (S)‐methadone, (R)‐methadone binds to μ and δ opioid receptors with 10 times higher affinity and has up to 50 times of analgesic activity. 48 (S)‐methadone is generally considered to be ineffective, 49 but there is also evidence that it has antagonist activity at the N‐methyl‐d‐aspartate (NMDA) receptor, and it may be able to decrease the development of opioid tolerance through NMDA receptor antagonism. 50
PKs in adults
Studies in adults showed that methadone has relatively high but variable bioavailability, with reported values ranging from 41%–76% to 85%–95%. 51 Reported average values of Tmax are between 2.5 and 4.4 h. 51 Methadone is highly lipophilic, with percent plasma protein bound greater than 90% and a relatively large volume of peripheral compartment. Methadone time‐concentration can be modeled using a bi‐exponential function, with a rapid distribution phase and a slow elimination phase. 51 The estimated volume of distribution for methadone approximates 2.7 to 4.2 L/kg. 52 Methadone is metabolized to two inactive metabolites, 1,5‐dimethyl‐3,3‐diphenyl‐2‐ethylidene‐pyrrolidine (EDDP) and 2‐ethyl‐5‐methyl‐3,3‐diphenylpyrroline. 53 Although CYP3A4 was long considered to be the major metabolizing enzyme of methadone, recent evidence has shown that CYP2B6, not CYP3A4, is predominantly responsible for methadone metabolism in humans. 54 Reported clearance ranges from 4 to 11 L/h, and correspondingly terminal half‐life ranges from 19 to 43 h. 52 Variability in the elimination half‐life among individuals can be attributed to variation in urinary pH and enzyme activity, and renal clearance of methadone only becomes quantitatively important when urine pH is less than 6. 55 On the other hand, one study reported the AUC ratio of methadone over EDDP in the first 24 h after oral dosing ranged from 5.9 to 44.6, indicating large interindividual variations due to different metabolic activity. 56 Such variability in methadone disposition could be partially explained by variations in CYP2B6 genetics as well as CYP2B6‐mediated drug interactions. 57 Reduced methadone metabolism was observed in severe liver impairment, but in mild to moderate liver impairment the metabolism of methadone was near normal levels. 47
PKs in neonates
Ward et al. 53 studied the population PK of intravenous methadone and its metabolites in neonates, infants, and children by pooling PK observations from four studies (N = 56). A 3‐compartment model was proposed with allometric scaling applied to PK parameters of racemic methadone, and parameter estimates standardized to a 70 kg adult were 21.5 L/70 kg for central volume, 75.1/70 kg and 484 L/70 kg for the 2 peripheral volumes, and 9.45 L/h/70 kg for clearance. No maturation effect on clearance was noted, overall standardized parameter estimates in children and neonates were close to those reported in adult studies. 53 The effect of PMA was only significant on the rapidly equilibrating peripheral volume, and this relationship was described using a decreasing asymptotic exponential function. In this study, the differences in clearance in neonates and children/adolescents could be explained sufficiently by allometry, and the authors postulated that high CYP3A7 levels in fetal liver might be contributing to clearance in neonates. 53 However, as recent evidence has identified CYP2B6, not CYP3A4, as the major metabolizing enzyme of methadone, we can hereby propose an alternative explanation. One study of human hepatic CYP2B6 developmental expression in pediatric liver samples found that despite significant interindividual variability, CYP2B6 expression was detected in the majority of the fetal and neonatal samples; additionally, the authors observed only a two‐fold increase in CYP2B6 expression levels after the neonatal period. 58 A more recent study found that CYP2B6 activity occurred as early as the first day of life, and the levels and activity increased through infancy and they may approach adult values by 1 year. 59 In agreement with their findings, the lack of maturation effect of age on clearance in the PK analysis by Ward et al. could possibly be explained by (1) sufficient ability in many neonates to metabolize CYP2B6 substrates and/or (2) insufficiency of the age effect in the context of large variability of CYP2B6 activity.
Population PK of methadone in neonates with NOWS receiving two dosing schemes orally were reported by Wiles et al. 60 based on observations from 20 patients (Table 1). Large interindividual variability in methadone and metabolite concentrations was noted in the model‐building process. 60 A one‐compartment model with first‐order absorption was used to fit the data, and allometric scaling on clearance and volume terms was incorporated. Similar to the model by Ward et al., 53 maturation factor based on PMA was explored but did not improve the model fit, so it was excluded from the model. 60 Estimated standardized apparent clearance (8.94 L/h/70 kg) was similar to adult values, whereas the estimated standardized apparent volume (177 L/70 kg) was at the low end of adult values 60 ; correspondingly half‐life was calculated to be 14 h.
The study by van Donge et al. 61 was the first clinical investigation on single dose PKs of oral methadone in preterm neonates (Table 1). The authors developed a population PK model of methadone using 121 methadone concentrations collected from 31 preterm neonates (GA between 26 and 36 weeks), and 2 enantiomers of methadone were modeled separately using 1‐compartment models with first‐order absorption. In contrast to previous population PK models in neonates where age descriptors were not included on clearance after allometric scaling was incorporated, in this study, GA was incorporated on clearance and volume terms in a power function and a linear function, respectively, whereas allometric scaling was not incorporated on PK parameters. 61 Apparent clearance of (R)‐methadone and (S)‐methadone in preterm neonates was estimated to increase about 5 times from 26 weeks to 36 weeks of GA (from 0.0997 to 0.5574 L/h and from 0.0692 to 0.3708 L/h, respectively). 61 This could potentially be explained by the development of CYP2B6 activity in preterm neonates who may have lower metabolic capacity than term neonates, and/or the high correlation of GA with body weight (r = 0.82) in this study as allometric scaling was not incorporated.
More recently, McPhail et al. 62 adapted a physiologically‐based pharmacokinetic (PBPK) model in adults to neonates with NOWS using the same clinical data from Wiles et al., 60 aiming to further the understanding of the large PK variability observed. Similar to the population PK model by Wiles et al., 60 this PBPK model reasonably predicted methadone PK, 62 but there remained significant unexplained PK variability. Findings from this PBPK model suggested that (1) CYP2B6 is the major metabolizing enzyme of methadone, and (2) CYP2B6 expression at birth is at adult levels, both of which are consistent with assessment of clinical methadone disposition and CYP2B6 ontogeny presented above. 54 , 58 , 62 Overall, this study indicated that CYP enzyme activity and protein binding could significantly affect methadone disposition, and therefore CYP2B6 polymorphisms could be a contributing factor to the observed interpatient PK variability. 62
A summary of neonatal and adult PK parameters and methadone elimination is presented in Figure 2.
FIGURE 2.
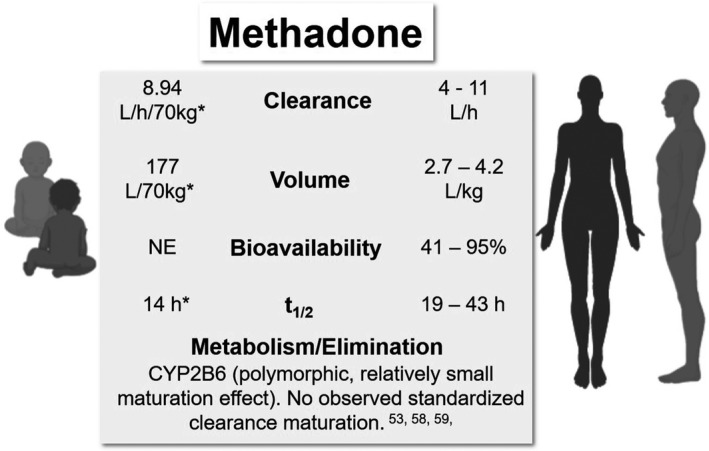
Comparative pharmacokinetic (PK) parameters and elimination of methadone in neonates/infants and adults. *Apparent parameter estimates from a population PK model by Wiles et al. 60 NE, not estimated; t1/2, terminal half‐life
Buprenorphine
Pharmacology
Buprenorphine is a partial μ‐opioid agonist approved for treatment of opioid use disorder. 63 It produces effects typical of μ‐opioid agonists, including analgesia, euphoria, sedation, and respiratory suppression. 64 However, in contrast to full μ‐opioid agonists, the effects of buprenorphine, including euphoria‐related subjective measures and respiratory suppression, were found to plateau at high doses. 65 Ceiling effects on PDs of buprenorphine were found to translate to a wider safety margin compared with full agonists. 65 Although buprenorphine’s major metabolite, norbuprenorphine, has much less analgesic potency than buprenorphine, the former may cause more respiratory depression than buprenorphine. 66
PKs in adults
Buprenorphine has very low oral bioavailability due to extensive first‐pass metabolism; however, adequate sublingual bioavailability makes sublingual dosing feasible. 64 In adults, the bioavailability of sublingual solution is estimated to range from 28% to 51%, and significant interindividual variability has been noted. 67 , 68 In terms of sublingual exposure time, one study demonstrated similar percent absorbed after holding the solution for 2.5 min or 10 min, 69 but it is possible that even shorter hold times could reduce the dose absorbed. In adults, Tmax is ~ 1 h after sublingual dosing. 67 Buprenorphine is highly lipophilic with extensive distribution. When administered intravenously, the volume of distribution of buprenorphine is estimated to be between 188 and 335 L, which appears to be larger when administered sublingually possibly due to the reservoir effect of oral mucosa. 64 , 67 Buprenorphine is extensively metabolized by CYP3A4 to a N‐dealkylated metabolite, norbuprenorphine, and both are subsequently metabolized to glucuronides. 70 Buprenorphine is a high extraction ratio drug with average plasma clearance in healthy subjects ranging from 55.6 to 115.3 L/h following intravenous administration. 64 Reported values of elimination half‐life are highly variable, with mean values from individual studies ranging from 3 to 44 h following sublingual administration. 64
PKs in neonates
Previous reports found that neonates had higher buprenorphine‐to‐norbuprenorphine ratio than adults, possibly due to immaturity of hepatic function of the neonates. 64 Specifically, it was thought that CYP3A7, the major fetal hepatic cytochrome P450 enzyme, was not able to metabolize buprenorphine. 64
Barrett et al. 71 studied the PKs of buprenorphine in 12 premature neonates following intravenous infusion, and reported that the average values of clearance, elimination half‐life, and volume of distribution using a 1‐compartment model were 0.23 L/h/kg, 20 h, and 6.2 L/kg, respectively. The reported clearance value was significantly lower than adult values, reflecting the immaturity of the metabolism process in neonates. One limitation of this study is that the buprenorphine concentrations were measured by a radioimmunoassay that could cross‐react with buprenorphine glucuronide, 72 whereas newer assays involving mass spectrometry used in more recent studies have much higher specificity.
Ng et al. 73 reported a two‐compartment linear population PK model of sublingual buprenorphine based on observations from 24 neonates with NOWS and 5 healthy subjects (Table 1). After the effect of weight on PK parameters was accounted for by allometric scaling, the effect of PNA on clearance was described by a combination of two maturation models (a sigmoidal Emax model and an exponential model), whereas the effect of PNA on peripheral volume was described by a sigmoidal Emax model. 73 Typical values of apparent clearance and elimination half‐life for neonates weighing 2.9 kg and aged 5.4 days were estimated to be 3.5 L/kg/h and 11 h. 73 It was estimated that at PNA of 0.5 days and 9.35 days, apparent clearance standardized to a 70 kg person would achieve 50% and 90% of adult value, respectively. 73 Based on the model estimated apparent clearance and previously reported clearance in preterm neonates following intravenous administration (0.23 L/kg/h) by Barrett et al., 71 the bioavailability of the sublingual formulation was estimated to be only 7%. 73 The authors commented that this estimated bioavailability in neonates was much lower than reported adult values (28%–51%), possibly due to different factors that affected sublingual absorption and/or a larger fraction of dose swallowed. 73
The population PK model by Ng et al. 73 was later adapted to data from another clinical trial in a PK‐PD analysis by Moore et al. 74 The population PK model in this analysis was based on 265 PK observations (buprenorphine and norbuprenorphine) from 28 patients treated with sublingual buprenorphine. 74 In the parent buprenorphine model‐building process, the model structure was based on the prior Ng model, whereas some of the parameters were re‐estimated. 74 After the parent model was fit, it was extended to a parent‐metabolite model, where the norbuprenorphine PK was modeled by a one‐compartment model, and allometric scaling was incorporated and a sigmoidal Emax maturation model was added to clearance of norbuprenorphine. 74 Standardized apparent clearance, central volume, and peripheral volume of buprenorphine were estimated to be 203 L/h/70 kg, 142 L/70 kg, and 6350 L/70 kg, which were within 30%–40% of the previously estimated values in the Ng model. 74
Mizuno et al. 75 also reported a population PK‐PD analysis in patients with NOWS treated with sublingual buprenorphine (52 buprenorphine PK observations from 19 neonates). In contrast to the previous reports, a one‐compartment model with first‐order absorption was used to describe the PK data, and no age descriptors were included in the PK model after incorporation of allometric scaling. 75 The estimate of standardized clearance (32.6 L/h/70 kg) was also lower than those from previous studies. 75 Such differences from previous models were likely resulted from some important limitations of the PK sampling in this study, where a limited number of PK samples were all taken around the second dose of buprenorphine. As a result of this limited PK sampling time window, insufficient information could be derived regarding terminal phase of buprenorphine PKs and the maturation of buprenorphine clearance over the length of typical treatment duration.
More recently, Kovar et al. 76 developed a PBPK model in preterm neonates from scaling an adult model of buprenorphine and norbuprenorphine, by accounting for age‐related changes (e.g., size, protein binding, maturation of elimination processes, and tissue compartment composition). Evaluation of this model in preterm neonates was performed using clinical PK data reported by Barrett et al., 71 and applicability of such a scaling approach was demonstrated by the ability of the model to predict 75% of individual AUC within a twofold range. 76
A summary of neonatal and adult PK parameters and buprenorphine elimination is presented in Figure 3.
FIGURE 3.
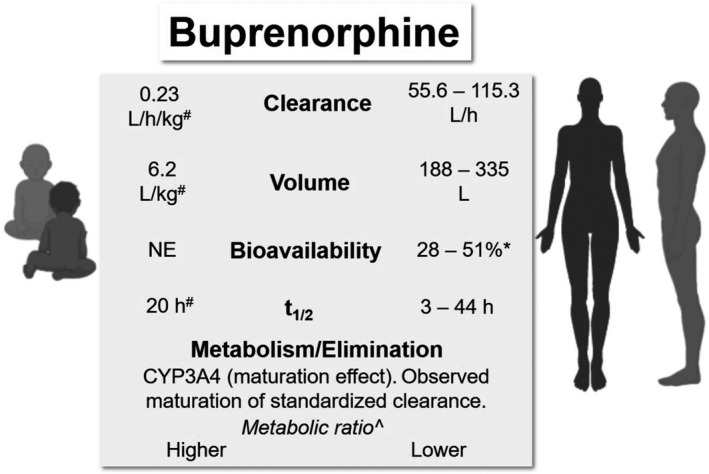
Comparative pharmacokinetic parameters and elimination of buprenorphine in neonates/infants and adults. *Sublingual dosing. #Estimated in premature neonates. 71 ^Relative ratio of buprenorphine to norbuprenorphine. NE, not estimated t1/2, terminal half‐life
Clonidine
Pharmacology
Clonidine is a centrally acting antihypertensive agent, and it is also clinically used in pediatric anesthesia as premedication or an analgesic. 77 It is an imidazole compound that acts as a selective partial agonist at α2‐adrenergic receptors, and its cardiovascular effects are thought to be mediated through stimulation of α2‐inhibitory neurons in the medulla oblongata that leads to reduction in noradrenergic neurotransmission. 78 Specifically, clonidine stimulates presynaptic α2‐adrenergic receptors and decreases norepinephrine release and consequently peripheral sympathetic output to the heart and vasculature. 78 Additionally, it exerts its sedative effect in the locus coeruleus where it inhibits the spontaneous firing of the nucleus, leading to CNS suppression. 77
PKs in adults
Clonidine is highly bioavailable and readily absorbed; reported mean bioavailability values are from 75% to 90%, and Tmax occurs between 1.5 and 2.5 h after oral administration. 79 , 80 Clonidine is also commercially available as transdermal patches that are designed to deliver the drug at an approximately constant rate for 7 days, and the absolute bioavailability of transdermal patches is ~60%. 81 , 82 In a healthy volunteer study with transdermal patches, steady‐state concentrations were achieved by the end of the second day. 81 , 82 Clonidine is highly lipophilic, and it can readily penetrate the blood‐brain barrier and enter extravascular space. 83 Its disposition has been described with 2‐compartment models, and the reported volume of distribution ranges from 2 to 5 L/kg. 79 , 80 Entero‐hepatic circulation was reported by Arndts et al., who observed a resurgence of plasma concentrations 15–20 min after a meal. 84 About 40%–60% of a clonidine dose is excreted unchanged in the urine while the remainder is metabolized to inactive metabolites primarily by CYP2D6. 83 The renal clearance is estimated to be ~ 7.6 L/h (127 ml/min) with significant variability, which exceeds the GFR in some subjects. 80 Dose‐dependent kinetics have been observed in some studies, where one study reported that the systemic clearance decreased from 24 to 13 L/h (5.8 to 3 ml/min/kg) when the intravenous dose administered increased from 75 to 275 μg. 85 Another study by the same group reported that as the intravenous dose increased from 1.27 to 3.36 μg/kg, clearance estimates decreased from 16.8 to 10.9 L/h (4–2.6 mL/min/kg). 79 Overall, the reported elimination half‐life of clonidine ranges from 6 to 13 h. 79 , 80 The elimination half‐life after removal of the transdermal patch is relatively longer, ranging from 14 to 26 h. 81
PKs in neonates
Age may affect the clearance of clonidine by impacting the development of GFR and CYP2D6 mediated metabolism. 86 CYP2D6 expression and activity develop rapidly in the first week of life, and age did not significantly affect CYP2D6 expression or activity levels among postnatal liver samples from subjects greater than 7 days of age. 87 In contract, standardized GFR rises steadily after an initial rapid increase, reaching adult values at 8–12 months of age. 88
Reported oral and transdermal dosing in critically ill infants and children ranged from 2–15 µg/kg/day divided every 6–8 h and from 2.3 to 20 µg/kg/day, respectively, but the PK data of oral or transdermal clonidine in this patient population is limited. 89 One PK study of oral clonidine in children (3–10 years) reported a Tmax of ~ 1 h and bioavailability of 55.4%. 90 Another PK study of transdermal clonidine in critically ill children (0.3–11 years) concluded that rate and extent of absorption was more predictable with whole patches compared with cut patches. 91
Using data from published PK studies in infants and children who received intravenous, rectal, or epidural clonidine (380 observations from 72 subjects, aged 0–14 years), Potts et al. 83 reported a population PK model incorporating allometric scaling of PK parameters and asymptotic exponential maturation of clearance based on PNA. A two‐compartment model was used for data fitting, and the normalized parameter estimates for 70‐kg adults were 14.6 L/h for clearance, 62.5 L for central volume, and 119 L for peripheral volume. These standardized values are close to reported values in adult studies. Clearance at birth standardized for weight was estimated to be 3.8 L/h/70 kg, and maturation half‐life was estimated to be 25.7 weeks. 83 The reduced clearance in the pediatric population was attributed to immaturity of elimination pathways. The authors concluded that this maturation half‐life reported from their model was consistent with the development timeline of the renal system. 83
Xie et al. 92 reported a population PK model based on 102 observations from 36 neonates with NOWS treated with oral clonidine (Table 1). A one‐compartment model was used. The apparent clearance was modeled with an allometric power model combined with a sigmoid maturation model based on PNA, and the apparent volume was modeled with an allometric power model. For the final parameter estimates, the absorption rate constant was 0.533/h, the apparent clearance, and the apparent volume standardized to 70 kg were 15.2 L/h and 391 L, respectively. 92 Based on this model, typical values of apparent clearance, apparent volume, and half‐life for neonates weighing 2.9 kg and aged 7.5 days were estimated to be 0.27 L/kg/h, 5.6 L/kg, and 14.2 h. Although the standardized value of clearance was close to previous reported values, the maturation half‐life was estimated to be 4.1 days, and the estimated time to reach 70% weight‐adjusted adult value of clearance was 1 month, compared with 9 months according to the findings by Potts et al. 83 , 92 It was postulated that this discrepancy is due to different age distributions in the two studies, as in the study by Potts et al., only a small number of subjects were neonates. 83
A summary of neonatal and adult PK parameters and clonidine elimination is presented in Figure 4.
FIGURE 4.
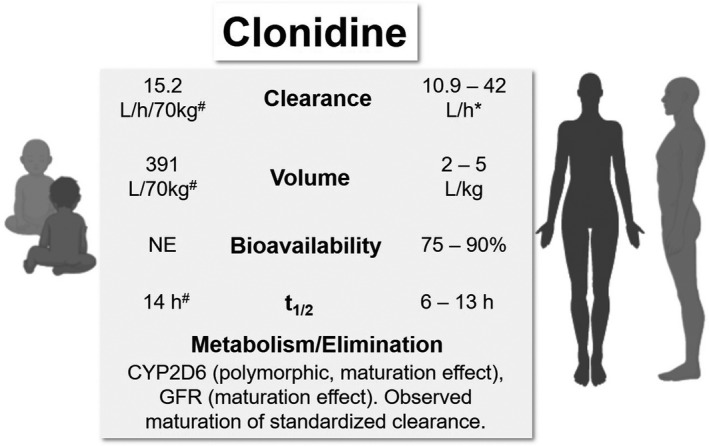
Comparative pharmacokinetic (PK) parameters and elimination of clonidine in neonates/infants and adults. *Dose‐dependent decrease in clearance. 85 #Apparent parameter estimates from a population PK model by Xie et al., half‐life estimated in a typical neonate. 92 GFR, glomerular filtration rate; NE, not estimated; t1/2, terminal half‐life
Phenobarbital
Pharmacology
Phenobarbital is a conventional anti‐epileptic drug that is also used as an adjunctive treatment in NOWS. Phenobarbital causes CNS depression through its action on GABAA receptors, and it also produces dose‐dependent respiratory depressant effect. 93 Through changing neuronal membrane conductance, especially of sodium and calcium, phenobarbital produces a wide range of complex neurochemical and neurophysiological effects. 94
PKs in adults
Phenobarbital is slowly absorbed but is highly bioavailable (~90%) after dosing. 95 Reported volume of distribution in adults is ~0.6 to 0.7 L/kg. 95 , 96 Phenobarbital binds primarily to albumin in the plasma, and the degree of protein binding is relatively low (~50%). 95 It is metabolized primarily by CYP2C9, and by CYP2C19 and CYP2E1 to a lesser extent. 95 , 97 About 20%–40% of the drug is excreted through the kidney, and renal excretion is dependent on urine flow and pH. 95 , 97 Clearance of phenobarbital can be affected by age, disease states, and certain concomitant drugs. 95 In adults, phenobarbital clearance is about 0.004–0.006 L/h/kg, with a half‐life of ranging from 70 to 140 h. 94 , 95 , 97 , 98
PKs in neonates
Although very high bioavailability is observed in adults, one study reported the bioavailability of oral phenobarbital in neonates and young infants to be ~48.9%. 99 Plasma binding in neonates is lower than in infants/children and adults, and conversely neonates have slightly higher volumes of distribution (~0.9–1 L/kg) than the latter. 95 , 100 In neonates, clearance is estimated to be 0.005 L/h/kg. 95 , 99 One study reported that whereas clearance was consistent in neonates who maintained on therapy for 1–4 weeks, the half‐life of phenobarbital decreased from 115 h at 1 week to 67 h at 4 weeks. 100 Due to its prolonged half‐life, the suggested dosing regimen of phenobarbital in neonates consists of a loading dose of 15–25 mg/kg, followed by an oral maintenance dose of 2–4 mg/kg/day. 95 Unlike the other therapeutic agents discussed in detail in this review, therapeutic drug monitoring (TDM) is commonly used in neonates for phenobarbital, due to its significant PK variability and narrow target range. 98 Its suggested reference range in plasma is 10–40 mg/L. 98
Although no population PK analysis has specifically been conducted for neonates with NOWS, a number of population PK studies have been conducted in pediatric and adult patients with other disease indications (e.g., epilepsy). A review of these studies is available elsewhere. 97 Briefly, a one‐compartment structure was used in all studies included (likely due to sparse sampling), and three most commonly identified predictors of clearance were weight, age, and concomitant anti‐epileptic drugs (phenytoin, carbamazepine, or valproic acid). 97
A summary of neonatal and adult PK parameters and phenobarbital elimination is presented in Figure 5.
FIGURE 5.
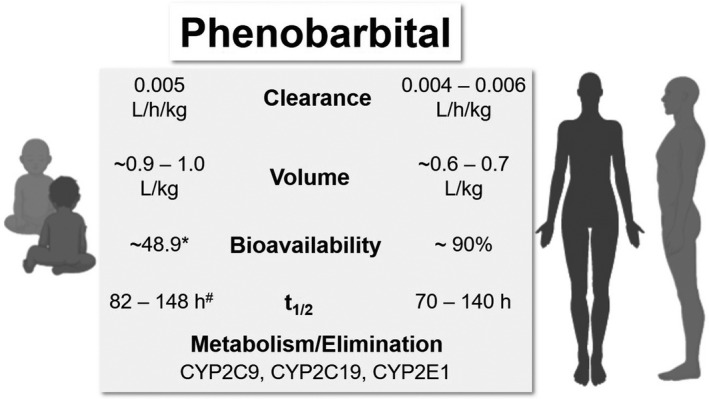
Comparative pharmacokinetic parameters and elimination of phenobarbital in neonates/infants and adults. *Bioavailability was reported to be lower than in adults. 99 #Half‐life estimates reported for term and preterm neonates. 94 t1/2, terminal half‐life
CURRENT DOSING AND PHARMACOMETRICS‐DRIVEN DOSING OPTIMIZATION IN NOWS
As only recently have the population PK‐PD of pharmacologic agents been investigated in NOWS, dosing regimens have been mostly empirical. 101 Reported initial starting doses of morphine are highly variable; the recommended dosing regimen in the 2012 update of AAP Guidelines lists an initial dose of 0.04 mg/kg every 3–4 h, dosing escalation in increments of 0.04 mg/kg, and a maximum dose of 0.2 mg/kg. 3 Weaning usually takes place after symptomatic stabilization for 48 h, and daily dose can be decreased by 10% to about 0.15 mg/kg/day, although there is a lack of consensus on specific dosing regimens. 102 For methadone, the AAP statement recommends a starting dose of 0.05–0.1 mg/kg every 6 h and dose escalation increments of 0.05 mg/kg per dose. 3 Similar to morphine, the dose can be decreased after stabilization for 24–48 h, and can be discontinued when the patient is stable at 0.01 mg/kg daily. 102 For clonidine, the recommended starting dose is 0.5–1 μg/kg every 3–6 h, and the maximum dose is 1 μg/kg every 3 h. 3 Clinical experience with buprenorphine is relatively limited compared with morphine and methadone, and specific dosing schemes of buprenorphine were reported in randomized trials or retrospective cohort studies. 103 , 104 , 105 , 106 In the initial randomized trial by Kraft et al., the dosing range of sublingual buprenorphine was 13.2–39.0 μg/kg/day in 3 divided doses; the uptitration rate was 20%, and weaning occurred at a rate of 10% until the dose was at or near the initial dose. 105 In subsequent trials by the same group, the dosing range and uptitration rate were increased to 15.9–60 μg/kg/day in 3 divided doses and 25%, respectively, due to observations of frequent use of maximum dose, low plasma levels, and lack of opioid toxicity in the initial study. 103 , 104 As the PKs and PDs of these agents become more and more well‐characterized with ongoing clinical studies, pharmacometric analyses should be used to determine the optimal dosing regimen to achieve early control of withdrawal symptoms and/or optimize the weaning scheme.
In adults, the primary goal of maintenance treatment for opioid dependence is to adequately suppress withdrawal signs and symptoms. Previous studies with methadone or buprenorphine have shown that withdrawal severity had a positive relationship with opioid receptor availability and a negative relationship with plasma opioid concentrations. 107 , 108 , 109 , 110 PK‐PD modeling has been conducted for buprenorphine and methadone using hyperbolic Emax and sigmoid Emax models to describe the relationship between opioid concentrations and opioid receptor occupancy or withdrawal severity, respectively. 107 , 108 , 109 , 111 In order to minimize interdosing withdrawal, one can use these modeling results to select doses that can achieve concentrations that exceed predetermined opioid receptor occupancy associated with suppression of withdrawal. For example, Greenwald et al. 63 demonstrated that 50%–60% of opioid receptor occupancy by buprenorphine is needed to achieve adequate withdrawal suppression, whereas 70% occupancy is associated with additional clinical benefit. Based on this finding, Nasser et al. 107 used a sigmoid Emax model to predict that a buprenorphine plasma concentration of 2 ng/ml was needed to obtain 70% opioid receptor occupancy.
Regarding the selection of the optimal dosing regimen in NOWS, the natural course of withdrawal severity in these neonates increases after birth and decreases after some time interval. Additionally, as the end goal is to achieve the gradual abstinence from opioids instead of an opioid maintenance therapy, it is therefore not appropriate to target a consistent level of opioid concentration and/or receptor occupancy in NOWS throughout the therapy. Instead, it is much more reasonable and straightforward to focus the dose selection effort on optimization of early dose exposure (i.e., the uptitration phase).
Xie et al. 92 conducted a simulation of steady‐state clonidine concentrations following 1, 1.5, or 2 µg/kg dosed every 4 h and used 0.8 and 1 ng/ml as target minimum clonidine concentrations. However, no PK‐PD assessment was done to link these target concentrations to PD end points in NOWS. Based on the simulation results, the authors proposed that 1.5 µg/kg every 4 h would be needed starting the second week of life to achieve the target concentrations (Table 2). 92 However, this simulation analysis appeared to have oversimplified the dosing scenario in NOWS and failed to recognize that the clonidine concentration should be a moving target depending on the uptitration or the weaning phase. For example, infants who achieve stabilization of withdrawal scores in their first week of life will likely be in the weaning stage in the second week. Therefore, it may not be clinically appropriate to propose a dose based on the postnatal age alone; instead, the phases of treatment also need to be taken into consideration.
TABLE 2.
Examples of proposed dosing scheme optimization in neonatal opioid withdrawal syndrome
| References | Agent | Dosing scheme before optimization | Proposed dosing scheme after optimization |
|---|---|---|---|
| Xie et al. 92 | Clonidine | 1 µg/kg q4 h | 1.5 µg/kg q4 h starting the second week of life |
|
Wiles et al. 60 |
Methadone |
Dosing scheme 1: 0.05 mg/kg q6 h × 4 0.04 mg/kg q6 h × 4 0.03 mg/kg q6 h × 4 0.02 mg/kg q6 h × 4 0.02 mg/kg q8 h × 3 0.02 mg/kg q12 h × 4 0.01 mg/kg q12 h × 4 0.01 mg/kg q24 h × 2 |
Dosing scheme 1: 0.1 mg/kg q6 h × 4 0.075 mg/kg q12 h × 2 0.05 mg/kg q12 h × 2 0.04 mg/kg q12 h × 2 0.03 mg/kg q12 h × 2 0.02 mg/kg q12 h × 2 0.01 mg/kg q12 h × 2 0.01 mg/kg q24 h × 1 |
|
Dosing scheme 2 (for patients’ refractory to step 1 of scheme 1): 0.05 mg/kg q6 h × 4 0.1 mg/kg q6 h × 4 0.075 mg/kg q6 h × 4 0.05 mg/kg q6 h × 4 0.04 mg/kg q6 h × 4 0.03 mg/kg q6 h × 4 0.02 mg/kg q6 h × 4 0.02 mg/kg q8 h × 3 0.02 mg/kg q12 h × 4 0.01 mg/kg q12 h × 4 0.01 mg/kg q24 h × 2 |
Dosing scheme 2: 0.1 mg/kg q4 h × 6 0.1 mg/kg q8 h × 3 0.1 mg/kg q12 h × 2 0.075 mg/kg q12 h × 2 0.05 mg/kg q12 h × 2 0.04 mg/kg q12 h × 2 0.03 mg/kg q12 h × 2 0.02 mg/kg q12 h × 2 0.01 mg/kg q12 h × 2 0.01 mg/kg q24 h × 1 |
||
| Moore et al. 74 | Buprenorphine | Initial dose: 5.3 µg/kg q8 h | Initial dose: 15 µg/kg q8 h |
In a methadone population PK analysis, Wiles et al. 60 used the modeling results to optimize the methadone dosing regimen used at their institutions. Their original methadone dosing strategy consisted of two dosing schemes (Table 2). Briefly, all patients were started on 0.05 mg/kg of methadone every 6 h. If the patients responded with decreased withdrawal scores over 24 h, they were continued on the remaining steps of dosing scheme 1; otherwise they were subsequently treated according to dosing scheme 2. 60 The authors first identified AUC values observed after the first 48 h (for dosing scheme 1) and 72 h (for dosing scheme 2) when the subjects achieved stabilization of withdrawal scores, respectively. 60 Then the authors simulated 2 new dosing schemes that could achieve these AUC targets at 24 h and 48 h, respectively. 60 Based on their simulation results, it was suggested that most patients could be started on 0.1 mg/kg every 6 h to achieve earlier control of symptoms compared to when original dosing schemes 1 and 2 were used (Table 2). 60 The optimized methadone dosing protocol was tested prospectively in a prepost cohort study by Hall et al. 112 In this study, 360 infants in total were included in the analysis (267 in the standard protocol and 93 in the revised protocol). The authors reported that compared with infants treated with the standard protocol, those treated with the revised dosing protocol had significantly shorter treatment duration (13.1 vs. 16.4 days) and length of stay (18.3 vs. 21.7 days), whereas total methadone dosage and use of adjunctive therapy did not differ in the two groups. This study was an elegant example that demonstrated the potential of using knowledge of clinical pharmacology to improve existing treatment protocols. Similarly, van Donge et al. 61 built a population PK model of methadone in preterm neonates with NOWS, and performed simulations to design dosing regimens needed to achieve the AUC target reported by Wiles et al. 60
The study by Moore et al. 74 provided further support for the dosing optimization effort guided by target exposure in the early phase of treatment. The authors reported that neonates with similar severity of NOWS were generally able to achieve stabilization of their symptoms (defined as when the average of previous 12 scores was <8 with the MOTHER NAS Scale) when they had similar AUC exposure to buprenorphine, and a negative relationship between the average plasma concentrations (Cave) and time to stabilization was observed. 74 Based on these observations, Moore et al. 74 performed a survival regression dividing the infants into quartiles of Cave with NOWS severity added as a covariate. As 0.8 ng/ml was the Cave in the highest concentration quartile from the survival analysis, it was treated as the concentration target and used to derive a more effective initial dose of 15 µg/kg every 8 h (Table 2). 74
Studies by Wiles et al. 60 and Moore et al. 74 provide strong support for optimizing dosing in the early phase of treatment based on targeted exposure, with the goal of achieving early symptom stabilization to shorten the length of treatment. Following the construction and evaluation of population PK models, the basic principle was to first establish target exposure metrics (e.g., AUC and Cave) that were associated with early symptom stabilization, and subsequently simulate dosing regimen to achieve the target exposure.
It is understandably more challenging to optimize dosing in the weaning phase as the natural disease remission must be taken into consideration, in addition to modeling available PK and PD data in treated patients. Weaning of the pharmacologic agent is usually done incrementally over time, which was one of the reasons that the length of hospital stay is prolonged in infants with NOWS. 3 , 9 However, there have been no clinical studies addressing whether long medication weans are necessary or effective. 113 Moore et al. 74 proposed that their population PK‐PD model of buprenorphine may serve as a starting point for a rational approach to weaning that allows changing of dosing frequency. Similarly, Mizuno et al. 75 developed a buprenorphine population PK‐PD model in NOWS. Both studies used differential equations to model the disease progression using withdrawal scores as the PD marker, and included the component of natural disease remission in the model building process. 74 , 75 Half‐maximal inhibitory concentration (IC50) estimates obtained from these two studies (0.509 ng/ml and 0.766 ng/ml, respectively) were reasonably close to the previously reported IC50 value in adults treated for opioid dependence (0.67 ng/ml). 74 , 75 , 107 However, substantial unexplained interpatient variability remained in these PK‐PD models, which undermines their predictive performance and their ability to facilitate model‐informed dosing optimization. One important reason is that withdrawal scores are generally highly variable because of the subjective nature of the scoring tools, which are also subjective to changes due to intentional nonpharmacologic treatment as well as unintentional environmental cues. On top of the limitations of current scoring systems, disease severity in NOWS is known to be heterogenous and can be affected by a variety of clinical factors (e.g., types of utero opioid exposure, concomitant exposure to other substances, and gestational age) as well as genetic factors. 114 , 115 For these reasons, we could foresee limitations of using PD modeling based on withdrawal scores to guide dosing frequency in the weaning phase. On the other hand, there have been an increasing number of clinical studies aiming to simplify weaning protocols empirically. For example, two published quality improvement projects sought to optimize nonpharmacologic therapy and reduce morphine dosing to allow faster weaning and as‐needed administration, and the authors reported significant decrease in morphine doses administered and length of hospital stay compared with the traditional approach. 116 , 117 Additionally, in a recent randomized clinical trial comparing the use of methadone versus morphine in 116 infants with NOWS, the authors found that allowing for more rapid weaning of the drug (from every 24–48 h to every 12 h) minimized the occurrence of adverse events. 16 Together, these clinical findings may indicate the need to shorten the lengthy weaning in clinical protocols for both efficiency and safety reasons.
FUTURE PERSPECTIVES
PK studies in neonates are, in general, very challenging to conduct and therefore population PK modeling has been a very powerful tool in analyzing pediatric PK data given the commonly observed data sparsity and imbalance. Using population PK models, significant patient‐specific factors impacting PK can be taken into consideration when performing dose regimen optimization aiming to achieve targeted exposure. In the case of phenobarbital, for which TDM is routinely performed, population PK with Bayesian forecasting is an emerging concept to provide for effective dose individualization. Specifically, significant patient‐specific factors identified in the population PK model can be utilized to first derive individual PK estimates for determining the initial dosing regimen; these individual estimates can later be improved by incorporating individual TDM measurements and allow for dose adjustment based on Bayesian forecasting. 118 This approach not only can result in more efficient individualized dosing, but also can provide flexibility in clinical sampling for TDM (e.g., non‐steady‐state concentrations). 97
When applying population PK models, one needs to keep in mind that the modeling results often need to be interpreted within the context of their specific study population. For example, two published population PK models of clonidine in pediatric patients incorporating PNA on weight‐standardized clearance yielded different prediction of clearance maturation trajectory, likely due to difference in age composition of the studied population. 83 , 92 Therefore, external evaluation of these models in the target population is needed when applying these models. There is also a need for more high‐quality PK studies in neonates to bolster existing data and better guide evidence‐based dosing in NOWS. Some trial design elements need to be taken into consideration before conducting PK studies in neonates, including sufficient sample size and reasonable selection of sampling schemes that would allow adequate estimation of PK parameters; it is therefore important to assess available PK information in pediatric and adult patients and knowledge about ontogeny of relevant organ and enzyme systems to better inform the trial design. 119 In addition, in neonate trials, patient burden and clinical feasibility also need to be considered when choosing the sampling scheme, and therefore opportunistic sampling (e.g., timing research samples with clinically indicated blood draws) and scavenged sampling using surplus blood drawn during routine care may be considered to improve study feasibility and reduce patient discomfort. 120 Additionally, dried matrix spot sampling and micro‐volume assays can be considered as ways to reduce the blood volume needed for sampling. 121
In the past decade, there has been a growing interest in the use of PBPK modeling. Compared with the empirical approach via population PK modeling, the mechanistic nature of PBPK modeling could facilitate the understanding of physiological mechanisms governing drug disposition. 122 Given the scarcity of pediatric PK data, PBPK modeling also has the advantage of leveraging both preclinical and adult data. 123 In PBPK models, drug‐specific parameters are generally separate from system‐specific parameters, and therefore they could be translated to a population with a different physiology by updating the system‐specific parameters for the target population, such as the neonates. 122 The workflow for developing a pediatric PBPK model starts from development and verification of an adult PBPK model, followed by development and evaluation of a pediatric model 123 ; this workflow was implemented in two example studies with methadone and buprenorphine mentioned earlier in the text. 62 , 76 The most important prerequisite for reliable translation to pediatrics is knowledge of drug‐specific ADME processes in adults and ontogeny of such processes 122 ; therefore, lack of qualified systems data and existing knowledge gap in the rapid physiological changes and maturation of organs/tissues related to drug disposition in neonates is expected to pose challenges to developing robust PBPK models in pediatrics. 119 , 124
Compared with PKs in pediatrics, there is in general limited information on how developmental changes and their interaction with disease impact PD, and therefore quantifying drug effect in pediatric patients is considered the biggest obstacle. 125 This is particularly true in the case of NOWS, where significant disease heterogeneity and the lack of reliable disease measures could potentially hinder the predictive performance of PK‐PD models. In pediatric trials, it is recommended to use functional biomarkers with sufficient accuracy and precision, and adequate sensitivity to distinguish longitudinal changes in disease progression from drug effect. 125 Therefore, in addition to the ongoing effort on comparing the efficacy of different therapeutic agents/treatment modalities, more research focus should also be placed on optimizing withdrawal scoring systems as well as identifying objective measurements of disease severity in NOWS.
Regardless of the specific modeling approaches, safety profiles should be considered when applying findings from these modeling efforts. Although adverse events are uncommon with commonly used therapeutic agents in NOWS, 126 it is recommended to test higher initial dosing in an inpatient setting and avoid implementing new protocols in an outpatient setting until more safety evidence becomes available. 60
CONCLUSIONS
In this paper, we summarize the management of NOWS, clinical pharmacology for primary treatment agents, and review available pharmacokinetic studies in NOWS. Pharmacologic treatment strategies in NOWS have been mostly empirical, and heterogeneity in reported dosing regimens makes it difficult to extrapolate some study results to broader patient populations. As the population PK of pharmacologic agents in NOWS become more well‐defined, PK‐PD modeling and simulation is becoming an increasingly powerful tool that informs the optimal dosing regimen design. 101 In most population PK studies, large interindividual variabilities have been observed in model parameters, even after accounting for the effects of weight and/or age. This is likely due to the presence of other patient‐specific factors that may affect the disposition and action of pharmacologic agents. For instance, genetic associations with disease severity and treatment outcomes have been increasingly reported in recent years, which have been reviewed elsewhere. 127 , 128 , 129 As knowledge of patient‐specific factors affecting treatment outcomes continues to accumulate, it is foreseeable that future modeling efforts will continue to improve by incorporating these factors, allowing for the personalized selection of treatment agents and strategies. The ultimate goal would be to establish optimized treatment protocols that allow the selection of evidence‐based treatment strategies built on patient‐specific factors.
CONFLICT OF INTEREST
The authors declared no competing interests for this work.
AUTHOR CONTRIBUTIONS
F.T. and M.L. wrote the manuscript; F.T., M.L, C.M.N and H.S.B. designed the research. All authors read, edited, and approved the final version of the manuscript.
Funding information
This work was supported by National Institutes of Health (NIH) grants R01DA043519 and R01DA043519‐02S1.
REFERENCES
- 1. Patrick SW, Barfield WD, Poindexter BB. Neonatal opioid withdrawal syndrome. Pediatrics. 2020;146(5):e2020029074. [DOI] [PubMed] [Google Scholar]
- 2. Edwards L, Brown LF. Nonpharmacologic management of neonatal abstinence syndrome: an integrative review. Neonatal Netw. 2016;35:305‐313. [DOI] [PubMed] [Google Scholar]
- 3. Hudak ML, Tan RC. Neonatal drug withdrawal. Pediatrics. 2012;129:e540‐e560. [DOI] [PubMed] [Google Scholar]
- 4. Patrick SW, Schumacher RE, Benneyworth BD, Krans EE, McAllister JM, Davis MM. Neonatal abstinence syndrome and associated health care expenditures: United States, 2000–2009. JAMA. 2012;307:1934‐1940. [DOI] [PubMed] [Google Scholar]
- 5. Winkelman TNA, Villapiano N, Kozhimannil KB, Davis MM, Patrick SW. Incidence and costs of neonatal abstinence syndrome among infants with Medicaid: 2004–2014. Pediatrics. 2018;141(4):e20173520. [DOI] [PMC free article] [PubMed] [Google Scholar]
- 6. Hall ES, Wexelblatt SL, Crowley M, et al. Implementation of a neonatal abstinence syndrome weaning protocol: a multicenter cohort study. Pediatrics. 2015;136:e803‐810. [DOI] [PMC free article] [PubMed] [Google Scholar]
- 7. Wachman EM, Schiff DM. Bringing attention to a need for a standardized treatment and weaning protocol for neonatal abstinence syndrome. Transl Pediatr. 2016;5:12‐15. [DOI] [PMC free article] [PubMed] [Google Scholar]
- 8. Grossman MR, Lipshaw MJ, Osborn RR, Berkwitt AK. A Novel approach to assessing infants with neonatal abstinence syndrome. Hospital Pediatrics. 2018;8:1‐6. [DOI] [PubMed] [Google Scholar]
- 9. Jansson LM, Patrick SW. Neonatal abstinence syndrome. Pediatr Clin North Am. 2019;66:353‐367. [DOI] [PMC free article] [PubMed] [Google Scholar]
- 10. Tolia VN, Patrick SW, Bennett MM, et al. Increasing incidence of the neonatal abstinence syndrome in U.S. neonatal ICUs. N Engl J Med. 2015;372:2118‐2126. [DOI] [PubMed] [Google Scholar]
- 11. Disher T, Gullickson C, Singh B, et al. Pharmacological treatments for neonatal abstinence syndrome: a systematic review and network meta‐analysis. JAMA Pediatr. 2019;173(3):234–243. [DOI] [PMC free article] [PubMed] [Google Scholar]
- 12. McPherson C, Inder T. Perinatal and neonatal use of sedation and analgesia. Semin Fetal Neonatal Med. 2017;22:314‐320. [DOI] [PubMed] [Google Scholar]
- 13. Marek E, Kraft WK. Ethanol pharmacokinetics in neonates and infants. Curr Ther Res Clin Exp. 2014;76:90‐97. [DOI] [PMC free article] [PubMed] [Google Scholar]
- 14. Committee on Drugs . Ethanol in liquid preparations intended for children. Pediatrics. 1984;73:405‐407. [PubMed] [Google Scholar]
- 15. European Medicines Agency . Committee for Medicinal Products for Human Use (CHMP): Reflection Paper: Formulations of choice for the paediatric population. https://www.ema.europa.eu/en/documents/scientific‐guideline/reflection‐paper‐formulations‐choice‐paediatric‐population_en.pdf. Accessed December 22, 2020.
- 16. Davis JM, Shenberger J, Terrin N, et al. Comparison of safety and efficacy of methadone vs morphine for treatment of neonatal abstinence syndrome: a randomized clinical trial. JAMA Pediatr. 2018;172:741‐748. [DOI] [PMC free article] [PubMed] [Google Scholar]
- 17. Anagnostis EA, Sadaka RE, Sailor LA, Moody DE, Dysart KC, Kraft WK. Formulation of buprenorphine for sublingual use in neonates. J Pediatr Pharmacol. 2011;16:281‐284. [DOI] [PMC free article] [PubMed] [Google Scholar]
- 18. Kraft WK, Stover MW, Davis JM. Neonatal abstinence syndrome: pharmacologic strategies for the mother and infant. Semin Perinatol. 2016;40:203‐212. [DOI] [PMC free article] [PubMed] [Google Scholar]
- 19. De Cock RF, Piana C, Krekels EH, Danhof M, Allegaert K, Knibbe CA. The role of population PK‐PD modelling in paediatric clinical research. Eur J Clin Pharmacol 2011;67(Suppl 1):5‐16. [DOI] [PMC free article] [PubMed] [Google Scholar]
- 20. Admiraal R, van Kesteren C, Boelens JJ, Bredius RGM, Tibboel D, Knibbe CAJ. Towards evidence‐based dosing regimens in children on the basis of population pharmacokinetic pharmacodynamic modelling. Arch Dis Child. 2014;99:267‐272. [DOI] [PubMed] [Google Scholar]
- 21. Anderson BJ, Holford NH. Mechanism‐based concepts of size and maturity in pharmacokinetics. Annu Rev Pharmacol Toxicol. 2008;48:303‐332. [DOI] [PubMed] [Google Scholar]
- 22. Wang J, Avant D, Green D, et al. A survey of neonatal pharmacokinetic and pharmacodynamic studies in pediatric drug development. Clin Pharmacol Ther. 2015;98:328‐335. [DOI] [PubMed] [Google Scholar]
- 23. Hines RN. Developmental expression of drug metabolizing enzymes: impact on disposition in neonates and young children. Int J Pharm. 2013;452:3‐7. [DOI] [PubMed] [Google Scholar]
- 24. Holford N, Heo YA, Anderson B. A pharmacokinetic standard for babies and adults. J Pharm Sci. 2013;102:2941‐2952. [DOI] [PubMed] [Google Scholar]
- 25. Anderson BJ, Holford NH. Tips and traps analyzing pediatric PK data. Paediatr Anaesth. 2011;21:222‐237. [DOI] [PubMed] [Google Scholar]
- 26. Rhodin MM, Anderson BJ, Peters AM, et al. Human renal function maturation: a quantitative description using weight and postmenstrual age. Pediatr Nephrol. 2009;24:67‐76. [DOI] [PubMed] [Google Scholar]
- 27. Pacifici GM. Metabolism and pharmacokinetics of morphine in neonates: a review. Clinics (Sao Paulo). 2016;71:474‐480. [DOI] [PMC free article] [PubMed] [Google Scholar]
- 28. Coffman BL, Rios GR, King CD, Tephly TR. Human UGT2B7 catalyzes morphine glucuronidation. Drug Metab Dispos. 1997;25:1‐4. [PubMed] [Google Scholar]
- 29. Penson RT, Joel SP, Bakhshi K, Clark SJ, Langford RM, Slevin ML. Randomized placebo‐controlled trial of the activity of the morphine glucuronides. Clin Pharmacol Ther. 2000;68:667‐676. [DOI] [PubMed] [Google Scholar]
- 30. Klimas R, Mikus G. Morphine‐6‐glucuronide is responsible for the analgesic effect after morphine administration: a quantitative review of morphine, morphine‐6‐glucuronide, and morphine‐3‐glucuronide. Br J Anaesth. 2014;113:935‐944. [DOI] [PubMed] [Google Scholar]
- 31. Sverrisdóttir E, Lund TM, Olesen AE, Drewes AM, Christrup LL, Kreilgaard M. A review of morphine and morphine‐6‐glucuronide's pharmacokinetic‐pharmacodynamic relationships in experimental and clinical pain. Eur J Pharm Sci. 2015;74:45‐62. [DOI] [PubMed] [Google Scholar]
- 32. Hoskin PJ, Hanks GW, Aherne GW, Chapman D, Littleton P, Filshie J. The bioavailability and pharmacokinetics of morphine after intravenous, oral and buccal administration in healthy volunteers. Br J Clin Pharmacol. 1989;27:499‐505. [DOI] [PMC free article] [PubMed] [Google Scholar]
- 33. Sawe J, Dahlstrom B, Paalzow L, Rane A. Morphine kinetics in cancer patients. Clin Pharmacol Ther. 1981;30:629‐635. [DOI] [PubMed] [Google Scholar]
- 34. Christrup LL. Morphine metabolites. Acta Anaesthesiol. Scand. 1997;41:116‐122. [DOI] [PubMed] [Google Scholar]
- 35. Osborne R, Joel S, Trew D, Slevin M. Morphine and metabolite behavior after different routes of morphine administration: demonstration of the importance of the active metabolite morphine‐6‐glucuronide. Clin Pharmacol Ther. 1990;47:12‐19. [DOI] [PubMed] [Google Scholar]
- 36. Gourlay GK, Cherry DA, Cousins MJ. A comparative study of the efficacy and pharmacokinetics of oral methadone and morphine in the treatment of severe pain in patients with cancer. Pain. 1986;25:297‐312. [DOI] [PubMed] [Google Scholar]
- 37. Osborne R, Joel S, Grebenik K, Trew D, Slevin M. The pharmacokinetics of morphine and morphine glucuronides in kidney failure. Clin Pharmacol Ther. 1993;54:158‐167. [DOI] [PubMed] [Google Scholar]
- 38. Kart T, Christrup LL, Rasmussen M. Recommended use of morphine in neonates, infants and children based on a literature review: part 1–Pharmacokinetics. Paediatr Anaesth. 1997;7:5‐11. [DOI] [PubMed] [Google Scholar]
- 39. McRorie TI, Lynn AM, Nespeca MK, Opheim KE, Slattery JT. The maturation of morphine clearance and metabolism. Am J Dis Child. 1992;146:972‐976. [DOI] [PubMed] [Google Scholar]
- 40. Lynn A, Nespeca MK, Bratton SL, Strauss SG, Shen DD. Clearance of morphine in postoperative infants during intravenous infusion: the influence of age and surgery. Anesth Analg. 1998;86:958‐963. [DOI] [PubMed] [Google Scholar]
- 41. Krekels EH, Tibboel D, Danhof M, Knibbe CA. Prediction of morphine clearance in the paediatric population: how accurate are the available pharmacokinetic models? Clin Pharmacokinet. 2012;51:695‐709. [DOI] [PubMed] [Google Scholar]
- 42. Holford NH, Ma SC, Anderson BJ. Prediction of morphine dose in humans. Paediatr Anaesth. 2012;22:209‐222. [DOI] [PubMed] [Google Scholar]
- 43. Krekels EH, van Hasselt JG, Tibboel D, Danhof M, Knibbe CA. Systematic evaluation of the descriptive and predictive performance of paediatric morphine population models. Pharm Res. 2011;28:797‐811. [DOI] [PMC free article] [PubMed] [Google Scholar]
- 44. Liu T, Lewis T, Gauda E, Gobburu J, Ivaturi V. Mechanistic population pharmacokinetics of morphine in neonates with abstinence syndrome after oral administration of diluted tincture of opium. J Clin Pharmacol. 2016;56:1009‐1018. [DOI] [PMC free article] [PubMed] [Google Scholar]
- 45. Lotsch J, Skarke C, Schmidt H, Liefhold J, Geisslinger G. Pharmacokinetic modeling to predict morphine and morphine‐6‐glucuronide plasma concentrations in healthy young volunteers. Clin Pharmacol Ther. 2002;72:151‐162. [DOI] [PubMed] [Google Scholar]
- 46. Liu T, Lewis TR, Moore JN, et al. Could postnatal age‐related uridine diphosphate glucuronic acid be a rate‐limiting factor in the metabolism of morphine during the first week of life? CPT Pharmacometrics Sys Pharmacol. 2019;8:469‐477. [DOI] [PMC free article] [PubMed] [Google Scholar]
- 47. Kreek MJ, Borg L, Ducat E, Ray B. Pharmacotherapy in the treatment of addiction: methadone. J Addict Dis. 2010;29:200‐216. [DOI] [PMC free article] [PubMed] [Google Scholar]
- 48. Foster DJ, Somogyi AA, White JM, Bochner F. Population pharmacokinetics of (R)‐, (S)‐ and rac‐methadone in methadone maintenance patients. Br J Clin Pharmacol. 2004;57:742‐755. [DOI] [PMC free article] [PubMed] [Google Scholar]
- 49. Olsen GD, Wendel HA, Livermore JO, et al. Clinical effects and pharmacokinetics of racemic methadone and its optical isomers. Clin Pharmacol Ther. 1977;21:147‐157. [DOI] [PubMed] [Google Scholar]
- 50. Davis AM, Inturrisi CE. d‐Methadone blocks morphine tolerance and N‐methyl‐D‐aspartate‐induced hyperalgesia. J Pharmacol Exp Ther. 1999;289:1048‐1053. [PubMed] [Google Scholar]
- 51. Ferrari A, Coccia CP, Bertolini A, Sternieri E. Methadone–metabolism, pharmacokinetics and interactions. Pharmacol Res. 2004;50:551‐559. [DOI] [PubMed] [Google Scholar]
- 52. Nilsson MI, Gronbladh L, Widerlov E, Anggard E. Pharmacokinetics of methadone in methadone maintenance treatment: characterization of therapeutic failures. Eur J Clin Pharmacol. 1983;25:497‐501. [DOI] [PubMed] [Google Scholar]
- 53. Ward RM, Drover DR, Hammer GB, et al. The pharmacokinetics of methadone and its metabolites in neonates, infants, and children. Paediatr Anaesth. 2014;24:591‐601. [DOI] [PMC free article] [PubMed] [Google Scholar]
- 54. Kharasch ED, Greenblatt DJ. Methadone disposition: implementing lessons learned. J Clin Pharmacol. 2019;59:1044‐1048. [DOI] [PMC free article] [PubMed] [Google Scholar]
- 55. Nilsson MI, Widerlov E, Meresaar U, Anggard E. Effect of urinary pH on the disposition of methadone in man. Eur J Clin Pharmacol. 1982;22:337‐342. [DOI] [PubMed] [Google Scholar]
- 56. de Vos JW, Geerlings PJ, van den Brink W, Ufkes JG, van Wilgenburg H. Pharmacokinetics of methadone and its primary metabolite in 20 opiate addicts. Eur J Clin Pharmacol. 1995;48:361‐366. [DOI] [PubMed] [Google Scholar]
- 57. Kharasch ED. Current concepts in methadone metabolism and transport. Clin Pharmacol Drug Dev. 2017;6:125‐134. [DOI] [PMC free article] [PubMed] [Google Scholar]
- 58. Croom EL, Stevens JC, Hines RN, Wallace AD, Hodgson E. Human hepatic CYP2B6 developmental expression: the impact of age and genotype. Biochem Pharmacol. 2009;78:184‐190. [DOI] [PubMed] [Google Scholar]
- 59. Pearce RE, Gaedigk R, Twist GP, et al. Developmental expression of CYP2B6: a comprehensive analysis of mRNA expression, protein content and bupropion hydroxylase activity and the impact of genetic variation. Drug Metab Dispos. 2016;44:948‐958. [DOI] [PMC free article] [PubMed] [Google Scholar]
- 60. Wiles JR, Isemann B, Mizuno T, et al. Pharmacokinetics of oral methadone in the treatment of neonatal abstinence syndrome: a pilot study. J Pediatr. 2015;167:1214‐1220.e1213. [DOI] [PMC free article] [PubMed] [Google Scholar]
- 61. van Donge T, Samiee‐Zafarghandy S, Pfister M, et al. Methadone dosing strategies in preterm neonates can be simplified. Br J Clin Pharmacol. 2019;85:1348‐1356. [DOI] [PMC free article] [PubMed] [Google Scholar]
- 62. McPhail BT, Emoto C, Fukuda T, et al. Utilizing pediatric physiologically based pharmacokinetic models to examine factors that contribute to methadone pharmacokinetic variability in neonatal abstinence syndrome patients. J Clin Pharmacol. 2020;60:453‐465. [DOI] [PMC free article] [PubMed] [Google Scholar]
- 63. Greenwald MK, Comer SD, Fiellin DA. Buprenorphine maintenance and mu‐opioid receptor availability in the treatment of opioid use disorder: implications for clinical use and policy. Drug Alcohol Depend. 2014;144:1‐11. [DOI] [PMC free article] [PubMed] [Google Scholar]
- 64. Elkader A, Sproule B. Buprenorphine: clinical pharmacokinetics in the treatment of opioid dependence. Clin Pharmacokinet. 2005;44:661‐680. [DOI] [PubMed] [Google Scholar]
- 65. Walsh SL, Preston KL, Stitzer ML, Cone EJ, Bigelow GE. Clinical pharmacology of buprenorphine: ceiling effects at high doses. Clin Pharmacol Ther. 1994;55:569‐580. [DOI] [PubMed] [Google Scholar]
- 66. Brown SM, Holtzman M, Kim T, Kharasch ED. Buprenorphine metabolites, buprenorphine‐3‐glucuronide and norbuprenorphine‐3‐glucuronide, are biologically active. Anesthesiology. 2011;115:1251‐1260. [DOI] [PMC free article] [PubMed] [Google Scholar]
- 67. Kuhlman JJ Jr, Lalani S, Magluilo J Jr, Levine B, Darwin WD. Human pharmacokinetics of intravenous, sublingual, and buccal buprenorphine. J Anal Toxicol. 1996;20:369‐378. [DOI] [PubMed] [Google Scholar]
- 68. Mendelson J, Upton RA, Everhart ET, Jacob P 3rd, Jones RT. Bioavailability of sublingual buprenorphine. J Clin Pharmacol. 1997;37:31‐37. [DOI] [PubMed] [Google Scholar]
- 69. Weinberg DS, Inturrisi CE, Reidenberg B, et al. Sublingual absorption of selected opioid analgesics. Clin Pharmacol Ther. 1988;44:335‐342. [DOI] [PubMed] [Google Scholar]
- 70. Iribarne C, Picart D, Dreano Y, Bail JP, Berthou F. Involvement of cytochrome P450 3A4 in N‐dealkylation of buprenorphine in human liver microsomes. Life Sci. 1997;60:1953‐1964. [DOI] [PubMed] [Google Scholar]
- 71. Barrett DA, Simpson J, Rutter N, Kurihara‐Bergstrom T, Shaw PN, Davis SS. The pharmacokinetics and physiological effects of buprenorphine infusion in premature neonates. Br J Clin Pharmacol. 1993;36:215‐219. [DOI] [PMC free article] [PubMed] [Google Scholar]
- 72. Hand CW, Baldwin D, Moore RA, Allen MC, McQuay HJ. Radioimmunoassay of buprenorphine with iodine label: analysis of buprenorphine and metabolites in human plasma. Ann Clin Biochem. 1986;23(Pt 1):47‐53. [DOI] [PubMed] [Google Scholar]
- 73. Ng CM, Dombrowsky E, Lin H, et al. Population pharmacokinetic model of sublingual buprenorphine in neonatal abstinence syndrome. Pharmacotherapy. 2015;35:670‐680. [DOI] [PMC free article] [PubMed] [Google Scholar]
- 74. Moore JN, Gastonguay MR, Ng CM, et al. The pharmacokinetics and pharmacodynamics of buprenorphine in neonatal abstinence syndrome. Clin Pharmacol Ther. 2018;103:1029‐1037. [DOI] [PMC free article] [PubMed] [Google Scholar]
- 75. Mizuno T, McPhail BT, Kamatkar S, et al. Physiologic indirect response modeling to describe buprenorphine pharmacodynamics in newborns treated for neonatal opioid withdrawal syndrome. Clin Pharmacokinet. 2021;60:249‐259. [DOI] [PMC free article] [PubMed] [Google Scholar]
- 76. Kovar L, Schräpel C, Selzer D, et al. Physiologically‐based pharmacokinetic (PBPK) modeling of buprenorphine in adults, children and preterm neonates. Pharmaceutics. 2020;12:578. [DOI] [PMC free article] [PubMed] [Google Scholar]
- 77. Nishina K, Mikawa K. Clonidine in paediatric anaesthesia. Curr Opin Anaesthesiol. 2002;15:309‐316. [DOI] [PubMed] [Google Scholar]
- 78. Nishina K, Mikawa K, Shiga M, Obara H. Clonidine in paediatric anaesthesia. Paediatr Anaesth. 1999;9:187‐202. [PubMed] [Google Scholar]
- 79. Frisk‐Holmberg M, Paalzow L, Edlund PO. Clonidine kinetics in man–evidence for dose dependency and changed pharmacokinetics during chronic therapy. Br J Clin Pharmacol. 1981;12:653‐658. [DOI] [PMC free article] [PubMed] [Google Scholar]
- 80. Davies DS, Wing LM, Reid JL, Neill E, Tippett P, Dollery CT. Pharmacokinetics and concentration‐effect relationships of intervenous and oral clonidine. Clin Pharmacol Ther. 1977;21:593‐601. [DOI] [PubMed] [Google Scholar]
- 81. Berner B, John VA. Pharmacokinetic characterisation of transdermal delivery systems. Clin Pharmacokinet. 1994;26:121‐134. [DOI] [PubMed] [Google Scholar]
- 82. Toon S, Hopkins KJ, Aarons L, Rowland M. Rate and extent of absorption of clonidine from a transdermal therapeutic system. J Pharm Pharmacol. 1989;41:17‐21. [DOI] [PubMed] [Google Scholar]
- 83. Potts AL, Larsson P, Eksborg S, Warman G, Lönnqvist P‐A, Anderson BJ. Clonidine disposition in children; a population analysis. Paediatr Anaesth. 2007;17:924‐933. [DOI] [PubMed] [Google Scholar]
- 84. Arndts D. New aspects of the clinical pharmacology of clonidine. Chest. 1983;83:397‐400. [DOI] [PubMed] [Google Scholar]
- 85. Frisk‐Holmberg M, Edlund PO, Paalzow L. Pharmacokinetics of clonidine and its relation to the hypotensive effect in patients. Br J Clin Pharmacol. 1978;6:227‐232. [DOI] [PMC free article] [PubMed] [Google Scholar]
- 86. Kleiber N, Mathôt RAA, Ahsman MJ, et al. Population pharmacokinetics of intravenous clonidine for sedation during paediatric extracorporeal membrane oxygenation and continuous venovenous hemofiltration. Br J Clin Pharmacol. 2017;83:1227‐1239. [DOI] [PMC free article] [PubMed] [Google Scholar]
- 87. Stevens JC, Marsh SA, Zaya MJ, et al. Developmental changes in human liver CYP2D6 expression. Drug Metab Dispos. 2008;36:1587‐1593. [DOI] [PubMed] [Google Scholar]
- 88. Kearns GL, Abdel‐Rahman SM, Alander SW, Blowey DL, Leeder JS, Kauffman RE. Developmental pharmacology–drug disposition, action, and therapy in infants and children. N Engl J Med. 2003;349:1157‐1167. [DOI] [PubMed] [Google Scholar]
- 89. Capino AC, Miller JL, Johnson PN. Clonidine for sedation and analgesia and withdrawal in critically ill infants and children. Pharmacotherapy. 2016;36:1290‐1299. [DOI] [PubMed] [Google Scholar]
- 90. Larsson P, Nordlinder A, Bergendahl HG, et al. Oral bioavailability of clonidine in children. Paediatr Anaesth. 2011;21:335‐340. [DOI] [PubMed] [Google Scholar]
- 91. Zuppa AF, Tejani SM, Cullen EJ Jr, Nadkarni VM. Plasma concentrations following application of whole versus cut transdermal clonidine patches to critically ill children. J Pediatric Pharmacol Therapeut. 2004;9:43‐48. [DOI] [PMC free article] [PubMed] [Google Scholar]
- 92. Xie HG, Cao YJ, Gauda EB. Clonidine clearance matures rapidly during the early postnatal period: a population pharmacokinetic analysis in newborns with neonatal abstinence syndrome. J Clin Pharmacol. 2011;51:502‐511. [DOI] [PubMed] [Google Scholar]
- 93. McNamara JO. Pharmacotherapy of the epilepsies. In: Goodman LS, eds. Goodman & Gilman's: The Pharmacological Basis of Therapeutics. 583‐607.Columbus, OH: McGraw‐Hill Educational Publishing; 2011. [Google Scholar]
- 94. Pacifici GM. Clinical pharmacology of phenobarbital in neonates: effects, metabolism and pharmacokinetics. Curr Pediatr Rev. 2016;12:48‐54. [DOI] [PubMed] [Google Scholar]
- 95. Tallian KB, Anderson DM. Clinical Pharmacokinetics, 6th edn. Bethesda, MD: American Society of Health‐System Pharmacists; 2017. [Google Scholar]
- 96. Hvidberg EF, Dam M. Clinical pharmacokinetics of anticonvulsants. Clin Pharmacokinet. 1976;1:161‐188. [DOI] [PubMed] [Google Scholar]
- 97. Methaneethorn J, Leelakanok N. Pharmacokinetic variability of phenobarbital: a systematic review of population pharmacokinetic analysis. Eur J Clin Pharmacol. 2021;77(3):291–309. [DOI] [PubMed] [Google Scholar]
- 98. Patsalos PN, Spencer EP, Berry DJ. Therapeutic drug monitoring of antiepileptic drugs in epilepsy: a 2018 update. Ther Drug Monit. 2018;40:526‐548. [DOI] [PubMed] [Google Scholar]
- 99. Marsot A, Brevaut‐Malaty V, Vialet R, Boulamery A, Bruguerolle B, Simon N. Pharmacokinetics and absolute bioavailability of phenobarbital in neonates and young infants, a population pharmacokinetic modelling approach. Fundam Clin Pharmacol. 2014;28:465‐471. [DOI] [PubMed] [Google Scholar]
- 100. Pitlick W, Painter M, Pippenger C. Phenobarbital pharmacokinetics in neonates. Clin Pharmacol Ther. 1978;23:346‐350. [DOI] [PubMed] [Google Scholar]
- 101. Kraft WK. Buprenorphine in neonatal abstinence syndrome. Clin Pharmacol Ther. 2018;103:112‐119. [DOI] [PMC free article] [PubMed] [Google Scholar]
- 102. Wiles JR, Isemann B, Ward LP, Vinks AA, Akinbi H. Current management of neonatal abstinence syndrome secondary to intrauterine opioid exposure. J Pediatr. 2014;165:440‐446. [DOI] [PMC free article] [PubMed] [Google Scholar]
- 103. Kraft WK, Adeniyi‐Jones SC, Chervoneva I, et al. Buprenorphine for the treatment of the neonatal abstinence syndrome. N Engl J Med. 2017;376:2341‐2348. [DOI] [PMC free article] [PubMed] [Google Scholar]
- 104. Kraft WK, Dysart K, Greenspan JS, Gibson E, Kaltenbach K, Ehrlich ME. Revised dose schema of sublingual buprenorphine in the treatment of the neonatal opioid abstinence syndrome. Addiction. 2011;106:574‐580. [DOI] [PMC free article] [PubMed] [Google Scholar]
- 105. Kraft WK, Gibson E, Dysart K, et al. Sublingual buprenorphine for treatment of neonatal abstinence syndrome: a randomized trial. Pediatrics. 2008;122:e601‐607. [DOI] [PMC free article] [PubMed] [Google Scholar]
- 106. Hall ES, Isemann BT, Wexelblatt SL, et al. A cohort comparison of buprenorphine versus methadone treatment for neonatal abstinence syndrome. J Pediatr. 2016;170:39‐44.e31. [DOI] [PubMed] [Google Scholar]
- 107. Nasser AF, Heidbreder C, Gomeni R, Fudala PJ, Zheng B, Greenwald MK. A population pharmacokinetic and pharmacodynamic modelling approach to support the clinical development of RBP‐6000, a new, subcutaneously injectable, long‐acting, sustained‐release formulation of buprenorphine, for the treatment of opioid dependence. Clin Pharmacokinet. 2014;53:813‐824. [DOI] [PubMed] [Google Scholar]
- 108. Shiran MR, Lennard MS, Iqbal MZ, et al. Pharmacokinetic‐pharmacodynamic modeling of mood and withdrawal symptoms in relation to plasma concentrations of methadone in patients undergoing methadone maintenance treatment. J Clin Psychopharmacol. 2012;32:666‐671. [DOI] [PubMed] [Google Scholar]
- 109. Dyer KR, Foster D, White J, Somogyi A, Menelaou A, Bochner F. Steady‐state pharmacokinetics and pharmacodynamics in methadone maintenance patients: comparison of those who do and do not experience withdrawal and concentration‐effect relationships. Clin Pharmacol Ther. 1999;65:685‐694. [DOI] [PubMed] [Google Scholar]
- 110. Mitchell TB, White JM, Somogyi AA, Bochner F. Comparative pharmacodynamics and pharmacokinetics of methadone and slow‐release oral morphine for maintenance treatment of opioid dependence. Drug Alcohol Depend. 2003;72:85‐94. [DOI] [PubMed] [Google Scholar]
- 111. Shiran MR, Hosseinzadeh R, Hamidikenari A, Zarghami M, Lamsehchi N, Rafati MR. Population pharmacokinetics and pharmacokinetic‐pharmacodynamic relationships of methadone in a sample of Iranian (mazandarani) opiate users undergoing methadone maintenance treatment. Iran J Psychiatry Behav Sci. 2011;5:53‐61. [PMC free article] [PubMed] [Google Scholar]
- 112. Hall ES, Meinzen‐Derr J, Wexelblatt SL. Cohort analysis of a pharmacokinetic‐modeled methadone weaning optimization for neonatal abstinence syndrome. J Pediatr. 2015;167:1221‐1225.e1221. [DOI] [PubMed] [Google Scholar]
- 113. Grossman M, Berkwitt A. Neonatal abstinence syndrome. Semin Perinatol. 2019;43:173‐186. [DOI] [PubMed] [Google Scholar]
- 114. Kraft WK, van den Anker JN. Pharmacologic management of the opioid neonatal abstinence syndrome. Pediatr Clin North Am. 2012;59:1147‐1165. [DOI] [PMC free article] [PubMed] [Google Scholar]
- 115. Reddy UM, Davis JM, Ren Z, Greene MF. Opioid use in pregnancy, neonatal abstinence syndrome, and childhood outcomes: executive summary of a Joint Workshop by the Eunice Kennedy Shriver National Institute of Child Health and Human Development, American College of Obstetricians and Gynecologists, American Academy of Pediatrics, Society for Maternal‐Fetal Medicine, Centers for Disease Control and Prevention, and the March of Dimes Foundation. Obstet Gynecol. 2017;130:10‐28. [DOI] [PMC free article] [PubMed] [Google Scholar]
- 116. Blount T, Painter A, Freeman E, Grossman M, Sutton AG. Reduction in length of stay and morphine use for nas with the "eat, sleep, console" method. Hospital Pediatrics. 2019;9(8):615‐623. [DOI] [PubMed] [Google Scholar]
- 117. Grossman MR, Berkwitt AK, Osborn RR, et al. An initiative to improve the quality of care of infants with neonatal abstinence syndrome. Pediatrics. 2017;139:e20163360. [DOI] [PMC free article] [PubMed] [Google Scholar]
- 118. Pauwels S, Allegaert K. Therapeutic drug monitoring in neonates. Arch Dis Child. 2016;101:377‐381. [DOI] [PubMed] [Google Scholar]
- 119. Food and Drug Administration, Center for Drug Evaluation and Research . General clinical pharmacology considerations for neonatal studies for drugs and biological products (draft guidance). 2019; https://www.fda.gov/regulatory-informaton/search-fda-guidance-documents/general-clinical-pharmacology-considerations-neonatal-studies-drugs-and-biological-products-guidance. Accessed December 22, 2020.
- 120. Stockmann C, Barrett JS, Roberts JK, Sherwin C. Use of modeling and simulation in the design and conduct of pediatric clinical trials and the optimization of individualized dosing regimens. CPT Pharmacometrics Systems Pharmacol. 2015;4:630‐640. [DOI] [PMC free article] [PubMed] [Google Scholar]
- 121. Balevic SJ, Cohen‐Wolkowiez M. Innovative study designs optimizing clinical pharmacology research in infants and children. J Clin Pharmacol. 2018;58(Suppl 10):S58‐S72. [DOI] [PMC free article] [PubMed] [Google Scholar]
- 122. Ince I, Solodenko J, Frechen S, et al. Predictive pediatric modeling and simulation using ontogeny information. J Clin Pharmacol. 2019;59(Suppl 1):S95‐S103. [DOI] [PubMed] [Google Scholar]
- 123. Yellepeddi V, Rower J, Liu X, Kumar S, Rashid J, Sherwin CMT. State‐of‐the‐art review on physiologically based pharmacokinetic modeling in pediatric drug development. Clin Pharmacokinet. 2019;58:1‐13. [DOI] [PubMed] [Google Scholar]
- 124. Howard M, Barber J, Alizai N, Rostami‐Hodjegan A. Dose adjustment in orphan disease populations: the quest to fulfill the requirements of physiologically based pharmacokinetics. Expert Opin Drug Metab Toxicol. 2018;14:1315‐1330. [DOI] [PubMed] [Google Scholar]
- 125. Corriol‐Rohou S, Cheung SYA. Industry perspective on using MIDD for pediatric studies requiring integration of ontogeny. J Clin Pharmacol. 2019;59(Suppl 1):S112‐S119. [DOI] [PubMed] [Google Scholar]
- 126. Mangat AK, Schmolzer GM, Kraft WK. Pharmacological and non‐pharmacological treatments for the Neonatal Abstinence Syndrome (NAS). Semin Fetal Neonatal Med. 2019;24:133‐141. [DOI] [PMC free article] [PubMed] [Google Scholar]
- 127. Wachman EM, Hayes MJ, Lester BM, et al. Epigenetic variation in the mu‐opioid receptor gene in infants with neonatal abstinence syndrome. J Pediatr. 2014;165:472‐478. [DOI] [PMC free article] [PubMed] [Google Scholar]
- 128. Wachman EM, Hayes MJ, Brown MS, et al. Association of OPRM1 and COMT single‐nucleotide polymorphisms with hospital length of stay and treatment of neonatal abstinence syndrome. JAMA. 2013;309:1821‐1827. [DOI] [PMC free article] [PubMed] [Google Scholar]
- 129. Mactier H, McLaughlin P, Gillis C, Osselton MD. Variations in infant CYP2B6 genotype associated with the need for pharmacological treatment for neonatal abstinence syndrome in infants of methadone‐maintained opioid‐dependent mothers. Am J Perinatol. 2017;34:918‐921. [DOI] [PubMed] [Google Scholar]