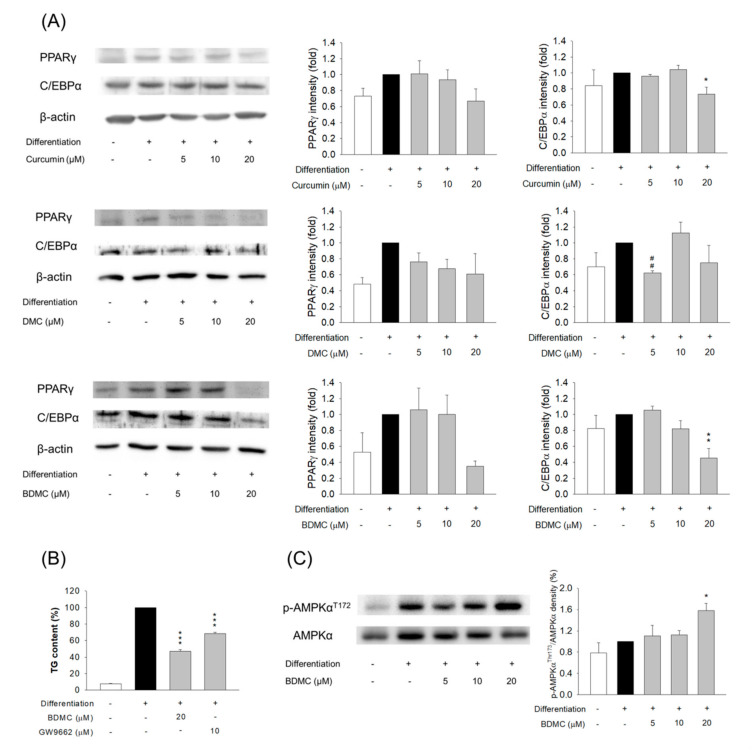
Figure 4.
The effect of curcuminoids on transcription factors of 3T3-L1 cells. (A) The protein expression of PPARγ and C/EBPα after treatment of curcuminoids at 0−20 μM; (B) the intracellular TG content of 3T3-L1 cells after the treatment of BDMC and/or GW9662; and (C) the protein expression and AMPKα after treatment of BDMC at 0−20 μM. All data are presented as the mean of three experiments ± S.E.M. *** p < 0.001; ** p < 0.01; * p < 0.05 as compared to the differentiated control group. ## p < 0.01 as compared to the curcumin-treated group at the same dose.

