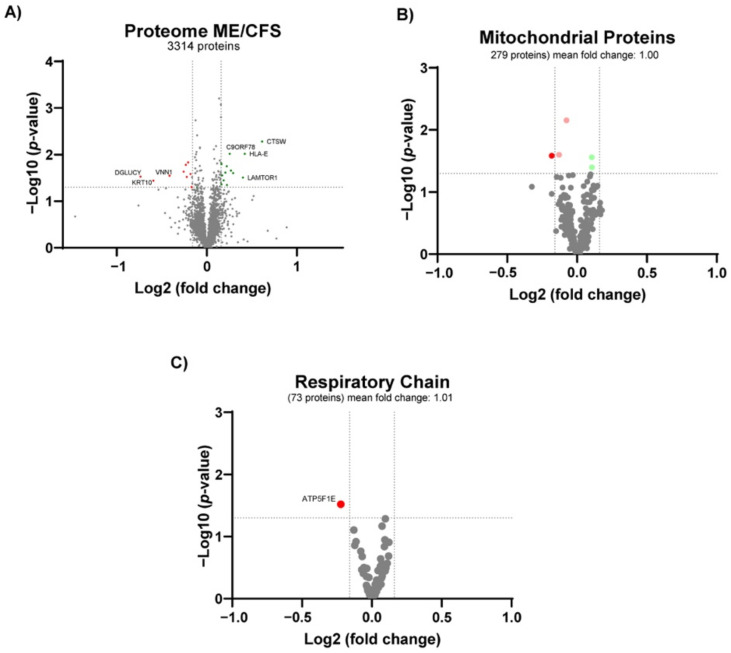
Figure 3.
Proteomics profile of PBMCs from ME/CFS patients and healthy individuals as controls. Volcano plot of (A) all the quantified proteins, (B) the mitochondrial proteins and (C) respiratory chain proteins. n = 10 (4 controls, 6 ME/CFS patients). Red dots denote significantly lower proteins. Green dots denote significantly higher proteins. Light red and green dots denote significantly regulated proteins with a fold-change below the cut-off.

