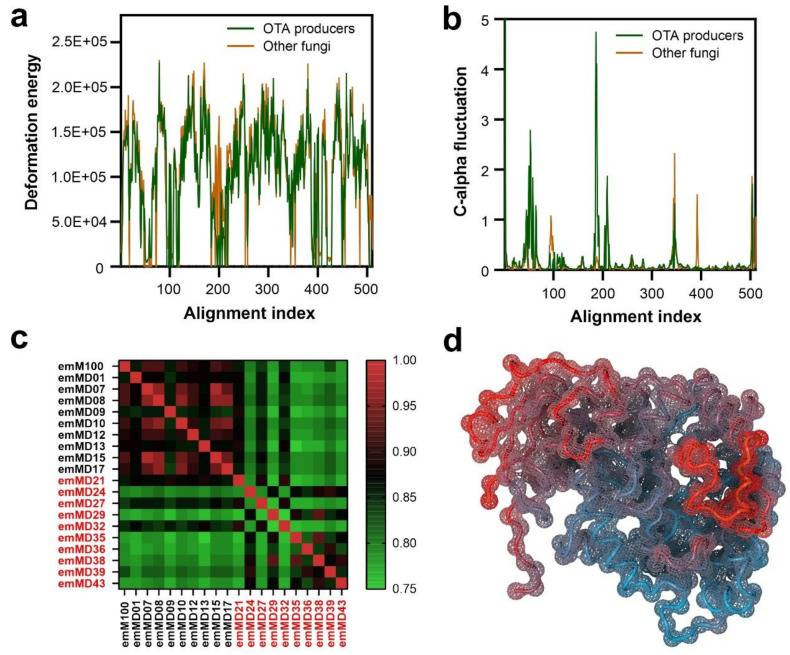
Figure 6.
Normal mode analysis of a subset of ochratoxin-like enzymes applying the webNM@ platform [49]. (a) Average of the deformation energy calculated along the protein sequences in the ochratoxin-like enzymes distinguishing ochratoxin producers and non-producers. (b) C-alpha space fluctuations along the normal mode simulations, showing the average movements in the ochratoxin-like models. (c) Bhattacharya Coefficient (BC) scoring matrix of the selected subset of ochratoxinase-like enzymes. The enzymes models are identified by their internal codes (Supplementary Materials Table S1). Enzyme names belonging to ochratoxin-producing fungi are colored in red. (d) C-alpha space fluctuations calculated by normal mode analysis and represented over the structure of the A. niger ochratoxinase (PDB code: 4C5Y). The color of the protein trace represents the relative fluctuations of the C-alpha along the simulation following a gradient (blue to red, from more static to more fluctuating regions of the protein).

