

Abstract
The plant microbiome supports plant growth, fitness, and resistance against climate change. Trifolium pratense (red clover), an important forage legume crop, positively contributes to ecosystem sustainability. However, T. pratense is known to have limited adaptive ability toward climate change. Here, the T. pratense microbiomes (including both bacteria and fungi) of the rhizosphere and the root, shoot, and flower endospheres were comparatively examined using metabarcoding in a field located in Central Germany that mimics the climate conditions projected for the next 50–70 years in comparison with the current climate conditions. Additionally, the ecological functions and metabolic genes of the microbial communities colonizing each plant compartment were predicted using FUNGuild, FAPROTAX, and Tax4Fun annotation tools. Our results showed that the individual plant compartments were colonized by specific microbes. The bacterial and fungal community compositions of the belowground plant compartments did not vary under future climate conditions. However, future climate conditions slightly altered the relative abundances of specific fungal classes of the aboveground compartments. We predicted several microbial functional genes of the T. pratense microbiome involved in plant growth processes, such as biofertilization (nitrogen fixation, phosphorus solubilization, and siderophore biosynthesis) and biostimulation (phytohormone and auxin production). Our findings indicated that T. pratense microbiomes show a degree of resilience to future climate changes. Additionally, microbes inhabiting T. pratense may not only contribute to plant growth promotion but also to ecosystem sustainability.
Keywords: climate change, plant endosphere, Illumina Miseq, microbiome, rhizosphere, Trifolium pratense
The Trifolium pratense microbiomes (including both bacteria and fungi) of the rhizosphere and the root, shoot, and flower endospheres were comparatively examined using metabarcoding in a field located in Central Germany that mimics the climate conditions projected for the next 50–70 years in comparison with the current climate conditions. Our findings indicated that T. pratense microbiomes show a degree of resilience to future climate changes. Additionally, microorganisms inhabiting T. pratense may not only contribute to plant growth promotion but also to ecosystem sustainability.

1. INTRODUCTION
Forage legume crops with high protein and fiber contents are a major livestock feed source. The integration of forage legumes into the cropping systems can have beneficial effects on soil health and fertility, as well as on controlling weeds, insect pests, and pathogens (Sheaffer & Seguin, 2008). Trifolium pratense L. (red clover), a forage legume crop in the temperate regions, is a key component of sustainable livestock farming systems (De Vega et al., 2015). In the 16th century, T. pratense was used as a protein‐rich fodder in livestock agriculture. T. pratense was further used as a “nitrogen‐assimilating crop” in the 19th century when the soil nitrogen content depleted in Europe (Kjærgaard, 2003; McKenna et al., 2018). Red clover efficiently fixes atmospheric nitrogen (N) due to its symbiotic association with N‐fixing bacteria (Fustec et al., 2010). Additionally, the use of red clover increases soil fertility through the rhizodeposition of plant exudates containing soluble N compounds (Paynel et al., 2008). The decomposition of red clover residues results in the release of 40–70% of the total plant N into the soil within 5–10 weeks of decomposition (Lupwayi et al., 2006). Therefore, red clover is considered a “fertility‐building crop” (McKenna et al., 2018). The incorporation of red clover in agricultural crop rotations is an alternative and sustainable method of introducing N into low‐input agricultural practices. In addition to its application in agriculture, red clover has pharmacological applications as it exhibits oestrogenic, antispasmodic, and expectorant properties (Coon et al., 2007; Leung & Foster, 1996; Lin et al., 2000).
The events associated with climate change, including increased global temperatures and altered precipitation patterns, adversely affect plant health and productivity across different agroecosystems (Franklin et al., 2016; Schmidhuber & Tubiello, 2007). Recent studies have suggested that climate change has led to shifts in plant phenology, species distribution, and population dynamics and has contributed to the emergence of new potential fungal plant pathogens (Delgado‐Baquerizo et al., 2020; Franklin et al., 2016; Wahdan et al., 2020). T. pratense is adapted to a wide range of soil types and pH levels in temperate regions. However, it has a limited capacity to adapt to increased temperatures and extreme drought events (Hanna et al., 2018). Previous studies have reported that red clover is resistant to a maximum temperature of 25°C but that prolonged exposure to 28°C decreases the crop yield (Hanna et al., 2018). Additionally, red clover exhibited some resistance to moderate drought, however, extreme drought highly impaired the yield that did not recover after a post‐drought period (Hofer et al., 2016). Various studies have examined the cascading effects of climate change on T. pratense performance. However, the response of the T. pratense microbiome to climate changes has not been examined.
The plant holobiont, which comprises the host plant and its endocellular and extracellular microbiome (Rosenberg & Zilber‐Rosenberg, 2018), is considered a biological entity associated with stability, adaptation, and evolution, and not as individual biotic components (Vandenkoornhuyse et al., 2015). The host plant traits, such as resistance against pathogens, immune system priming, and growth, are dependent on the host's microbiome composition (Hartmann et al., 2007; Mendes et al., 2011; Ritpitakphong et al., 2016; Trivedi et al., 2020). In contrast to the highly conserved plant genome, the microbiome genome is prone to rapid genetic changes (Rosenberg & Zilber‐Rosenberg, 2018). Therefore, the plasticity of the microbiome to adapt to environmental changes enables rapid host adaptation (Voolstra & Ziegler, 2020). Microbiome plasticity is a broad phenomenon that includes a dynamic reconstruction of microbiome composition by increasing and/or decreasing the abundance of specific microbes and/or by the colonization of novel microbes that facilitate the host adaptation to external stress (Bulgarelli et al., 2013; Haney et al., 2015). However, enhanced microbiome plasticity increases the risk of pathogen invasion and undesirable microbes enrichment with a concomitant loss of beneficial ones (Voolstra & Ziegler, 2020). Beneficial microbiome plasticity depends on the dynamics within useful microbes that maintain high levels of functional redundancy in the original microbial communities. In another scenario, the microbiome may respond to environmental changes by exhibiting resistance or by maintaining a constant community structure with a high potential to adapt to external stress (Allison & Martiny, 2008). The plasticity or resistance of host‐associated microbiomes may contribute to host adaptation. Nevertheless, the adaptive strategies employed by the T. pratense microbiome in response to future climate conditions are so far unclear.
Within the host plant, microbial communities vary between the belowground and aboveground plant compartments, which are distinct ecological niches with variations in nutrients and oxygen availability in different tissue types (Beckers et al., 2017; Cregger et al., 2018; Pangesti et al., 2020; Zarraonaindia et al., 2015). Microorganisms reach their host to form the indigenous microbiome through the following two pathways: vertical transmission via seeds and horizontal transmission from the surrounding atmosphere, rhizosphere, and bulk soils (Trivedi et al., 2020). The rhizosphere is the soil zone around the roots in which microbes are impacted by the presence of plant roots (Vandenkoornhuyse et al., 2015). The density of microbial populations in the rhizosphere is higher than that in the bulk soils; therefore, it is considered a hot spot for plant‐microbiome interaction (Berendsen et al., 2012). The microbiome composition of the root endosphere depends on the ability of microbes to invade root tissues from the surrounding rhizosphere and rhizoplane (Pangesti et al., 2020; Vandenkoornhuyse et al., 2015). Soil is also a microbial reservoir for the aboveground plant compartments as some endophytic microbes (microbes that colonize the internal plant tissue showing no infection or negative effect on their host; Schulz and Boyle (2006)) of the aboveground plant compartments/niches are recruited from soil (Zarraonaindia et al., 2015). Additionally, the aboveground endophytic microbiomes are derived from microbes that first colonize the leaf and flower surfaces as epiphytes (Vandenkoornhuyse et al., 2015) and can passively or actively invade the plant tissues (De Vrieze et al., 2018).
The ability of the host plants to utilize beneficial microbes, such as plant growth‐promoting bacteria (PGPB) determines their response to the environmental and climate changes through direct and indirect mechanisms. These mechanisms include nutrient solubilization, biological nitrogen fixation, and the production of plant growth regulators, organic acids, and volatile organic compounds (Ahkami et al., 2017). Therefore, the identification of the T. pratense microbiome functional profile is critical for developing new strategies to enhance plant health, growth, and resistance against future climate changes.
This study aimed to investigate the responses of the bacteriome and mycobiome (i.e., bacterial and fungal microbiomes) associated with four ecological niches/compartments of T. pratense and to evaluate their potential ecological and metabolic functions in responding to future climate conditions. The rhizosphere and the endospheres of the root, shoot system (leaves and stems), and flower were examined. The study was performed at grassland plots of the Global Change Experimental Facility (GCEF) established in central Germany (Schädler et al., 2019). GCEF is one of the largest experimental platforms designed to investigate the effect of a future climate scenario mimicking the prediction for the next 50–70 years on ecosystem processes in plots under different land‐uses (Schädler et al., 2019). The sampling was performed 4 years after starting the climate manipulation in summer as it represents the critical season in which the future climate scenario is expected to have the highest impacts on soil functions (Yin et al., 2019). The period of 4 years after the onset of the experiment was sufficient for T. pratense generation and their microbiome to be affected by climate manipulation and adapt through the vertical and horizontal transmission of new microorganisms. MiSeq Illumina sequencing of the 16S rRNA gene (V5–V7 region) and the nuclear ribosomal internal transcribed spacer region 2 (ITS2) was performed to characterize the bacterial and fungal microbiomes, respectively. We hypothesized that T. pratense‐associated microbiomes would be shaped by the influence of both biotic (plant compartments/ecological niches) and abiotic (climate change) factors that varied in their relative importance.
2. MATERIALS AND METHODS
2.1. Study site and experimental design
The study was conducted in GCEF at the field research station of the Helmholtz Centre for Environmental Research in Bad Lauchstädt, Saxony‐Anhalt, Germany (51_22060 N, 11_50060 E, 118 m a.s.l.). The area is characterized by a subcontinental climate (mean temperature, 8.9°C and mean annual rainfall, 498 mm for the period 1896–2013; mean temperature, 9.8°C and mean annual rainfall, 516 mm for the period 1995–2014). During the study period (2018), the mean temperature was 10.8°C with an annual rainfall of 254 mm. The study field comprised the Haplic Chernozem soil, which was characterized by a high content of organic carbon till a depth of more than 40 cm and a high water‐holding capacity (Altermann et al., 2005). The GCEF field infrastructure (Figure A1) was designed to comparatively investigate the consequences of future climate and current climate conditions on ecosystem processes in different land types (Schädler et al., 2019). Furthermore, the GCEF comprises 50 field plots (400 m2 each), which were equally divided and subjected to the current and future climate conditions. Future climate condition is a consensus scenario across three models (COSMO‐CLM (Rockel et al., 2008), REMO (Jacob & Podzun, 1997), and RCAO (Döscher et al., 2002)) of climate change in Central Germany for the years 2070–2100. Hence, future climate plots (Figure A2) are equipped with mobile shelters and side panels, as well as an irrigation system. The roofs are controlled by a rain sensor. The continuous adjustment of irrigation or roof closing has decreased the precipitation by approximately 20% in the summer months and increased the precipitation by approximately 10% in spring and autumn. To simulate the increase in temperature, the standard method “passive night‐time warming” was used. The shelters and panels were automatically closed from sundown to sunrise to increase the mean daily temperature by approximately 0.55°C accompanied by a stronger increase in minimum temperatures (up to 1.14°C on average). Current climate plots are equipped with the same steel constructions (but without shelters, panels, and irrigation systems) to mimic the possible microclimatic effects of the experimental setup. The resulting changes in climate conditions, due to climate manipulation, before and during the study period are shown in Figure A3. For more details on the field station design, see Schädler et al. (2019). The experiment was performed in the extensively used meadow plots subjected to future climate conditions (5 plots) in comparison with the plots of current climate conditions (5 plots). The vegetation comprises 56 plant species that were chosen from multiple regional natural source populations located in Central Germany. Each source population is genetically different. T. pratense species is represented by 2 gene pools (Madaj et al., 2020). The vegetation was mowed twice a year without the application of herbicides or fertilizers. The experiment was conducted in mid‐July 2018 (summer), which corresponded with the highest effect of future climate conditions on soil ecosystem function (plant residue decomposition) at the GCEF in other years (Yin et al., 2019).
2.2. Sample collection and compartmentalization of the belowground and aboveground plant compartments
Each climate scenario was represented by five plots. At each plot, three healthy T. pratense L. (red clover) plants were randomly selected and their two belowground compartments (rhizosphere soil and root) and two aboveground compartments (leaf/stem and flower) were examined. In total, 30 plants (3 plants × 10 plots) were sampled, the two halves of which are representing current and future climate scenarios. For each plant, the bulk soil was removed by vigorous shaking for 10 min. The adhering rhizosphere soil was collected by vortexing the roots for 10 min in a sterile polymerase chain reaction (PCR) water (Barillot et al., 2012). The root was separated from the aboveground compartments and surface‐sterilized to collect the endophytes. Briefly, the root was washed under running distilled water, followed by three washes with 0.1% Tween 20, a 3 min wash with 70% ethanol, and five washes with sterilized distilled water. Similarly, the endophytes were obtained from the aboveground compartments after surface sterilization. The leaves and stems were considered as one compartment, while the flowers were considered a separate compartment. The two compartments were washed twice with 0.1% Tween 20, followed by five washes with sterilized distilled water. The samples from the three plants of each plot were pooled into a single composite sample. The entire sterilized compartments (root, leaves/stems, and flowers) were crushed using liquid nitrogen and the resulting powder was used for DNA extraction.
2.3. DNA extraction, amplicon library preparation, and Illumina MiSeq sequencing
The DNA extraction was carried out using 250 mg of each plant compartment and rhizosphere sample using the DNeasy PowerSoil kit™ (Qiagen Inc.), following the manufacturer's instructions and subjected to PCR. The V5–V7 region of the bacterial 16S rRNA was amplified using the following primers: BAC799F forward (5′‐AACMGGATTAGATACCCKG‐3′) (Chelius & Triplett, 2001) and BAC1193R reverse (5′‐ACGTCATCCCCACCTTCC‐3′) (Bodenhausen et al., 2013). These bacterial primer pairs were chosen because they do not amplify the chloroplast DNA (Beckers et al., 2016). The ITS2 region of fungi was amplified using the following primers: fITS7F forward (5′‐GTGARTCATCGAATCTTTG‐3′) (White et al., 1990) and ITS4 reverse (5′‐TCCTC CGCTTATTGATATGC‐3′) (White et al., 1990). The amplification was performed in a two‐step process. The forward primer of the first PCR was constructed using the Illumina i5 sequencing primer (5′‐TCGTCGGCAGCGTCAGATGTG TATAAGA GACAG‐3′) and a specific forward primer. The reverse primer was constructed using the Illumina i7 sequencing primer (5′‐GTCTCGTGGG CTCGGAGATGTGTATAAGAGACAG‐3′) and the specific reverse primer. The amplification was performed in a 25 μl reaction volume comprising 1 μl (5 μM) of each primer and 1 μl of the template using the Qiagen HotStar hi‐fidelity polymerase kit (Qiagen Inc.). PCR was performed using an ABI Veriti thermocycler (Applied Biosystems). The PCR conditions were as follows: 95°C for 5 min, followed by 35 cycles of 94°C for 15 s, 54°C for 60 s, and 72°C for 1 min and one step of 72°C for 10 min and 4°C hold. The amplicons from the first PCR, whose concentrations were quantitatively determined, were used for the second PCR. In the second PCR, dual indices were attached using the Nextera XT index kit. The conditions for the second PCR were the same as those used for the first PCR, except for the amplification cycles (10 amplification cycles used in the second PCR). The amplicons were visualized using eGels (Life Technologies), following the manufacturer's instructions. Equimolar concentrations of the products were pooled, and the size of each pool was selected in two rounds using Agencourt AMPure XP (BeckmanCoulter) in a 0.75 ratio for both rounds. The size‐selected pools were then quantified using a Quibit 2.0 fluorometer (Life Technologies). Sequencing was performed using MiSeq (Illumina, Inc) with a 2 × 300 bp paired‐end strategy, following the manufacturer's instructions.
2.4. Processing of amplicon data
The primer sequences were trimmed from the demultiplexed raw reads using cutadapt (Martin, 2011). The pair‐end raw reads of bacterial and fungal datasets were merged using the simple Bayesian algorithm with a threshold of 0.6 and a minimum overlap of 20 nucleotides as implemented in PANDAseq (Masella et al., 2012). All the assembled reads were filtered for high‐quality sequence reads (minimum sequence length, 350 and 120 nucleotides for bacteria and fungi, respectively; maximum sequence length, 500 and 580 nucleotides for bacteria and fungi, respectively; minimum average Phred score of 25; maximum length of 20 homopolymers in the sequence and without ambiguous nucleotides). Potential chimeras were removed using UCHIME (Edgar et al., 2011) as implemented in MOTHUR (Schloss et al., 2009). The high‐quality reads were clustered into operational taxonomic units (OTUs) using cd‐hit‐est 4.6.2 (Fu et al., 2012) at a threshold of 97% pairwise similarity. The bacterial 16S rRNA OTU representative sequences were assigned against the SILVA v132 reference sequence database (Quast et al., 2013) to obtain the respective OTU tables. Fungal ITS representative sequences were assigned against the UNITE v7 sequence database (Kõljalg et al., 2013) using the Bayesian classifier as implemented in MOTHUR (Schloss et al., 2009). Singleton and doubleton OTUs originating from sequencing errors were removed from the datasets. The sequences that were classified as “Cyanobacteria,” “Chloroplast,” or “Mitochondria” and those that were not classified at the kingdom level were removed from the bacterial dataset. The ecological and metabolic functions of bacterial OTUs were predicted using FAPROTAX (Louca et al., 2016) and the functional annotation tool of prokaryotic taxa v.1.1, whereas those of fungal OTUs were predicted using FUNGuild (Nguyen et al., 2016). Additionally, the Tax4Fun (Aßhauer et al., 2015) R package, which employs 16S rRNA gene‐based taxonomic information, and the Kyoto Encyclopaedia of Genes and Genomes (KEGG) database were used to predict the metabolic functional attributes of bacterial communities in the rhizosphere and endosphere of T. pratense. Tax4Fun converted the SILVA‐labeled OTUs into prokaryotic KEGG organisms and normalized these predictions using the 16S rRNA copy number (obtained from the National Center for Biotechnology Information genome annotations).
2.5. Physicochemical analyses of the rhizosphere soil
The rhizosphere soil samples (100–200 g wet weight) from each plot were dried and sieved. The pH of the rhizosphere soil was measured using WTW Multi 3510 IDS. The rhizosphere soil was subjected to dry combustion at 1000°C to determine the total carbon (TC) and total nitrogen (TN) concentrations using a CHNS‐Elemental Analyzer (Elementar Analysensysteme GmbH), following the manufacturer's instructions. Soil carbon/nitrogen (C/N) stoichiometry was calculated based on TC and TN. Available soil phosphorus was extracted and measured according to the Bray 1 method (Gutiérrez Boem et al., 2011). Cations (K+, Mg2+, Ca2+, and Na+) in the rhizosphere soil were determined using an atomic absorption spectrophotometer (Hitachi Z 5300, Hitachi‐Science & Technology), following the manufacturer's instructions. Physicochemical properties of soil did not differ significantly between current climate and future climate plots (Table A1).
2.6. Statistical analysis
All statistical analyses were performed using the PAST program version 2.17c (Hammer et al., 2001) and R environment version 3.6.1 (R‐Development‐Core‐Team, 2019). All the analyses were conducted based on five independent replicate plots of the field experiment (n = 5) for each treatment. The datasets were normalized to the minimum number of sequence reads per sample (5360 and 10,338 sequence reads for bacterial and fungal OTUs, respectively) using the function “rrarefy” from the vegan (Oksanen et al., 2019) package in the R environment version 3.6.1 (R‐Development‐Core‐Team, 2019). To provide an overview of the bacterial and fungal operational taxonomic units (OTUs) distribution among different plant compartments, the shared and unique OTUs were represented using a Venn diagram with the software available at http://bioinformatics.psb.ugent.be. The microbial diversity indices (Simpson's diversity, observed OTU richness, and estimated richness (Chao‐1)) were calculated for both bacteria and fungi. Variance homogeneity was examined using Levene's test. The normal distribution of data was examined using the Shapiro–Wilk test. Since some samples’ diversity was skewed, we used log10‐transformed diversity indices data for further statistical analysis while the original values were used only for data visualization (Figure 2). To test the influence of climate, plant compartment, and their interaction on microbial diversity, a split‐plot analysis of variance (ANOVA) was performed using the function “sp.plot” from the agricolae R package (de Mendiburu, 2016). In detail, the impact of climate (two levels) was analyzed at the main‐plot level, while that of the plant compartment (four levels) and both plant compartment and climate were analyzed at the sub‐plot level. Based on split‐plot ANOVA results, the least significant difference (LSD) test was applied, using the function ‘LSD.test’, to show differences between treatments.
FIGURE 2.

Alpha diversity indices of (a–c) bacterial and (d–f) fungal microbiomes in each compartment of Trifolium pratense under both current and future climate conditions. Error bars indicate the standard error; ♦ represent mean values. Different lower‐case letters indicate significant differences (p < 0.05) according to Fisher's Least Significant Difference
Microbial (bacteria and fungi) community composition was assessed by computing Jaccard and Bray–Curtis dissimilarity matrices and then visualized using non‐metric dimensional scaling (NMDS) ordinations using the function “metaMDS” in the vegan R package (Oksanen et al., 2019) to visualize compositional differences. To test whether ecological niche (plant compartment), climate, or their interaction had a significant effect on community composition, permutational multivariate analysis of variance (NPMANOVA) (Anderson, 2001), and analysis of similarities (ANOSIM) based on Bray–Curtis and Jaccard dissimilarities between microbial communities (OTU level) were performed for 999 permutations. Additionally, NPMANOVA pairwise post hoc comparisons were performed to evaluate the effect of the tested factors on bacterial and fungal communities separately using the function “pairwise.adonis” in the vegan R package (Oksanen et al., 2019). Similarly, NPMANOVA, NMDS, and heat map were performed to test the impact of plant compartment, climate, or their interaction on the functional composition of microbes colonizing T. pratense. To assess the significant effect of plant tissue differentiation on the distribution of the most abundant microbial classes among the four plant compartments, the Kruskal–Wallis test was performed. Similarly, the Mann–Whitney U test was used to assess the significant influence of climate change on the relative abundance of each microbial class colonizing the same plant compartment. The hierarchical cluster analysis (HCA) was applied based on the Bray–Curtis dissimilarity matrix to test the plant niche‐specific and climate effect on the most abundant bacterial and fungal genera. Similarity percentages (SIMPER) analysis was performed with PAST software to examine the dissimilarities between the plant compartments. To determine which OTUs occurred more frequently between compartments (rhizosphere, root, leaf/stem, and flower) and climate (current vs. future), the indicator species analysis was performed using the function “multipatt” of the indicspecies R package (De Cáceres & Legendre, 2009). Before calculation of indicator species, component A (specificity; the probability that the sample belonged to the group after the species has been identified) and component B (sensitivity; probability of finding the species in samples belonging to the group), and to avoid the bias of low abundance OTUs, only OTUs that appeared with ≥0.001% relative abundance across all samples were chosen to perform the test. Only microbial endophytes were included, and no indicator species analysis was performed for the rhizosphere microbiome.
3. RESULTS
3.1. Richness and diversity of T. pratense microbiome under current and future climate conditions
The distribution of bacterial and fungal OTUs in the plant compartments (rhizosphere and the root, leaf/stem, and flower endospheres) under both current and future climate conditions was analyzed (Figure 1). The rhizosphere soil harbored the highest number of unique OTUs (43.5% and 41.5% for bacteria and fungi, respectively). A large proportion of the OTUs in the rhizosphere was shared with the root (30.6% and 39% for bacteria and fungi, respectively), followed by leaf/stem (23% and 32.4% for bacteria and fungi, respectively), and flower (3.3% and 4.6% for bacteria and fungi, respectively) endospheres (Figure 1b,c). Only 1.7% of bacterial and 2.6% of fungal OTUs were shared among all compartments. The future climate condition‐specific OTUs were the highest for the root (40% and 36% of all bacterial and fungal OTUs, respectively) endosphere, followed by leaf/stem (39% and 38% of all bacterial and fungal OTUs, respectively) endosphere, rhizosphere (29% and 22% of all bacterial and fungal OTUs, respectively), and flower (22% and 25% of all bacterial and fungal OTUs, respectively) endosphere (Figure 1d).
FIGURE 1.

(a) Compartmentalization of Trifolium pratense. Venn diagrams showing the distribution of (b) bacterial and (c) fungal operational taxonomic units in each plant compartment and (d) climate conditions for each compartment
The effects of plant compartments, climate, or both on alpha diversity indices (Shannon's diversity, observed richness, and estimated richness) of T. pratense microbiomes were examined. Plant compartments had the highest influence on shaping microbial diversity and richness (Table 1). Climate change influenced the diversity and estimated richness of fungi (Table 1). Fungal diversity and richness were significantly higher in the leaf/stem and root endospheres under the future climate conditions compared to current climate conditions (Figure 2).
TABLE 1.
Results of split‐plot analysis of variance of the effects of climate, plant compartment, or their interactions on bacterial and fungal diversity indices
| Source of variation | Shannon's diversity | Observed richness | Estimated richness (Chao‐1) | ||||||
|---|---|---|---|---|---|---|---|---|---|
| df | F value | Pr (>F) | df | F value | Pr (>F) | df | F value | Pr (>F) | |
| Bacteria | |||||||||
| Climate | 1 | 1.49 | 0.289 | 1 | 0.532 | 0.506 | 1 | 0.978 | 0.378 |
| Plant compartment | 3 | 67.70 | <0.001 | 3 | 115.39 | <0.001 | 3 | 108.61 | <0.001 |
| Climate × Plant compartment | 3 | 0.93 | 0.438 | 3 | 1.66 | 0.200 | 3 | 1.19 | 0.334 |
| Fungi | |||||||||
| Climate | 1 | 19.58 | 0.011 | 1 | 3.91 | 0.118 | 1 | 9.22 | 0.038 |
| Plant compartment | 3 | 194.18 | <0.001 | 3 | 428.83 | <0.001 | 3 | 397.76 | <0.001 |
| Climate × Plant compartment | 3 | 5.15 | 0.006 | 3 | 2.346 | 0.098 | 3 | 2.98 | 0.051 |
Significant values (p < 0.05) are indicated in bold, marginal significant (p < 0.1) values are indicated in italic.
3.2. Community composition and taxonomic structure of T. pratense microbiome
The composition of the bacterial and fungal microbiomes of T. pratense at the OTU level (97% identity) was examined. NPMANOVA corroborated by NMDS plots based on unweighted UniFrac distances (Figure 3a,b; Table A2) revealed that the microbial (both bacteria and fungi) communities distinctively clustered based on the plant compartments (bacteria, F = 8.68 and p = 0.001; fungi, F = 7.12 and p = 0.001) but not based on the climate conditions. Meanwhile, post hoc pairwise NPMANOVA revealed unique bacterial and fungal communities for each plant compartment (Tables A3 and A4). The analysis of Bray–Curtis distance revealed similar findings (Table A2).
FIGURE 3.

Community composition of Trifolium pratense. Nonmetric multidimensional scaling (NMDS) ordination of variation in the (a) bacterial and (b) fungal community structures of T. pratense in the individual plant compartments under current and future climate conditions. T. pratense was cultivated in the grassland ecosystem. The plot is based on Jaccard dissimilarities between microbial communities at the operational taxonomic unit level across 40 samples (permutations = 999). The samples (points) are shaded based on the plant compartment and climate conditions. Ellipses indicate a 95% confidence interval surrounding each group. Taxonomic composition (class level) of T. pratense (c) bacteriome and (d) mycobiome across individual plant compartments under current and future climate conditions. Illustrated classes are the most abundant (>1% relative abundance in each group) taxa
Among the samples, 52 bacterial classes were detected. Of these, the abundance of 10 bacterial classes (>97% of total sequences relative abundance) significantly differed (except for Mollicutes) between the compartments (Figure 3c). The abundances of Actinobacteria (Kruskal–Wallis: ꭓ 2 = 25.95, p = 9.90 × 10⁻⁶) and Thermoleophilia (Kruskal–Wallis: ꭓ 2 = 26.49, p = 7.43 × 10⁻⁶) were significantly high in the rhizosphere as compared to other compartments, while those of Alphaproteobacteria (Kruskal–Wallis: ꭓ 2 = 27.14, p = 5.50 × 10⁻⁷) and Gammaproteobacteria (Kruskal–Wallis: ꭓ 2 = 13.17, p = 0.044) were significantly high in the root and leaf/stem endospheres as compared to other compartments. In total, 21 fungal classes were detected. Of these, the abundance of six classes, which accounted for more than 57% of the sequence relative abundance (Figure 3d), significantly differed among the plant compartments. The leaf/stem endosphere was significantly enriched in Dothideomycetes (Kruskal–Wallis: ꭓ 2 = 27.57, p = 4.47 × 10⁻⁶) and depleted in Eurotiomycetes (Kruskal–Wallis: ꭓ 2 = 33.07, p = 2.58 × 10⁻⁷). Meanwhile, Sordariomycetes (Kruskal–Wallis: ꭓ 2 = 32.71, p = 3.67 × 10⁻⁷) and Agaricomycetes (Kruskal–Wallis: ꭓ 2 = 27.28, p = 4.62 × 10⁻⁶) were significantly enriched in the rhizosphere compared to other compartments. Future climate conditions did not significantly affect the relative abundances of the dominant bacterial classes in the plant compartments. For fungi, the future climate conditions increased the relative abundance of Eurotiomycetes (Mann–Whitney: p = 0.015) and Agaricomycetes (Mann–Whitney U test: p = 0.031) in the leaf/stem endosphere and decreased the relative abundance of Tremellomycetes in the leaf/stem (Mann–Whitney U test; p = 0.023) and flower (Mann–Whitney U test; p = 0.039) endospheres.
Hierarchical clustering of the microbial community composition at the genus level revealed that the plant compartments were the major determinant of genera composition (Figure A4). The most abundant bacterial genera were Pantoea and Rhizobia (relative abundance of 16% and 9% among all bacterial sequences, respectively), while the most abundant fungal genera were Cladosporium and Fusarium (relative abundances of 15.6% and 5% among all fungal sequences, respectively). The compartment dissimilarity based on genera was calculated using SIMPER analysis (Table A5). Allorhizobium, Neorhizobium, Pararhizobium, Rhizobium, Pantoea, Candidatus Phytoplasma, Cladosporium, Fusarium, and Exophiala were the major genera that contributed to differentiate the rhizosphere and endosphere communities.
3.3. Analysis of plant compartment/niche and climate indicator species
Indicator species analysis identified the bacterial and fungal taxa that significantly benchmark each plant compartment/niche and/or climate. We detected 35 bacterial indicator OTUs (Table 2) belonging to 13 families and 37 fungal OTUs (Table 3) belonging to 19 families. Only six fungal OTUs were significantly associated (p < 0.05) with future climate conditions and belonged to Plectosphaerellaceae, Stachybotryaceae, Helotiales, and Hypocreales, which colonized the root and leaf/stem endospheres.
TABLE 2.
Indicator species analysis for bacterial operational taxonomic units (OTUs) across all samples and in the leaf/stem and root endospheres. No indicator OTUs were detected in the flower endosphere
| Community | Treatment | Indicator OTU | Component A | Component B | Indicator value | p‐value | Indicator species | Family |
|---|---|---|---|---|---|---|---|---|
| All samples | Leaf/stem | OTU091 | 0.9622 | 1 | 0.981 | 0.001 | Rathayibacter_tritici | Microbacteriaceae |
| OTU061 | 0.9435 | 1 | 0.971 | 0.001 | Rhodococcus cercidiphylli | Nocardiaceae | ||
| OTU118 | 0.9016 | 1 | 0.95 | 0.001 | Burkholderiaceae | Burkholderiaceae | ||
| OTU119 | 0.8926 | 1 | 0.945 | 0.001 | Curtobacterium flaccumfaciens | Microbacteriaceae | ||
| OTU087 | 0.9801 | 0.9 | 0.939 | 0.001 | Sphingobium | Sphingomonadaceae | ||
| OTU070 | 0.8485 | 1 | 0.921 | 0.001 | Sphingomonas | Sphingomonadaceae | ||
| OTU068 | 0.8465 | 1 | 0.92 | 0.001 | Pseudomonas | Pseudomonadaceae | ||
| OTU156 | 0.8376 | 1 | 0.915 | 0.001 | Devosia | Devosiaceae | ||
| OTU044 | 0.8235 | 1 | 0.907 | 0.001 | Brevundimonas intermedia | Caulobacteraceae | ||
| OTU139 | 0.7944 | 1 | 0.891 | 0.002 | Actinomycetospora | Pseudonocardiaceae | ||
| OTU047 | 0.7792 | 0.9 | 0.837 | 0.016 | Nocardioides | Nocardioidaceae | ||
| OTU120 | 0.8713 | 0.8 | 0.835 | 0.018 | Pseudomonas | Pseudomonadaceae | ||
| All samples | Root | OTU079 | 1 | 1 | 1 | 0.001 | Allorhizobium‐Neorhizobium‐Pararhizobium‐Rhizobium | Rhizobiaceae |
| OTU145 | 1 | 1 | 1 | 0.001 | Allorhizobium‐Neorhizobium‐Pararhizobium‐Rhizobium | Rhizobiaceae | ||
| OTU064 | 0.9978 | 1 | 0.999 | 0.001 | Rhizobium leguminosarum | Rhizobiaceae | ||
| OTU003 | 0.9953 | 1 | 0.998 | 0.001 | Rhizobium leguminosarum | Rhizobiaceae | ||
| OTU073 | 0.975 | 1 | 0.987 | 0.001 | Alphaproteobacteria | |||
| OTU051 | 0.9545 | 1 | 0.977 | 0.001 | Kribbella | Nocardioidaceae | ||
| OTU031 | 0.9533 | 1 | 0.976 | 0.001 | Bradyrhizobium | Xanthobacteraceae | ||
| OTU084 | 0.9328 | 1 | 0.966 | 0.001 | Gammaproteobacteria | |||
| OTU077 | 0.9296 | 1 | 0.964 | 0.001 | Mesorhizobium | Rhizobiaceae | ||
| OTU107 | 0.9086 | 1 | 0.953 | 0.001 | Pseudonocardia | Pseudonocardiaceae | ||
| OTU034 | 0.9077 | 1 | 0.953 | 0.003 | Ensife meliloti | Rhizobiaceae | ||
| OTU085 | 0.9036 | 1 | 0.951 | 0.001 | Phyllobacterium | Rhizobiaceae | ||
| OTU036 | 0.8996 | 1 | 0.948 | 0.001 | Rhizobacter | Burkholderiaceae | ||
| OTU098 | 0.9965 | 0.9 | 0.947 | 0.001 | Allorhizobium‐Neorhizobium‐Pararhizobium‐Rhizobium | Rhizobiaceae | ||
| OTU045 | 0.8519 | 1 | 0.923 | 0.001 | Aeromicrobium | Nocardioidaceae | ||
| OTU112 | 0.9231 | 0.9 | 0.911 | 0.001 | Caulobacteraceae | Caulobacteraceae | ||
| OTU060 | 0.8636 | 0.9 | 0.882 | 0.001 | Arenimonas | Xanthomonadaceae | ||
| OTU076 | 0.8421 | 0.9 | 0.871 | 0.001 | Sphingomonas | Sphingomonadaceae | ||
| OTU063 | 0.7222 | 1 | 0.85 | 0.001 | Lapillicoccus | Intrasporangiaceae | ||
| OTU052 | 0.9 | 0.8 | 0.849 | 0.002 | Nitrosomonadaceae | Nitrosomonadaceae | ||
| OTU022 | 0.8875 | 0.8 | 0.843 | 0.015 | Solirubrobacterales | |||
| OTU055 | 0.7368 | 0.7 | 0.718 | 0.018 | Gaiella | Gaiellaceae | ||
| Leaf/stem | Future | OTU087 | 0.9328 | 1 | 0.966 | 0.003 | Sphingobium | Sphingomonadaceae |
TABLE 3.
Indicator species analysis for fungal operational taxonomic units (OTUs) across all samples and each compartment
| Community | Treatment | Indicator OTU | Component A | Component B | Indicator value | p‐value | Indicator species | Family |
|---|---|---|---|---|---|---|---|---|
| All samples | Future | OTU22 | 0.9017 | 0.6667 | 0.775 | 0.043 | Cadophora luteo‐olivacea | Helotiales_fam_Incertae_sedis |
| OTU72 | 0.9776 | 0.4667 | 0.675 | 0.046 | Gibellulopsis chrysanthemi | Plectosphaerellaceae | ||
| OTU46 | 0.9391 | 0.4667 | 0.662 | 0.037 | Myrothecium | Stachybotryaceae | ||
| All samples | flower | OTU51 | 1 | 1 | 1 | 0.001 | Sclerotiniaceae | Sclerotiniaceae |
| All samples | Leaf/stem | OTU12 | 0.9764 | 1 | 0.988 | 0.001 | Colletotrichum | Glomerellaceae |
| OTU16 | 0.9638 | 1 | 0.982 | 0.001 | Chaetosphaeronema | Phaeosphaeriaceae | ||
| OTU15 | 0.9002 | 1 | 0.949 | 0.004 | Alternaria alternata | Pleosporaceae | ||
| OTU53 | 0.9693 | 0.9 | 0.934 | 0.001 | Acremonium polychromum | Hypocreales_fam_Incertae_sedis | ||
| OTU43 | 0.8526 | 1 | 0.923 | 0.001 | Chaetosphaeronema | Phaeosphaeriaceae | ||
| OTU44 | 0.8464 | 1 | 0.92 | 0.006 | Vishniacozyma victoriae | Bulleribasidiaceae | ||
| OTU79 | 0.7753 | 1 | 0.881 | 0.002 | Vishniacozyma | Bulleribasidiaceae | ||
| OTU67 | 0.8274 | 0.9 | 0.863 | 0.004 | Articulospora | Helotiaceae | ||
| OTU42 | 0.9107 | 0.8 | 0.854 | 0.003 | Acremonium fusidioides | Hypocreales_fam_Incertae_sedis | ||
| OTU72 | 0.98 | 0.6 | 0.767 | 0.009 | G. chrysanthemi | Plectosphaerellaceae | ||
| All samples | Root | OTU3 | 0.999 | 1 | 0.999 | 0.001 | Exophiala | Herpotrichiellaceae |
| OTU23 | 0.9974 | 1 | 0.999 | 0.001 | Ilyonectria macrodidyma | Nectriaceae | ||
| OTU33 | 0.9956 | 1 | 0.998 | 0.001 | Periconia | Periconiaceae | ||
| OTU5 | 0.9949 | 1 | 0.997 | 0.001 | Fusarium solani | Nectriaceae | ||
| OTU39 | 0.9862 | 1 | 0.993 | 0.001 | Exophiala | Herpotrichiellaceae | ||
| OTU24 | 0.9231 | 1 | 0.961 | 0.001 | Clonostachys rosea | Bionectriaceae | ||
| OTU11 | 0.9084 | 1 | 0.953 | 0.001 | Fusarium proliferatum | Nectriaceae | ||
| OTU50 | 0.9982 | 0.9 | 0.948 | 0.001 | Pleosporales | unclassified Pleosporales | ||
| OTU49 | 1 | 0.8 | 0.894 | 0.001 | Cistella albidolutea | Hyaloscyphaceae | ||
| OTU26 | 1 | 0.8 | 0.894 | 0.001 | Darksidea | Lentitheciaceae | ||
| OTU14 | 0.8812 | 0.9 | 0.891 | 0.001 | Fusarium | Nectriaceae | ||
| OTU28 | 0.9905 | 0.8 | 0.89 | 0.001 | Glarea | Helotiaceae | ||
| OTU25 | 0.8235 | 0.9 | 0.861 | 0.002 | Plenodomus biglobosus | Leptosphaeriaceae | ||
| OTU57 | 0.9034 | 0.8 | 0.85 | 0.002 | Tetracladium marchalianum | Helotiaceae | ||
| OTU63 | 0.7093 | 1 | 0.842 | 0.003 | Tetracladium | Helotiaceae | ||
| OTU69 | 1 | 0.7 | 0.837 | 0.001 | Helotiales | |||
| OTU55 | 0.95 | 0.7 | 0.815 | 0.004 | Roussoella solani | Thyridariaceae | ||
| OTU47 | 0.9333 | 0.5 | 0.683 | 0.017 | Chaetomium angustispirale | Chaetomiaceae | ||
| OTU64 | 1 | 0.4 | 0.632 | 0.028 | Pleosporales | |||
| Leaf/stem | Future | OTU42 | 0.8214 | 1 | 0.906 | 0.001 | Acremonium fusidioides | Hypocreales_fam_Incertae_sedis |
| OTU60 | 0.9908 | 0.8 | 0.89 | 0.017 | Stachybotrys | Stachybotryaceae | ||
| OTU72 | 0.9576 | 0.8 | 0.875 | 0.010 | G. chrysanthemi | Plectosphaerellaceae | ||
| Root | Future | OTU69 | 0.9461 | 0.8 | 0.87 | 0.01 | Helotiales |
3.4. Potential function of T. pratense microbiome across different plant niches and climate conditions
FAPROTAX and FUNGuild were used to classify the bacterial and fungal OTU based on ecological functions to determine the microbial function distribution among the compartments of T. pratense and the climate conditions (Figure 4). NMDS analysis clustered the potential functional groups according to the plant compartment (Figure A5) for both bacteria (Bray–Curtis distances, F = 10.15 and p = 0.0001; Jaccard distance, F = 13.89 and p = 0.001) and fungi (Bray–Curtis distances, F = 45.00 and p = 0.001; Jaccard distance, F = 20.91 and p = 0.001) (Table A6). Climate conditions did not contribute to shaping the overall functional compositions. However, climate conditions affected the functions of the mycobiome of the leaf/stem endosphere. The relative abundances of saprotrophs (Mann–Whitney: p = 0.007), plant‐pathogen/saprotrophs (Mann–Whitney U; p = 0.031), and animal pathogen/saprotroph (Mann–Whitney U; p = 0.007) under future climate conditions were higher than that under current climate conditions. Additionally, we focused on the following two most important microbial functions: symbiotic N‐fixing bacteria and plant pathogenic fungi. In this study, 14 bacterial genera represented by 682 OTUs were assigned as symbiotic N‐fixing bacteria (Figure A6; Table A7), while 47 fungal genera represented by 177 OTUs were assigned as plant pathogens (Figure A7; Table A8). Interestingly, climate conditions did not affect these microbial functions (Table A9).
FIGURE 4.

Functional characteristics of Trifolium pratense microbiome. Circle packing visualization of predicted trophic modes and functions of (a) bacterial and (b) fungal communities using FAPROTAX and FUNGuild databases for bacteria and fungi, respectively. The size of each circle represents the relative abundance of each function detected in each T. pratense compartment and climate condition. Climate: A = Current, F = Future
3.5. Prediction of the metabolic functions of the bacterial community using Tax4Fun
The potential metabolic functional profiles of bacterial microbiomes were predicted based on the 16S rRNA genes of retrieved bacterial taxa using Tax4Fun according to the KEGG Ortholog groups (KOs) . The highly abundant metabolic genes (>0.001% sequence relative abundance) belonged to the following four categories: metabolism, genetic information processing, environmental information processing, and signaling, and cellular processes (Figure A8). Climate conditions did not affect the overall predicted metabolism of the bacterial communities (F = 0.73, p = 0.512). In contrast, the metabolic functions of bacteria in each compartment significantly varied (F = 13.01, p = 0.001) (Table A10). Additionally, the genes encoding plant growth‐promoting enzymes involved in biofertilization (N‐fixing: 28 genes, phosphate solubilization: 15 genes and siderophore synthesis: 2 genes) and biostimulation (indole acetic acid (IAA) production: 9 genes, 1‐aminocyclopropane‐1‐carboxylate (ACC) deaminase activity: 1 gene and general plant growth‐promoting traits: 6 genes) were predicted (Liang et al., 2020; Marasco et al., 2018) (Figure 5; Table A11). The climate conditions did not affect the composition of predicted functional genes involved in plant growth‐promoting traits (F = 0.97, p = 0.374; Table A12).
FIGURE 5.

The heat map of normalized relative abundance of metabolic functional profiles of Kyoto Encyclopedia of Genes and Genomes (KEGG) orthologs (KOs) assigned to KEGG pathways involved in plant growth‐promoting (PGP) functions within Trifolium pratense bacterial microbiome. RhC, rhizosphere/current; RhF, rhizosphere/future; RC, root/current; RF, root/future; LC, leaf/stem/current; LF, leaf/stem/future; FC, flower/current; FF, flower/future; IAA, indole acetic acid; ACC, 1‐aminocyclopropane‐1‐carboxylate deaminase
4. DISCUSSION
4.1. Red clover compartments/niches exhibit distinct microbial composition
In this study, the characterization of the red clover microbiome at the OTU and genus levels revealed that the individual plant compartments exhibited a unique microbial composition. This is consistent with the results of a recent study that reported a distinct microbial community in the flower and leaf epiphytes of T. pratense (Gaube et al., 2020). The bacterial composition is also reported to vary in different compartments of the model plants Arabidopsis thaliana (Bulgarelli et al., 2012), Populus spp. (Cregger et al., 2018), and Medicago truncatula (Brown et al., 2020), as well as those of the non‐model plants, such as Myrtillocactus geometrizans (Fonseca‐Garcia et al., 2016), Opuntia robusta (Fonseca‐Garcia et al., 2016), Cycas panzhihuaensis (Zheng & Gong, 2019), Agave spp (Coleman‐Derr et al., 2016), Boechera stricta (Wagner et al., 2016), and Opuntia ficus‐indica (Karray et al., 2020). The limited studies on the fungal phytobiomes have yielded similar results as the fungal composition was reported to be differentiated depending on plant compartments (Coleman‐Derr et al., 2016; Cregger et al., 2018; Fonseca‐Garcia et al., 2016; Gargouri et al., 2021; Zheng & Gong, 2019). The niche‐related differences in the microbiome composition can be attributed to variations in the microbial pools that invade different plant tissues through vertical transmission from seeds or horizontal transmission from soil and atmosphere (Cregger et al., 2018). The variations in the density of invading microbes and the unequal distributions of nutrients and oxygen among different plant tissues can also be a reason for microbial variations among different compartments (Vandenkoornhuyse et al., 2015).
Additionally, consistent with the results of other studies, the microbial diversity and richness varied between the plant compartments in this study. The analysis revealed that the microbial richness decreased from the rhizosphere to the endosphere tissues. This is due to the secretion of root exudates containing organic and amino acids, sugars, vitamins, hormones, and growth regulating substances in the rhizosphere, which promote microbial growth and colonization (Berg et al., 2016; Turner et al., 2013). In contrast, limited nutrients and available intercellular space in the plant endosphere limit microbial growth and colonization. The horizontal transfer of fungal communities from the rhizosphere to the endosphere was higher than that of bacterial communities. Among the rhizosphere fungal OTUs, 39% were transmitted to the root endosphere, 35% were shared with root and leaf/stem endospheres, and 6% were shared with all compartments. Similarly, among the rhizosphere bacterial OTUs, only 29% were transmitted to the root endosphere, 18% were shared with the root and leaf/stem endosphere, and only 4% were shared with all compartments. This suggested that the host genetic regulation of the bacterial composition is higher than that of the fungal composition and that the levels of host‐specific selection factors are high in the aboveground compartments. In contrast, the high level of specificity in the flower endosphere may indicate specific microbiome recruitment through air or pollinators (Vannette, 2020).
The analysis of the taxonomic composition of the clover microbiome in different compartments revealed that Actinobacteria and Sordariomycetes were the predominant microbes in the rhizosphere. In the root endosphere, Alphaproteobacteria (nitrogen‐fixing Rhizobia) was the predominant microbe, which was consistent with the results of a previous study on red clover (Hartman et al., 2017). Additionally, the root endosphere was less frequently colonized by other potential N‐fixing bacteria, such as Bradyrhizobium, Devosia, Ensifer, Burkholderia, Mesorhizobium, Microvirga, and Phyllobacterium (Table A7). Previous studies have reported that the roots of Trifolium repens and Trifolium fragiferum comprised Rhizobium as the predominant microbe with decreased abundance of rhizobia species, such as Bradyrhizobium, Sinorhizobium, and Mesorhizobium (Liu et al., 2007; Marilley & Aragno, 1999). The T. pratense root endosphere was enriched in OTUs of various genera, such as Actinoplanes and Pseudomonas. To the best of our knowledge, the microbial composition of the leaf/stem endosphere has not been previously investigated. In this study, the leaf/stem compartment predominantly comprised Gammaproteobacteria and Dothideomycetes. The species or strains of the most dominant bacterial and fungal genera in the root and leaf endosphere, such as Actinoplanes (Lazzarini et al., 2000), Pseudonocardia (Mangamuri et al., 2016), Streptomyces (Gouda et al., 2016), and Cladosporium (Gouda et al., 2016) are reported to synthesize medicinally important natural products. Flowers provide a unique habitat for microorganisms because of their ephemerality and anatomy, which form distinct micro‐niches (Aleklett et al., 2014). This study investigated the red clover inflorescence microhabitats (calyx, corolla, pistil, and stamen) as one unit. The microbiome of the flower predominantly comprised Gammaproteobacteria (Pantoea) and Mollicutes (Candidatus Phytoplasma), while the most prevalent fungal community members remained unidentified. A recent study on the seed‐borne endophytes of T. pratense revealed that the predominant bacterial taxa were Gammaproteobacteria (63% of relative sequences abundance, with a dominance of Pantoea) and unidentified fungi (70% of relative sequence abundance). This indicated that these taxa could be unique members of T. pratense flowers that are transmitted to the next generation via seeds. Candidatus Phytoplasma, which is the obligate bacterial pathogen of plant phloem, is transmitted through plant propagation materials and seeds, as well as by insect vectors (Kumari et al., 2019). In this study, microbial genera unique to the flower were detected, including the two insect symbionts, Arsenophonus and Rickettsia, which are transmitted by various arthropods (Caspi‐Fluger et al., 2012; Novakova et al., 2009). Thus, the plant served as a reservoir for the horizontal transmission of both bacterial genera.
4.2. Red clover harbors various beneficial microbes for plant growth and system sustainability
The analysis of the predicted bacterial functional genes showed various genes involved directly or indirectly in plant growth initiation and adaptation to climate changes. For example, this study predicted the presence of bacterial genes involved in siderophore synthesis that indirectly induce plant systemic resistance by enabling bacteria to compete with pathogens through the removal of iron from the environment (Bakker et al., 2007). Moreover, genes involved in the production of phytohormones, such as auxin, indole‐3‐acetic acid (IAA), and 1‐aminocyclopropane‐1‐carboxylic acid (ACC) that directly promote plant growth by enhancing cell division and differentiation or by lowering indigenous ethylene levels in the rhizosphere environment were predicted (Goren‐Saglam et al., 2020; Hayat et al., 2010; Van de Poel & Van Der Straeten, 2014). Additionally, IAA and ACC enable the host plants to adapt to abiotic environmental stress conditions (Ikram et al., 2018; Van de Poel & Van Der Straeten, 2014). In our study, Pseudomonas, Streptomyces, and Pantoea are three of the most abundantly detected genera in the rhizosphere and endosphere samples that are reported to promote plant growth and produce these bioactive compounds (Abbasi et al., 2019; Bakker et al., 2007; Jaemsaeng et al., 2018; Shariati et al., 2017). Furthermore, N‐fixing and phosphate solubilization genes, which are involved in enhancing plant growth and nutrient release to the soil and reduce the need for N and P fertilization (Hayat et al., 2010), were predicted. Therefore, T. pratense is considered one of the most important soil biofertilizer forage crops that contribute to system sustainability.
4.3. The impact of climate change on microbial community composition of T. pratense
Climate changes in terms of increasing temperature, summer drought, and altered precipitation patterns play a key role in shaping soil microbial communities (Mekala & Polepongu, 2019). However, few studies have investigated the effect of climatic conditions on plant‐associated microbiomes. Drought conditions obstruct root development leading to the limitation of water and nutrients uptakes by plants and the diminishment of plant biomass (Al‐Arjani et al., 2020; Hameed et al., 2014). In addition, severe drought may lead to over‐accumulation of reactive oxygen species that result in extensive plant cell damage and death (Cruz de Carvalho, 2008). Several plant‐associated microbes were found to contribute to drought stress tolerance in plants by carrying out various strategies. For instance, arbuscular mycorrhizal fungi‐plant associations lead to the induction of particular genes to elevated levels of expression such as P5CS involving in proline biosynthesis and genes coding for late embryogenesis abundant (LEA) proteins associated with ions and antioxidative stress system. Also, it regulates the abscisic acid (ABA) of plant content (Ahanger et al., 2014). Moreover, arbuscular mycorrhizal fungi could mitigate the negative effect of future climate conditions by altering the community composition and enhancing the richness of specific taxa (Wahdan et al., 2021). Recent studies (Gargouri et al., 2021; Karray et al., 2020) performed on the genus Opuntia revealed that bacterial and fungal plant microbiomes changed in the rhizosphere and root endosphere along a climatic aridity gradient. Moreover, they identified specific biomarker taxa for each bioclimatic zone. Additionally, increasing the aridity resulted in highly cohesive soil microbial‐root fungal networks. These microbial dynamics, biomarkers, and the highly correlative microbial networks could play a crucial role in the aridity stress and potentially promote the survival of Opuntia, one of the most xerophyte plants, across a wide range of arid zones (Gargouri et al., 2021). On the other hand, we have noticed that T. pratense resistance to cascading drought and rising soil temperature was limited. A marked reduction of T. pratense cover in the GCEF was detected after 4 years of growth under future climate conditions (unpublished results; Figure A9). In contrast to previous studies, our results revealed that T. pratense harbored a highly conserved microbiome that did not provide plasticity to the host to acquire desirable microbes or reconstruct the community structure as observed in the bacterial community. Fungal composition appeared to be more sensitive to environmental factors than bacterial composition, which was consistent with the results of previous studies (Coleman‐Derr et al., 2016; Cregger et al., 2018; Fonseca‐Garcia et al., 2016; Hacquard, 2016; Hamonts et al., 2018). We detected several dark septate endophytic fungal genera as indicators of future climate. Some of these indicators could be beneficial to plant growth and disease resistance, such as Cadophora, Myrothecium, and Stachybotrys (Banerjee et al., 2010; Busby et al., 2016; Yakti et al., 2019). However, these climate indicators are represented with few OTUs among the whole community.
5. CONCLUSIONS
To the best of our knowledge, this is the first study to examine the composition and functions of bacteria and fungi in the four compartments of the forage legume crop T. pratense under both current and future climate conditions. Although the T. pratense microbiomes did not differ at the community level, it is possible that the microbial communities changed at the genomic level that was not detected by our approach (16S and ITS sequencing data). Therefore, further studies on microbial functions involving the integration of the high‐resolution metagenome, metatranscriptome, and metaproteome approaches to unravel the entire gene expression and protein profiles of plant microbiota are required to provide more clear views of the microbial functions and their link to host performance. Moreover, a further controlled study is required to investigate the potential link between microbial composition and plant performance under future climate conditions.
CONFLICT OF INTEREST
None declared.
AUTHOR CONTRIBUTIONS
Sara Fareed Mohamed Wahdan: Data curation (lead); Formal analysis (lead); Investigation (lead); Methodology (lead); Software (equal); Visualization (lead); Writing‐original draft (lead). Benjawan tanunchai: Methodology (supporting); Writing‐review & editing (supporting). Yuting Wu: Methodology (equal); Writing‐review & editing (equal). Chakriya Sansupa: Methodology (supporting); Writing‐review & editing (supporting). Martin Schädler: Investigation (supporting); Project administration (lead); Writing‐review & editing (equal). François Buscot: Conceptualization (lead); Funding acquisition (lead); Project administration (lead); Resources (lead); Supervision (lead); Writing‐review & editing (lead). Witoon Purahong: Conceptualization (lead); Funding acquisition (lead); Investigation (supporting); Project administration (lead); Supervision (lead); Writing‐review & editing (lead). Turki M. Dawoud: Investigation (equal); Writing‐review & editing (supporting).
ETHICS STATEMENT
None required.
ACKNOWLEDGEMENTS
We acknowledge the Helmholtz Association, the Federal Ministry of Education and Research, the State Ministry of Science and Economy of Saxony‐Anhalt, and the State Ministry for Higher Education, Research and the Arts Saxony to fund the Global Change Experimental Facility (GCEF) project. We also acknowledge the staff of the Bad Lauchstädt Experimental Research Station (especially Ines Merbach and Konrad Kirsch) for their work in maintaining the plots and infrastructures of the GCEF, and Stefan Klotz, Harald Auge, and Thomas Reitz for setting up the GCEF. We thank Dr. Harald Auge and Sigrid Berger for providing us with data regarding the cover percentage of red clover. Our work was funded by the annual research fund of the Department of Soil Ecology, UFZ‐Helmholtz. Centre for Environmental Research. Sara Wahdan is financially supported by the Egyptian Scholarship (Ministry of Higher Education, external missions 2016/2017 call). The community composition data were computed at the High‐Performance Computing (HPC) Cluster EVE, a joint effort of both the Helmholtz Centre for Environmental Research–UFZ and the German Centre for Integrative Biodiversity Research (iDiv) Halle‐Jena‐Leipzig.
APPENDIX 1.
TABLE A1.
Physicochemical properties of GCEF plots soil of grassland ecosystem under current and future climate conditions at the sampling time
| Edaphic/climatic factor | Current climate | Future climate |
|---|---|---|
| pH | 6.47 ± 0.18 | 6.53 ± 0.17 |
| Organic matter (%) | 5.18 ± 0.72 | 4.45 ± 0.41 |
| P (ppm.) | 129.86 ± 18.49 | 124.16 ± 14.33 |
| CEC | 8.64 ± 0.26 | 8.64 ± 0.3 |
| K (m.e/100 g soil) | 1.12 ± 0.36 | 1.19 ± 0.21 |
| Na (m.e/100 g soil) | 0.43 ± 0.25 | 0.54 ± 0.39 |
| Ca (m.e/100 g soil) | 21.08 ± 4.82 | 19.39 ± 3.83 |
| Mg (m.e/100 g soil) | 2.4 ± 0.03 | 2.55 ± 0.39 |
| C/N | 11.79 ± 2.25 | 10.25 ± 1.82 |
| Precipitation (mm) | 0.80 ± 0.23 | 0.82 ± 0.13 |
| Soil temperature, mean value (°C) | 22.34 ± 0.82 | 23.02 ± 0.37 |
Values represent mean ± SD. The values did not differ significantly between ambient and future climate soils (t‐test, p > 0.05).
TABLE A2.
Two‐way NPMANOVA and two‐way ANOSIM (Jaccard & Bray–Curtis dissimilarity matrix, permutations = 999) tested the influence of plant compartment, climate, and their interaction on T. pratense microbiome community composition based on OTU level
| Source of variation/community | Jaccard distance | Bray–Curtis distances | ||||||
|---|---|---|---|---|---|---|---|---|
| Two‐way NPMANOVA | Two‐way ANOSIM | Two‐way NPMANOVA | Two‐way ANOSIM | |||||
| PseudoF | p | R | p | PseudoF | p | R | p | |
| Bacteria | ||||||||
| Plant compartment | 8.684 | 0.001 | 0.765 | 0.001 | 10.386 | 0.001 | 0.656 | 0.001 |
| Climate | 0.991 | 0.382 | 0.005 | 0.471 | 1.386 | 0.201 | −0.031 | 0.684 |
| Plant compartment × climate | 0.979 | 0.453 | nd | nd | 0.939 | 0.563 | nd | nd |
| Fungi | ||||||||
| Plant compartment | 7.123 | 0.001 | 0.941 | 0.001 | 24.912 | 0.001 | 0.792 | 0.001 |
| Climate | 1.583 | 0.063 | 0.206 | 0.009 | 1.366 | 0.244 | 0.074 | 0.104 |
| Plant compartment × climate | 1.072 | 0.307 | nd | nd | 1.116 | 0.335 | nd | nd |
Abbreviation: nd, not detected.
Significant values (p < 0.05) are indicated in bold, marginal significant (p < 0.1) values are indicated in italic.
TABLE A3.
Pair‐wise post hoc test comparison using NPMANOVA on the Bray–Curtis similarity matrices in the total bacterial community to evaluate the ‘plant compartment’ effect
| Compartment | F. Model | R 2 | p adjusted sig. |
|---|---|---|---|
| Rh, R | 10.437 | 0.367 | 0.001 |
| Rh, L | 10.802 | 0.375 | 0.001 |
| Rh, F | 8.538 | 0.321 | 0.001 |
| R, L | 8.154 | 0.311 | 0.001 |
| R, F | 7.937 | 0.306 | 0.001 |
| L, F | 4.452 | 0.198 | 0.001 |
Abbreviations: Rh, rhizosphere; R, root; L, leaf/stem; F, flower.
TABLE A4.
Pair‐wise post hoc test comparison using NPMANOVA on the Bray–Curtis similarity matrices in the total fungal community to evaluate the ‘plant compartment’ effect
| Compartment | F. Model | R 2 | p adjusted sig. |
|---|---|---|---|
| F, L | 45.209 | 0.715 | 0.001 |
| F, Rh | 48.685 | 0.730 | 0.001 |
| F, R | 10.259 | 0.363 | 0.001 |
| L, Rh | 20.290 | 0.529 | 0.001 |
| L, R | 19.500 | 0.520 | 0.001 |
| Rh, R | 16.556 | 0.479 | 0.001 |
Abbreviations: Rh, rhizosphere; R, root; L, leaf/stem; F, flower.
TABLE A5.
Similarity percentages (SIMPER) analysis determines the genera contributions to the dissimilarity among compartments. In the upper part of the table, the compartment/niche pairwise comparison of average dissimilarity percentage has been reported. In the lower part, the overall top three genera contributing to the pairwise dissimilarity were listed
| Rhizosphere | Root | Leaf & stem | Flower | ||
|---|---|---|---|---|---|
| Bacterial community | Rhizosphere | 68.32 | 69.13 | 91.48 | |
| Root |
Allorhizobium‐Neorhizobium‐Pararhizobium‐Rhizobium (28.29) C. Phytoplasma (6.63) Actinoplanes (6.43) |
65.82 | 92.41 | ||
| Leaf & stem |
Pantoea (14.23) C. Phytoplasma (13.54) Pseudomonas (5.63) |
Allorhizobium‐Neorhizobium‐Pararhizobium‐Rhizobium (23.28) Pantoea (13.61) C._Phytoplasma (12.48) |
80.48 | ||
| Flower |
Pantoea (23.44) C. Phytoplasma (8.12) Serratia (6.41) |
Allorhizobium‐Neorhizobium‐Pararhizobium‐Rhizobium (22.91) Pantoea (20.43) C. Phytoplasma (15.31) |
Pantoea (22.81) C. Phytoplasma (18.47) Pseudomonas (8.31) |
||
| Fungal community | Rhizosphere | 62.44 | 64.01 | 89.72 | |
| Root |
Cladosporium (15.42) Fusarium (10.29) Gibellulopsis (9.57) |
83.9 | 96.03 | ||
| Leaf & stem |
Cladosporium (25.12) Fusarium (11.70) Exophiala (8.00) |
Cladosporium (39.21) Exophiala (9.04) Fusarium (8.70) |
79.37 | ||
| Flower |
Cladosporium (14.94) Fusarium (14.33) Exophiala (9.68) |
Exophiala (18.50) Fusarium (17.95) Cladosporium (16.84) |
Cladosporium (47.26) Plectosphaerella (9.98) Colletotrichum (6.02) |
TABLE A6.
NPMANOVA and ANOSIM (Jaccard & Bray–Curtis dissimilarity matrix, permutations = 999) tested the influence of plant compartments/niches as well as climate change on the microbial functional composition of T. pratense based on OTU level in each plant compartment separately
| Source of variation/community | Jaccard distance | Bray–Curtis distances | ||||||
|---|---|---|---|---|---|---|---|---|
| Two‐way NPMANOVA | Two‐way ANOSIM | Two‐way NPMANOVA | Two‐way ANOSIM | |||||
| PseudoF | p | R | p | PseudoF | p | R | p | |
| Bacteria | ||||||||
| Plant compartment | 13.897 | 0.001 | 0.544 | 0.001 | 10.153 | 0.0001 | 0.472 | 0.0001 |
| Climate | 1.519 | 0.163 | 0.093 | 0.053 | 1.102 | 0.332 | −0.0345 | 0.681 |
| Plant compartment × climate | 1.582 | 0.095 | nd | nd | 1.190 | 0.282 | nd | nd |
| Fungi | ||||||||
| Plant compartment | 20.912 | 0.001 | 0.625 | 0.001 | 45.007 | 0.001 | 0.864 | 0.001 |
| Climate | 1.357 | 0.231 | 0.026 | 0.308 | 2.388 | 0.093 | 0.138 | 0.021 |
| Plant compartment × climate | 0.770 | 0.641 | nd | nd | 1.332 | 0.255 | nd | nd |
Abbreviation: nd, not detected.
Significant values (p < 0.05) are indicated in bold, marginal significant (p < 0.1) values are indicated in italic.
TABLE A7.
OTUs number of each potential symbiotic N‐fixing bacteria detected in each T. pratense compartment under current and future climate conditions
| Genera | Current climate | Future climate | ||||||
|---|---|---|---|---|---|---|---|---|
| Rhizosphere | Root | Leaf/stem | Flower | Rhizosphere | Root | Leaf/stem | Flower | |
| Allorhizobium‐Neorhizobium‐Pararhizobium‐Rhizobium | 110 | 207 | 84 | 3 | 71 | 222 | 100 | 4 |
| Aminobacter | 0 | 1 | 0 | 0 | 0 | 1 | 1 | 0 |
| Bradyrhizobium | 40 | 11 | 3 | 1 | 39 | 37 | 6 | 1 |
| Burkholderia‐Caballeronia‐Paraburkholderia | 6 | 4 | 0 | 0 | 13 | 10 | 0 | 0 |
| Devosia | 18 | 27 | 23 | 2 | 14 | 32 | 45 | 1 |
| Ensifer | 3 | 3 | 1 | 0 | 2 | 7 | 2 | 1 |
| Mesorhizobium | 10 | 8 | 4 | 2 | 6 | 14 | 8 | 0 |
| Methylobacterium | 5 | 5 | 16 | 1 | 5 | 10 | 21 | 3 |
| Microvirga | 30 | 6 | 3 | 1 | 27 | 10 | 8 | 1 |
| Ochrobactrum | 0 | 1 | 1 | 0 | 0 | 2 | 0 | 0 |
| Phyllobacterium | 6 | 4 | 3 | 0 | 8 | 7 | 5 | 0 |
| Rhizobium | 15 | 33 | 23 | 1 | 13 | 31 | 32 | 2 |
| Rhodopseudomonas | 0 | 1 | 1 | 0 | 1 | 2 | 1 | 1 |
| Shinella | 1 | 0 | 2 | 0 | 1 | 2 | 1 | 0 |
TABLE A8.
OTUs number of each potential plant pathogenic fungi detected in each T. pratense compartment under current and future climate conditions
| Genera | Current climate | Future climate | ||||||
|---|---|---|---|---|---|---|---|---|
| Rhizosphere | Root | Leaf/stem | Flower | Rhizosphere | Root | Leaf/stem | Flower | |
| Stemphylium | 2 | 0 | 3 | 0 | 0 | 0 | 2 | 0 |
| Alternaria | 5 | 2 | 7 | 2 | 6 | 3 | 9 | 2 |
| Boeremia | 2 | 1 | 3 | 1 | 2 | 1 | 5 | 0 |
| Fusarium | 23 | 16 | 9 | 3 | 20 | 18 | 6 | 4 |
| Ilyonectria | 6 | 4 | 0 | 1 | 3 | 1 | 0 | 0 |
| Nectria | 1 | 1 | 0 | 0 | 1 | 0 | 0 | 0 |
| Neoascochyta | 1 | 0 | 0 | 0 | 0 | 0 | 1 | 1 |
| Periconia | 1 | 1 | 1 | 0 | 1 | 0 | 1 | 0 |
| Acremonium | 1 | 0 | 1 | 0 | 1 | 1 | 1 | 0 |
| Ascochyta | 2 | 0 | 2 | 0 | 2 | 0 | 1 | 0 |
| Bipolaris | 0 | 0 | 0 | 0 | 1 | 0 | 1 | 0 |
| Botrytis | 1 | 0 | 0 | 0 | 1 | 1 | 0 | 1 |
| Cercospora | 1 | 1 | 1 | 1 | 1 | 1 | 1 | 1 |
| Clonostachys | 8 | 4 | 2 | 1 | 7 | 3 | 1 | 0 |
| Colletotrichum | 0 | 0 | 1 | 0 | 2 | 0 | 0 | 0 |
| Curvularia | 0 | 0 | 0 | 0 | 1 | 0 | 0 | 0 |
| Cylindrocarpon | 1 | 0 | 0 | 0 | 1 | 0 | 0 | 0 |
| Dendryphion | 1 | 1 | 0 | 0 | 1 | 1 | 1 | 0 |
| Devriesia | 0 | 0 | 0 | 0 | 1 | 1 | 0 | 0 |
| Didymella | 1 | 3 | 1 | 1 | 2 | 2 | 2 | 1 |
| Edenia | 2 | 2 | 1 | 0 | 2 | 1 | 0 | 0 |
| Eocronartium | 4 | 0 | 0 | 0 | 4 | 0 | 0 | 0 |
| Erysiphe | 1 | 0 | 1 | 1 | 1 | 0 | 1 | 1 |
| Erythricium | 1 | 0 | 0 | 0 | 1 | 1 | 1 | 0 |
| Gaeumannomyces | 0 | 0 | 0 | 0 | 1 | 0 | 0 | 0 |
| Gibberella | 11 | 5 | 9 | 0 | 11 | 3 | 5 | 0 |
| Gibellulopsis | 14 | 2 | 3 | 0 | 12 | 2 | 2 | 1 |
| Golovinomyces | 0 | 0 | 0 | 1 | 0 | 0 | 0 | 1 |
| Itersonilia | 1 | 1 | 1 | 0 | 1 | 0 | 0 | 0 |
| Laetisaria | 0 | 0 | 0 | 0 | 1 | 0 | 0 | 0 |
| Lectera | 1 | 1 | 1 | 0 | 1 | 0 | 1 | 0 |
| Leptosphaeria | 1 | 1 | 0 | 0 | 1 | 1 | 0 | 0 |
| Magnaporthiopsis | 1 | 0 | 0 | 0 | 1 | 0 | 0 | 0 |
| Monosporascus | 0 | 1 | 0 | 0 | 2 | 1 | 0 | 0 |
| Mycoleptodiscus | 0 | 0 | 0 | 0 | 0 | 1 | 0 | 0 |
| Mycosphaerella | 0 | 0 | 0 | 0 | 1 | 0 | 0 | 0 |
| Oculimacula | 0 | 0 | 0 | 0 | 0 | 0 | 1 | 0 |
| Plectosphaerella | 15 | 4 | 11 | 0 | 16 | 9 | 15 | 0 |
| Podosphaera | 0 | 0 | 0 | 1 | 0 | 0 | 0 | 1 |
| Powellomyces | 2 | 0 | 0 | 0 | 1 | 0 | 0 | 0 |
| Pyrenophora | 0 | 0 | 1 | 1 | 0 | 0 | 0 | 1 |
| Ramularia | 1 | 0 | 0 | 0 | 1 | 0 | 1 | 0 |
| Septoria | 1 | 0 | 1 | 0 | 1 | 0 | 1 | 0 |
| Slopeiomyces | 3 | 2 | 1 | 0 | 1 | 2 | 0 | 0 |
| Stagonosporopsis | 0 | 0 | 0 | 0 | 1 | 1 | 2 | 0 |
| Thanatephorus | 2 | 1 | 0 | 0 | 2 | 2 | 2 | 0 |
| Volutella | 1 | 0 | 0 | 0 | 0 | 0 | 0 | 0 |
| Ustilaginaceae unclassified | 0 | 0 | 2 | 2 | 2 | 1 | 1 | 0 |
| Sclerotiniaceae unclassified | 0 | 0 | 0 | 1 | 0 | 0 | 0 | 1 |
TABLE A9.
NPMANOVA and ANOSIM (Jaccard dissimilarity matrix, permutations = 999) tested the influence of plant compartments/niches as well as climate change on the microbial functional composition of potential N‐fixing bacteria and pathogenic fungi
| Source of variation/community | Jaccard distance | |||
|---|---|---|---|---|
| Two‐way NPMANOVA | Two‐way ANOSIM | |||
| PseudoF | p | R | p | |
| Potential N‐fixing bacteria | ||||
| Plant compartment | 3.95 | 0.001 | 0.60 | 0.0001 |
| Climate | 0.96 | 0.50 | 0.025 | 0.320 |
| Plant compartment × climate | 1.00 | 0.43 | nd | nd |
| Potential plant pathogenic fungi | ||||
| Plant compartment | 8.69 | 0.001 | 0.903 | 0.001 |
| Climate | 1.51 | 0.101 | 0.019 | 0.378 |
| Plant compartment × climate | 1.01 | 0.397 | nd | nd |
Abbreviation: nd, not detected.
Significant values (p < 0.05) are indicated in bold.
TABLE A10.
NPMANOVA and ANOSIM (Bray–Curtis dissimilarity matrix, permutations = 999) tested the influence of plant compartments/niches, as well as climate change on bacterial community, predicted metabolic functional attributes using Tax4Fun
| Source of variation/community | Bray–Curtis distances | |||
|---|---|---|---|---|
| Two‐way NPMANOVA | Two‐way ANOSIM | |||
| PseudoF | p | R | p | |
| Bacteria | ||||
| Plant compartment | 13.01 | 0.001 | 0.47 | 0.001 |
| Climate | 0.73 | 0.512 | −0.09 | 0.961 |
| Plant compartment × climate | 0.4524 | 0.866 | nd | nd |
Abbreviation: nd, not detected.
Significant values (p < 0.05) are indicated in bold.
TABLE A11.
List of the selected KEGG enzyme‐encoding gene for plant growth‐promoting traits involved in biofertilization (nitrogen fixation, phosphate solubilization, and siderophore synthesis) and biostimulation (indole acetic acid (IAA) production, 1‐aminocyclopropane‐1‐carboxylate (ACC) deaminase activity, and general plant growth‐promoting traits). All data were extracted from the Kyoto Encyclopaedia for Genes and Genomes (KEGG) database www.genome.jp/kegg/
| Function | gene |
|---|---|
| N‐fixation | K00531; nitrogenase [EC:1.18.6.1] |
| K02585; nitrogen fixation protein NifB | |
| K02586; nitrogenase molybdenum‐iron protein alpha chain [EC:1.18.6.1] | |
| K02587; nitrogenase molybdenum‐cofactor synthesis protein NifE | |
| K02588; nitrogenase iron protein NifH [EC:1.18.6.1] | |
| K02589; nitrogen regulatory protein P‐II 1 | |
| K02590; nitrogen regulatory protein P‐II 2 | |
| K02591; nitrogenase molybdenum‐iron protein beta chain [EC:1.18.6.1] | |
| K02592; nitrogenase molybdenum‐iron protein NifN | |
| K02593; nitrogen fixation protein NifT | |
| K02595; nitrogenase‐stabilizing/protective protein | |
| K02596; nitrogen fixation protein NifX | |
| K02597; nitrogen fixation protein NifZ | |
| K02806; PTS system, nitrogen regulatory IIA component [EC:2.7.1.69] | |
| K04488; nitrogen fixation protein NifU and related proteins | |
| K04751; nitrogen regulatory protein P‐II 1 | |
| K04752; nitrogen regulatory protein P‐II 2 | |
| K05521; ADP‐ribosylglycohydrolase [EC:3.2.‐.‐] | |
| K05951; NAD+‐‐‐dinitrogen‐reductase ADP‐D‐ribosyltransferase [EC:2.4.2.37] | |
| K07708; two‐component system, NtrC family, nitrogen regulation sensor histidine kinase GlnL [EC:2.7.13.3] | |
| K07712; two‐component system, NtrC family, nitrogen regulation response regulator GlnG | |
| K10851; nitrogen regulatory protein A | |
| K13598; two‐component system, NtrC family, nitrogen regulation sensor histidine kinase NtrY [EC:2.7.13.3] | |
| K13599; two‐component system, NtrC family, nitrogen regulation response regulator NtrX | |
| K15790; nitrogen fixation protein NifQ | |
| K15861; CRP/FNR family transcriptional regulator, nitrogen fixation regulation protein | |
| K16326; CRP/FNR family transcriptional regulator, putative post‐exponential‐phase nitrogen‐starvation regulator | |
| Siderophore synthesis | K08225; MFS transporter, ENTS family, enterobactin (siderophore) exporter |
| K16090; catecholate siderophore receptor | |
| Indole acetic acid (IAA) production | K01609; indole‐3‐glycerol phosphate synthase [EC:4.1.1.48] |
| K00517; [EC:1.14.‐.‐] | |
| K03397; indoleacetate‐‐‐lysine synthetase [EC:6.3.2.20] | |
| K04103; indolepyruvate decarboxylase [EC:4.1.1.74] | |
| K04090; indolepyruvate ferredoxin oxidoreductase [EC:1.2.7.8] | |
| K13498; indole‐3‐glycerol phosphate synthase / phosphoribosylanthranilate isomerase [EC:4.1.1.48 5.3.1.24] | |
| K00179; indolepyruvate ferredoxin oxidoreductase, alpha subunit [EC:1.2.7.8] | |
| K00180; indolepyruvate ferredoxin oxidoreductase, beta subunit [EC:1.2.7.8] | |
| K00463; indoleamine 2,3‐dioxygenase [EC:1.13.11.52] | |
| K04103; indolepyruvate decarboxylase [EC:4.1.1.74] | |
| 1‐aminocyclopropane‐1‐carboxylate (ACC) activity | K01505; 1‐aminocyclopropane‐1‐carboxylate deaminase [EC:3.5.99.7] |
| General plant growth‐promoting traits | K15320; 6‐methylsalicylic acid synthase [EC:2.3.1.165] |
| K01252; bifunctional isochorismate lyase / aryl carrier protein [EC:3.3.2.1] | |
| K01501; nitrilase [EC:3.5.5.1] | |
| K00466; tryptophan 2‐monooxygenase [EC:1.13.12.3] | |
| K01721; nitrile hydratase [EC:4.2.1.84] | |
| K00817; histidinol‐phosphate aminotransferase [EC:2.6.1.9] | |
| Phosphate solubilization | K00117; quinoprotein glucose dehydrogenase [EC:1.1.5.2] |
| K00115; glucose dehydrogenase (acceptor) [EC:1.1.99.10] | |
| K01083; 3‐phytase [EC:3.1.3.8] | |
| K01093; 4‐phytase / acid phosphatase [EC:3.1.3.26 3.1.3.2] | |
| K01078; acid phosphatase [EC:3.1.3.2] | |
| K01093; 4‐phytase / acid phosphatase [EC:3.1.3.26 3.1.3.2] | |
| K03788; acid phosphatase (class B) [EC:3.1.3.2] | |
| K09474; acid phosphatase (class A) [EC:3.1.3.2] | |
| K09612; alkaline phosphatase isozyme conversion protein [EC:3.4.11.‐] | |
| K01077; alkaline phosphatase [EC:3.1.3.1] | |
| K01113; alkaline phosphatase D [EC:3.1.3.1] | |
| K07658; two‐component system, OmpR family, alkaline phosphatase synthesis response regulator PhoP | |
| K06167; PhnP protein | |
| K01524; exopolyphosphatase / guanosine‐5'‐triphosphate,3'‐diphosphate pyrophosphatase [EC:3.6.1.11 3.6.1.40] | |
| K03430; 2‐aminoethylphosphonate‐pyruvate transaminase [EC:2.6.1.37] | |
| K01126; glycerophosphoryl diester phosphodiesterase [EC:3.1.4.46] |
TABLE A12.
NPMANOVA and ANOSIM (Bray–Curtis dissimilarity matrix, permutations = 999) tested the influence of plant compartments/niches, as well as climate change on bacterial community, predicted metabolic functional involved in plant growth‐promoting (PGP) traits using Tax4Fun
| Source of variation/community | Bray–Curtis distances | |||
|---|---|---|---|---|
| Two‐way NPMANOVA | Two‐way ANOSIM | |||
| PseudoF | p | R | p | |
| Bacteria | ||||
| Plant compartment | 14.76 | 0.001 | 0.45 | 0.001 |
| Climate | 0.97 | 0.374 | −0.05 | 0.853 |
| Plant compartment × climate | 0.67 | 0.671 | nd | nd |
Abbreviation: nd, not detected.
Significant values (p < 0.05) are indicated in bold.
APPENDIX 2.
FIGURE A1.

Aerial view for the Global Change Experimental Facility (GCEF) field research station of the Helmholtz Centre for Environmental Research in Bad Lauchstädt, Saxony‐Anhalt, Germany, photograph taken by Tricklabor Berlin/Service Drone
FIGURE A2.
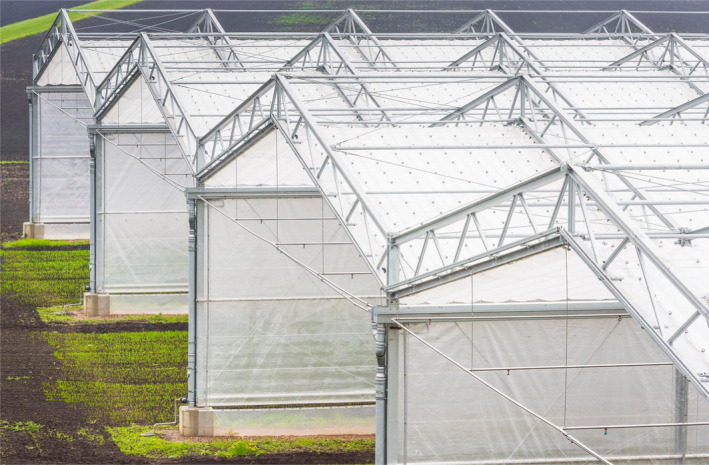
Closed shelters and panels of the future climate plots of the GCEF, photograph taken by UFZ/ André Künzelmann
FIGURE A3.

Effects of climate manipulation on (a) total precipitation (sum of seasons), (b) air temperature in a height of 10 cm (daily mean temperature + standard error), and (c) soil temperature (daily mean temperature + standard error) in a depth of 1 cm in experimental plots managed as extensively used grassland in the GCEF. Precipitation is not manipulated during the winter months. Note that the effects of soil temperature are strongly modulated by indirect effects via the change of vegetation cover (see also Schädler et al., 2019). Thus, the values presented here, are the net result of the direct increase of temperature manipulation and the indirect modulation by the vegetation cover.
FIGURE A4.

Hierarchical clustering and a bar plot of relative abundances of the most abundant (a) bacterial and (b) fungal genera among Trifolium pratense microbiome
FIGURE A5.

Nonmetric multidimensional scaling (NMDS) ordination of variation in bacterial and fungal trophic modes and specific functions of Trifolium pratense in each plant compartment under current and future climate conditions. T. pratense was grown in the grassland ecosystem. The plot is based on Bray–Curtis dissimilarities between microbial communities at the operation taxonomic unit level across 40 samples (permutations = 999). Samples (points) are shaded according to the plant compartment and climate. Ellipses indicate a 95% confidence interval surrounding each group
FIGURE A6.

Venn diagrams showing the distribution of OTUs assigned as potential symbiotic N‐fixing bacteria in each plant compartment under current and future climate conditions
FIGURE A7.

Venn diagrams showing the distribution of OTUs assigned as potential plant pathogenic fungi in each plant compartment under current and future climate conditions
FIGURE A8.

The heat map of normalized relative abundance of metabolic functional profiles of KOs assigned to KEGG pathways within in T. pratense bacterial microbiome using grouped into level‐3 functional categories. All of the functions of genes with an abundance >0.001%. RhC = rhizosphere/current, RhF = rhizosphere/future, RC = root/current, RF = root/future, LC = leaf & stem/current, LF = leaf & stem/future, FC = flower/current, FF = flower/future
FIGURE A9.

Percentage of T. pratense cover in the extensively managed meadow plots of the GCEF subjected to current and future climate scenarios. Error bars indicate the standard error; ♦ represent mean values. The sampling of rhizosphere and plant compartments for microbial analyses were performed in mid‐July 2018
Wahdan, S. F. M. , Tanunchai, B. , Wu, Y.‐T. , Sansupa, C. , Schädler, M. , Dawoud, T. M. , Buscot, F. , & Purahong, W. (2021). Deciphering Trifolium pratense L. holobiont reveals a microbiome resilient to future climate changes. MicrobiologyOpen, 10, e1217. 10.1002/mbo3.1217
François Buscot and Witoon Purahong are senior authors.
Contributor Information
Sara Fareed Mohamed Wahdan, Email: sara-fareed-mohamed.wahdan@ufz.de, Email: sarah_wahdan@science.suez.edu.eg.
Witoon Purahong, Email: sara-fareed-mohamed.wahdan@ufz.de, Email: sarah_wahdan@science.suez.edu.eg, Email: witoon.purahong@ufz.de.
DATA AVAILABILITY STATEMENT
The bacterial 16S and fungal ITS2 raw read sequence datasets are available at the National Center for Biotechnology Information (NCBI) Sequence Read Archive (SRA) under BioProject accession number PRJNA680230: https://www.ncbi.nlm.nih.gov/bioproject/PRJNA680230
REFERENCES
- Abbasi, S. , Safaie, N. , Sadeghi, A. , & Shamsbakhsh, M. (2019). Streptomyces strains induce resistance to Fusarium oxysporum f. sp. lycopersici Race 3 in tomato through different molecular mechanisms. Frontiers in Microbiology, 10, 1505. 10.3389/fmicb.2019.01505 [DOI] [PMC free article] [PubMed] [Google Scholar]
- Ahanger, M. A. , Hashem, A. , Abd‐Allah, E. F. , & Ahmad, P. (2014). Arbuscular mycorrhiza in crop improvement under environmental stress. In Ahmad P. & Rasool S. (Eds.), Emerging technologies and management of crop stress tolerance (pp. 69–95). 10.1016/B978-0-12-800875-1.00003-X [DOI] [Google Scholar]
- Ahkami, A. H. , Allen White, R. , Handakumbura, P. P. , & Jansson, C. (2017). Rhizosphere engineering: Enhancing sustainable plant ecosystem productivity. Rhizosphere, 3, 233–243. 10.1016/j.rhisph.2017.04.012 [DOI] [Google Scholar]
- Al‐Arjani, A. F. , Hashem, A. , & Abd Allah, E. F. (2020). Arbuscular mycorrhizal fungi modulates dynamics tolerance expression to mitigate drought stress in Ephedra foliata Boiss. Saudi Journal of Biological Sciences, 27(1), 380–394. 10.1016/j.sjbs.2019.10.008 [DOI] [PMC free article] [PubMed] [Google Scholar]
- Aleklett, K. , Hart, M. , & Shade, A. (2014). The microbial ecology of flowers: An emerging frontier in phyllosphere research. Botany‐Botanique, 92(4), 253–266. 10.1139/cjb-2013-0166 [DOI] [Google Scholar]
- Allison, S. D. , & Martiny, J. B. H. (2008). Resistance, resilience, and redundancy in microbial communities. Proceedings of the National Academy of Sciences USA, 105, 11512–11519. 10.1073/pnas.0801925105 [DOI] [PMC free article] [PubMed] [Google Scholar]
- Altermann, M. , Rinklebe, J. , Merbach, I. , Körschens, M. , Langer, U. , & Hofmann, B. (2005). Chernozem—soil of the year 2005. Journal of Plant Nutrition and Soil Science, 168(6), 725–740. 10.1002/jpln.200521814 [DOI] [Google Scholar]
- Anderson, M. J. (2001). A new method for non‐parametric multivariate analysis of variance. Austral Ecology, 26, 32–46. [Google Scholar]
- Aßhauer, K. P. , Wemheuer, B. , Daniel, R. , & Meinicke, P. (2015). Tax4Fun: Predicting functional profiles from metagenomic 16S rRNA data. Bioinformatics, 31(17), 2882–2884. 10.1093/bioinformatics/btv287 [DOI] [PMC free article] [PubMed] [Google Scholar]
- Bakker, P. A. , Pieterse, C. M. , & Van Loon, L. C. (2007). Induced systemic resistance by fluorescent Pseudomonas spp. Phytopathology, 97, 239–243. [DOI] [PubMed] [Google Scholar]
- Banerjee, D. , Strobel, G. A. , Booth, E. , Geary, B. , Sears, J. , Spakowicz, D. , & Busse, S. (2010). An endophytic Myrothecium inundatum producing volatile organic compounds. Mycosphere, 1, 229–240. [Google Scholar]
- Barillot, C. D. C. , Sarde, C.‐O. , Bert, V. , Tarnaud, E. , & Cochet, N. (2012). A standardized method for the sampling of rhizosphere and rhizoplan soil bacteria associated to a herbaceous root system. Annals of Microbiology, 63(2), 471–476. 10.1007/s13213-012-0491-y [DOI] [Google Scholar]
- Beckers, B. , Op De Beeck, M. , Thijs, S. , Truyens, S. , Weyens, N. , Boerjan, W. , & Vangronsveld, J. (2016). Performance of 16s rDNA primer pairs in the study of rhizosphere and endosphere bacterial microbiomes in metabarcoding studies. Frontiers in Microbiology, 7, 650. 10.3389/fmicb.2016.00650 [DOI] [PMC free article] [PubMed] [Google Scholar]
- Beckers, B. , Op De Beeck, M. , Weyens, N. , Boerjan, W. , & Vangronsveld, J. (2017). Structural variability and niche differentiation in the rhizosphere and endosphere bacterial microbiome of field‐grown poplar trees. Microbiome, 5(1), 25. 10.1186/s40168-017-0241-2 [DOI] [PMC free article] [PubMed] [Google Scholar]
- Berendsen, R. L. , Pieterse, C. M. , & Bakker, P. A. (2012). The rhizosphere microbiome and plant health. Trends in Plant Science, 17(8), 478–486. 10.1016/j.tplants.2012.04.001 [DOI] [PubMed] [Google Scholar]
- Berg, G. , Rybakova, D. , Grube, M. , & Koberl, M. (2016). The plant microbiome explored: Implications for experimental botany. Journal of Experimental Botany, 67(4), 995–1002. 10.1093/jxb/erv466 [DOI] [PMC free article] [PubMed] [Google Scholar]
- Bodenhausen, N. , Horton, M. W. , & Bergelson, J. (2013). Bacterial communities associated with the leaves and the roots of Arabidopsis thaliana . PLoS One, 8(2), e56329. 10.1371/journal.pone.0056329 [DOI] [PMC free article] [PubMed] [Google Scholar]
- Brown, S. P. , Grillo, M. A. , Podowski, J. C. , & Heath, K. D. (2020). Soil origin and plant genotype structure distinct microbiome compartments in the model legume Medicago truncatula . Microbiome, 8, 139. 10.21203/rs.3.rs-21175/v1 [DOI] [PMC free article] [PubMed] [Google Scholar]
- Bulgarelli, D. , Rott, M. , Schlaeppi, K. , Ver Loren van Themaat, E. , Ahmadinejad, N. , Assenza, F. , Rauf, P. , Huettel, B. , Reinhardt, R. , Schmelzer, E. , Peplies, J. , Gloeckner, F. O. , Amann, R. , Eickhorst, T. , & Schulze‐Lefert, P. (2012). Revealing structure and assembly cues for Arabidopsis root‐inhabiting bacterial microbiota. Nature, 488(7409), 91–95. 10.1038/nature11336 [DOI] [PubMed] [Google Scholar]
- Bulgarelli, D. , Schlaeppi, K. , Spaepen, S. , Loren, V. , van Themaat, E. , & Schulze‐Lefert, P. (2013). Structure and functions of the bacterial microbiota of plants. Annual Review of Plant Biology, 64, 807–838. 10.1146/annurev-arplant-050312-120106 [DOI] [PubMed] [Google Scholar]
- Busby, P. E. , Ridout, M. , & Newcombe, G. (2016). Fungal endophytes: Modifiers of plant disease. Plant Molecular Biology, 90(6), 645–655. 10.1007/s11103-015-0412-0 [DOI] [PubMed] [Google Scholar]
- Caspi‐Fluger, A. , Inbar, M. , Mozes‐Daube, N. , Katzir, N. , Portnoy, V. , Belausov, E. , Hunter, M. S. , & Zchori‐Fein, E. (2012). Horizontal transmission of the insect symbiont Rickettsia is plant‐mediated. Proceedings of the Royal Society B: Biological Sciences, 279(1734), 1791–1796. 10.1098/rspb.2011.2095 [DOI] [PMC free article] [PubMed] [Google Scholar]
- Chelius, M. K. , & Triplett, E. W. (2001). The diversity of archaea and bacteria in association with the roots of Zea mays L. Microbial Ecology, 41(3), 252–263. 10.1007/s002480000087 [DOI] [PubMed] [Google Scholar]
- Coleman‐Derr, D. , Desgarennes, D. , Fonseca‐Garcia, C. , Gross, S. , Clingenpeel, S. , Woyke, T. , North, G. , Visel, A. , Partida‐Martinez, L. P. , & Tringe, S. G. (2016). Plant compartment and biogeography affect microbiome composition in cultivated and native Agave species. New Phytologist, 209(2), 798–811. 10.1111/nph.13697 [DOI] [PMC free article] [PubMed] [Google Scholar]
- Coon, J. T. , Pittler, M. H. , & Ernst, E. (2007). Trifolium pratense isoflavones in the treatment of menopausal hot flushes: A systematic review and meta‐analysis. Phytomedicine, 14(2–3), 153–159. 10.1016/j.phymed.2006.12.009 [DOI] [PubMed] [Google Scholar]
- Cregger, M. A. , Veach, A. M. , Yang, Z. K. , Crouch, M. J. , Vilgalys, R. , Tuskan, G. A. , & Schadt, C. W. (2018). The Populus holobiont: Dissecting the effects of plant niches and genotype on the microbiome. Microbiome, 6(1), 31. 10.1186/s40168-018-0413-8 [DOI] [PMC free article] [PubMed] [Google Scholar]
- Cruz de Carvalho, M. H. (2008). Drought stress and reactive oxygen species: Production, scavenging and signaling. Plant Signaling & Behavior, 3, 156–165. 10.4161/psb.3.3.5536 [DOI] [PMC free article] [PubMed] [Google Scholar]
- De Cáceres, M. , & Legendre, P. (2009). Associations between species and groups of sites: indices and statistical inference. Ecology, 90(12), 3566–3574. 10.1890/08-1823.1 [DOI] [PubMed] [Google Scholar]
- de Mendiburu, F. (2016). Agricolae: Statistical procedures for agricultural research. https://cran.r‐project.org/package=agricolae
- De Vega, J. J. , Ayling, S. , Hegarty, M. , Kudrna, D. , Goicoechea, J. L. , Ergon, Å. , Rognli, O. A. , Jones, C. , Swain, M. , Geurts, R. , Lang, C. , Mayer, K. F. X. , Rössner, S. , Yates, S. , Webb, K. J. , Donnison, I. S. , Oldroyd, G. E. D. , Wing, R. A. , Caccamo, M. , … Skøt, L. (2015). Red clover (Trifolium pratense L.) draft genome provides a platform for trait improvement. Scientific Reports, 5, 17394. 10.1038/srep17394 [DOI] [PMC free article] [PubMed] [Google Scholar]
- De Vrieze, J. , Pinto, A. J. , Sloan, W. T. , & Ijaz, U. Z. (2018). The active microbial community more accurately reflects the anaerobic digestion process: 16S rRNA (gene) sequencing as a predictive tool. Microbiome, 6(1), 63. 10.1186/s40168-018-0449-9 [DOI] [PMC free article] [PubMed] [Google Scholar]
- Delgado‐Baquerizo, M. , Guerra, C. A. , Cano‐Díaz, C. , Egidi, E. , Wang, J.‐T. , Eisenhauer, N. , Singh, B. K. , & Maestre, F. T. (2020). The proportion of soil‐borne pathogens increases with warming at the global scale. Nature Climate Change, 10(6), 550–554. 10.1038/s41558-020-0759-3 [DOI] [Google Scholar]
- Döscher, R. , Willén, U. , Jones, C. , Rutgersson, A. , Meier, H. E. M. , Hansson, U. , & Graham, L. P. (2002). The development of the regional coupled ocean‐atmosphere model RCAO. Boreal Environment Research, 7, 183–192. [Google Scholar]
- Edgar, R. C. , Haas, B. J. , Clemente, J. C. , Quince, C. , & Knight, R. (2011). UCHIME improves sensitivity and speed of chimera detection. Bioinformatics, 27(16), 2194–2200. 10.1093/bioinformatics/btr381 [DOI] [PMC free article] [PubMed] [Google Scholar]
- Fonseca‐Garcia, C. , Coleman‐Derr, D. , Garrido, E. , Visel, A. , Tringe, S. G. , & Partida‐Martinez, L. P. (2016). The cacti microbiome: Interplay between habitat‐filtering and host‐specificity. Frontiers in Microbiology, 7, 150. 10.3389/fmicb.2016.00150 [DOI] [PMC free article] [PubMed] [Google Scholar]
- Franklin, J. , Serra‐Diaz, J. M. , Syphard, A. D. , & Regan, H. M. (2016). Global change and terrestrial plant community dynamics. Proceedings of the National Academy of Sciences, 113(14), 3725–3734. 10.1073/pnas.1519911113 [DOI] [PMC free article] [PubMed] [Google Scholar]
- Fu, L. , Niu, B. , Zhu, Z. , Wu, S. , & Li, W. (2012). CD‐HIT: Accelerated for clustering the next‐generation sequencing data. Bioinformatics, 28(23), 3150–3152. 10.1093/bioinformatics/bts565 [DOI] [PMC free article] [PubMed] [Google Scholar]
- Fustec, J. , Lesuffleur, F. , Mahieu, S. , & Cliquet, J.‐B. (2010). Nitrogen rhizodeposition of legumes. A review. Agronomy for Sustainable Development, 30(1), 57–66. 10.1051/agro/2009003 [DOI] [Google Scholar]
- Gargouri, M. , Karray, F. , Chebaane, A. , Mhiri, N. , Partida‐Martinez, L. P. , Sayadi, S. , & Mliki, A. (2021). Increasing aridity shapes beta diversity and the network dynamics of the belowground fungal microbiome associated with Opuntia ficus‐indica . Science of the Total Environment, 773, 145008. 10.1016/j.scitotenv.2021.145008 [DOI] [PubMed] [Google Scholar]
- Gaube, P. , Junker, R. R. , & Keller, A. (2021). Changes amid constancy: Flower and leaf microbiomes along land use gradients and between bioregions. Basic and Applied Ecology, 50, 1–15. 10.1016/j.baae.2020.10.003 [DOI] [Google Scholar]
- Goren‐Saglam, N. , Harrison, E. , Breeze, E. , Oz, G. , & Buchanan‐Wollaston, V. (2020). Analysis of the impact of indole‐3‐acetic acid (IAA) on gene expression during leaf senescence in Arabidopsis thaliana . Physiology and Molecular Biology of Plants, 26(4), 733–745. 10.1007/s12298-019-00752-7 [DOI] [PMC free article] [PubMed] [Google Scholar]
- Gouda, S. , Das, G. , Sen, S. K. , Shin, H. S. , & Patra, J. K. (2016). Endophytes: A treasure house of bioactive compounds of medicinal importance. Frontiers in Microbiology, 7, 1538. 10.3389/fmicb.2016.01538 [DOI] [PMC free article] [PubMed] [Google Scholar]
- Gutiérrez Boem, F. H. , Rubio, G. , & Barbero, D. (2011). Soil phosphorus extracted by Bray 1 and Mehlich 3 soil tests as affected by the soil/solution ratio in Mollisols. Communications in Soil Science and Plant Analysis, 42(2), 220–230. 10.1080/00103624.2011.535072 [DOI] [Google Scholar]
- Hacquard, S. (2016). Disentangling the factors shaping microbiota composition across the plant holobiont. New Phytologist, 209(2), 454–457. 10.1111/nph.13760 [DOI] [PubMed] [Google Scholar]
- Hameed, A. , Wu, Q.‐S. , Abd‐Allah, E. F. , Hashem, A. , Kumar, A. , Lone, H. A. , & Ahmad, P. (2014). Role of AM fungi in alleviating drought stress in plants. In Miransari M (Ed.), Use of microbes for the alleviation of soil stresses (pp. 55–75). New York: Springer. [Google Scholar]
- Hammer, Ø. , Harper, D. A. T. , & Ryan, P. D. (2001). PAST: Paleontological statistics software package for education and data analysis. Palaeontologia Electronica, 4, 1–9. [Google Scholar]
- Hamonts, K. , Trivedi, P. , Garg, A. , Janitz, C. , Grinyer, J. , Holford, P. , Botha, F. C. , Anderson, I. C. , & Singh, B. K. (2018). Field study reveals core plant microbiota and relative importance of their drivers. Environmental Microbiology, 20(1), 124–140. 10.1111/1462-2920.14031 [DOI] [PubMed] [Google Scholar]
- Haney, C. H. , Samuel, B. S. , Bush, J. , & Ausubel, F. M. (2015). Associations with rhizosphere bacteria can confer an adaptive advantage to plants. Nature Plants, 1(6), 15051. 10.1038/nplants.2015.51 [DOI] [PMC free article] [PubMed] [Google Scholar]
- Hanna, M. , Janne, K. , Perttu, V. , & Helena, K. (2018). Gaps in the capacity of modern forage crops to adapt to the changing climate in northern Europe. Mitigation and Adaptation Strategies for Global Change, 23(1), 81–100. 10.1007/s11027-016-9729-5 [DOI] [PMC free article] [PubMed] [Google Scholar]
- Hartman, K. , van der Heijden, M. G. , Roussely‐Provent, V. , Walser, J. C. , & Schlaeppi, K. (2017). Deciphering composition and function of the root microbiome of a legume plant. Microbiome, 5(1), 2. 10.1186/s40168-016-0220-z [DOI] [PMC free article] [PubMed] [Google Scholar]
- Hartmann, A. , Rothballer, M. , & Schmid, M. (2007). Lorenz Hiltner, a pioneer in rhizosphere microbial ecology and soil bacteriology research. Plant and Soil, 312(1–2), 7–14. 10.1007/s11104-007-9514-z [DOI] [Google Scholar]
- Hayat, R. , Ali, S. , Amara, U. , Khalid, R. , & Ahmed, I. (2010). Soil beneficial bacteria and their role in plant growth promotion: A review. Annals of Microbiology, 60(4), 579–598. 10.1007/s13213-010-0117-1 [DOI] [Google Scholar]
- Hofer, D. , Suter, M. , Haughey, E. , Finn, J. A. , Hoekstra, N. J. , Buchmann, N. , & Lüscher, A. (2016). Yield of temperate forage grassland species is either largely resistant or resilient to experimental summer drought. Journal of Applied Ecology, 53(4), 1023–1034. 10.1111/1365-2664.12694 [DOI] [Google Scholar]
- Ikram, M. , Ali, N. , Jan, G. , Jan, F. G. , Rahman, I. U. , Iqbal, A. , & Hamayun, M. (2018). IAA producing fungal endophyte Penicillium roqueforti Thom., enhances stress tolerance and nutrients uptake in wheat plants grown on heavy metal contaminated soils. PLoS One, 13(11), e0208150. 10.1371/journal.pone.0208150 [DOI] [PMC free article] [PubMed] [Google Scholar]
- Jacob, D. , & Podzun, R. (1997). Sensitivity studies with the regional climate model REMO. Meteorology and Atmospheric Physics, 63, 119–129. 10.1007/BF01025368 [DOI] [Google Scholar]
- Jaemsaeng, R. , Jantasuriyarat, C. , & Thamchaipenet, A. (2018). Positive role of 1‐aminocyclopropane‐1‐carboxylate deaminase‐producing endophytic Streptomyces sp. GMKU 336 on flooding resistance of mung bean. Agriculture and Natural Resources, 52(4), 330–334. 10.1016/j.anres.2018.09.008 [DOI] [Google Scholar]
- Karray, F. , Gargouri, M. , Chebaane, A. , Mhiri, N. , Mliki, A. , & Sayadi, S. (2020). Climatic aridity gradient modulates the diversity of the rhizosphere and endosphere bacterial microbiomes of Opuntia ficus‐indica . Frontiers in Microbiology, 11, 1622. 10.3389/fmicb.2020.01622 [DOI] [PMC free article] [PubMed] [Google Scholar]
- Kjærgaard, T. (2003). A plant that changed the world: The rise and fall of clover 1000–2000. Landscape Research, 28(1), 41–49. 10.1080/01426390306531 [DOI] [Google Scholar]
- Kõljalg, U. , Nilsson, R. H. , Abarenkov, K. , Tedersoo, L. , Taylor, A. F. S. , Bahram, M. , Bates, S. T. , Bruns, T. D. , Bengtsson‐Palme, J. , Callaghan, T. M. , Douglas, B. , Drenkhan, T. , Eberhardt, U. , Dueñas, M. , Grebenc, T. , Griffith, G. W. , Hartmann, M. , Kirk, P. M. , Kohout, P. , … Larsson, K.‐H. (2013). Towards a unified paradigm for sequence‐based identification of fungi. Molecular Ecology, 22, 5271–5277. 10.1111/mec.12481 [DOI] [PubMed] [Google Scholar]
- Kumari, S. , Nagendran, K. , Rai, A. B. , Singh, B. , Rao, G. P. , & Bertaccini, A. (2019). Global status of phytoplasma diseases in vegetable crops. Frontiers in Microbiology, 10, 1349. 10.3389/fmicb.2019.01349 [DOI] [PMC free article] [PubMed] [Google Scholar]
- Lazzarini, A. , Cavaletti, L. , Toppo, G. , & Marinelli, F. (2000). Rare genera of actinomycetes as potential producers of new antibiotics. Antonie van Leeuwenhoek, 78, 399–405. [PubMed] [Google Scholar]
- Leung, A. Y. , & Foster, S. (1996). Clover tops, red (2nd ed.). Wiley. [Google Scholar]
- Liang, J.‐L. , Liu, J. , Jia, P. U. , Yang, T.‐T. , Zeng, Q.‐W. , Zhang, S.‐C. , Liao, B. , Shu, W.‐S. , & Li, J.‐T. (2020). Novel phosphate‐solubilizing bacteria enhance soil phosphorus cycling following ecological restoration of land degraded by mining. ISME Journal, 14(6), 1600–1613. 10.1038/s41396-020-0632-4 [DOI] [PMC free article] [PubMed] [Google Scholar]
- Lin, L.‐Z. , He, X.‐G. , Lindenmaier, M. , Yang, J. , Cleary, M. , Qiu, S.‐X. , & Cordell, G. A. (2000). C‐ESI‐MS study of the flavonoid glycoside malonates of red clover (Trifolium pratense). Journal of Agriculture and Food Chemistry, 48, 354–365. [DOI] [PubMed] [Google Scholar]
- Liu, X. Y. , Wang, E. T. , Li, Y. , & Chen, W. X. (2007). Diverse bacteria isolated from root nodules of Trifolium, Crotalaria and Mimosa grown in the subtropical regions of China. Archives of Microbiology, 188(1), 1–14. 10.1007/s00203-007-0209-x [DOI] [PubMed] [Google Scholar]
- Louca, S. , Parfrey, L. W. , & Doebeli, M. (2016). Decoupling function and taxonomy in the global ocean microbiome. Science, 353, 1272–1277. 10.1126/science.aaf4507 [DOI] [PubMed] [Google Scholar]
- Lupwayi, N. Z. , Clayton, G. W. , O’Donovan, J. T. , Harker, K. N. , Turkington, T. K. , & Soon, Y. K. (2006). Nitrogen release during decomposition of crop residues under conventional and zero tillage. Canadian Journal of Soil Science, 86(1), 11–19. 10.4141/S05-015 [DOI] [Google Scholar]
- Madaj, A.‐M. , Michalski, S. G. , & Durka, W. (2020). Establishment rate of regional provenances mirrors relative share and germination rate in a climate change experiment. Ecosphere, 11(3), e03093. 10.1002/ecs2.3093 [DOI] [Google Scholar]
- Mangamuri, U. K. , Muvva, V. , Poda, S. , Chitturi, B. , & Yenamandra, V. (2016). Bioactive natural products from Pseudonocardia endophytica VUK‐10. Journal of Genetic Engineering and Biotechnology, 14(2), 261–267. 10.1016/j.jgeb.2016.10.002 [DOI] [PMC free article] [PubMed] [Google Scholar]
- Marasco, R. , Rolli, E. , Fusi, M. , Michoud, G. , & Daffonchio, D. (2018). Grapevine rootstocks shape underground bacterial microbiome and networking but not potential functionality. Microbiome, 6(1), 3. 10.1186/s40168-017-0391-2 [DOI] [PMC free article] [PubMed] [Google Scholar]
- Marilley, L. , & Aragno, M. (1999). Phylogenetic diversity of bacterial communities differing in degree of proximity of Lolium perenne and Trifolium repens roots. Applied Soil Ecology, 13(2), 127–136. 10.1016/S0929-1393(99)00028-1 [DOI] [Google Scholar]
- Martin, M. (2011). Cutadapt removes adapter sequences from high‐throughput sequencing reads. EMBnet.journal, 17(1), 10–12. 10.14806/ej.17.1.200 [DOI] [Google Scholar]
- Masella, A. P. , Bartram, A. K. , Truszkowski, J. M. , Brown, D. G. , & Neufeld, J. D. (2012). PANDAseq: Paired‐end assembler for illumina sequences. BMC Bioinformatics, 13(31), 31. 10.1186/1471-2105-13-31 [DOI] [PMC free article] [PubMed] [Google Scholar]
- McKenna, P. , Cannon, N. , Conway, J. , Dooley, J. , & Davies, W. P. (2018). Red clover (Trifolium pratense) in conservation agriculture: A compelling case for increased adoption. International Journal of Agricultural Sustainability, 16(4–5), 342–366. 10.1080/14735903.2018.1498442 [DOI] [Google Scholar]
- Mekala, S. , & Polepongu, S. (2019). Impact of climate change on soil microbial community. In Varma A., Tripathi S., & Prasad R. (Eds.), Plant biotic interactions: State of the art (pp. 31–41). Springer International Publishing. [Google Scholar]
- Mendes, R. , Kruijt, M. , de Bruijn, I. , Dekkers, E. , van der Voort, M. , Schneider, J. H. M. , Piceno, Y. M. , DeSantis, T. Z. , Andersen, G. L. , Bakker, P. A. H. M. , & Raaijmakers, J. M. (2011). Deciphering the rhizosphere microbiome for disease‐suppressive bacteria. Science, 332, 1097–1100. 10.1126/science.1203980 [DOI] [PubMed] [Google Scholar]
- Nguyen, N. H. , Song, Z. , Bates, S. T. , Branco, S. , Tedersoo, L. , Menke, J. , Schilling, J. S. , & Kennedy, P. G. (2016). FUNGuild: An open annotation tool for parsing fungal community datasets by ecological guild. Fungal Ecology, 20, 241–248. 10.1016/j.funeco.2015.06.006 [DOI] [Google Scholar]
- Novakova, E. , Hypsa, V. , & Moran, N. A. (2009). Arsenophonus, an emerging clade of intracellular symbionts with a broad host distribution. BMC Microbiology, 9, 143. 10.1186/1471-2180-9-143 [DOI] [PMC free article] [PubMed] [Google Scholar]
- Oksanen, J. , Blanchet, F. G. , Friendly, M. , Kindt, R. , Legendre, P. , McGlinn, D. , Minchin, P. R. , O’Hara, R. B. , Simpson, G. L. , Solymos, P. , Stevens, M. H. H. , Szöcs, E. , & Wagner, H. (2019). vegan: Community Ecology Package. R Package Version 2.5‐6. https://CRAN.R‐project.org/package=vegan
- Pangesti, N. , Pineda, A. , Hannula, S. E. , & Bezemer, T. M. (2020). Soil inoculation alters the endosphere microbiome of chrysanthemum roots and leaves. Plant and Soil, 455, 107–119. 10.1007/s11104-020-04655-5 [DOI] [Google Scholar]
- Paynel, F. , Lesuffleur, F. , Bigot, J. , Diquélou, S. , & Cliquet, J.‐B. (2008). A study of 15N transfer between legumes and grasses. Agronomy for Sustainable Development, 28(2), 281–290. 10.1051/agro:2007061 [DOI] [Google Scholar]
- Quast, C. , Pruesse, E. , Yilmaz, P. , Gerken, J. , Schweer, T. , Yarza, P. , Peplies, J. , & Glöckner, F. O. (2013). The SILVA ribosomal RNA gene database project: Improved data processing and web‐based tools. Nucleic Acids Research, 41(Database issue), D590–D596. 10.1093/nar/gks1219 [DOI] [PMC free article] [PubMed] [Google Scholar]
- R‐Development‐Core‐Team . (2019). R: A language and environment for statistical computing. Foundation for Statistical Computing. [Google Scholar]
- Ritpitakphong, U. , Falquet, L. , Vimoltust, A. , Berger, A. , Métraux, J.‐P. , & L'Haridon, F. (2016). The microbiome of the leaf surface of Arabidopsis protects against a fungal pathogen. New Phytologist, 210(3), 1033–1043. 10.1111/nph.13808 [DOI] [PubMed] [Google Scholar]
- Rockel, B. , Will, A. , & Hense, A. (2008). The regional climate model COSMO‐CLM (CCLM). Meteorologische Zeitschrift, 17(4), 347–348. 10.1127/0941-2948/2008/0309 [DOI] [Google Scholar]
- Rosenberg, E. , & Zilber‐Rosenberg, I. (2018). The hologenome concept of evolution after 10 years. Microbiome, 6(1), 78. 10.1186/s40168-018-0457-9 [DOI] [PMC free article] [PubMed] [Google Scholar]
- Schädler, M. , Buscot, F. , Klotz, S. , Reitz, T. , Durka, W. , Bumberger, J. , Merbach, I. , Michalski, S. G. , Kirsch, K. , Remmler, P. , Schulz, E. , & Auge, H. (2019). Investigating the consequences of climate change under different land‐use regimes: A novel experimental infrastructure. Ecosphere, 10, e02635. 10.1002/ecs2.2635 [DOI] [Google Scholar]
- Schloss, P. D. , Westcott, S. L. , Ryabin, T. , Hall, J. R. , Hartmann, M. , Hollister, E. B. , Lesniewski, R. A. , Oakley, B. B. , Parks, D. H. , Robinson, C. J. , Sahl, J. W. , Stres, B. , Thallinger, G. G. , Van Horn, D. J. , & Weber, C. F. (2009). Introducing mothur: open‐source, platform‐independent, community‐supported software for describing and comparing microbial communities. Applied and Environment Microbiology, 75(23), 7537–7541. 10.1128/AEM.01541-09 [DOI] [PMC free article] [PubMed] [Google Scholar]
- Schmidhuber, J. , & Tubiello, F. N. (2007). Global food security under climate change. Proceedings of the National Academy of Sciences of the United States of America, 104(50), 19703–19708. 10.1073/pnas.0701976104 [DOI] [PMC free article] [PubMed] [Google Scholar]
- Schulz, B. , & Boyle, C. (2006). What are endophytes?. Springer‐Verlag. [Google Scholar]
- Shariati, J. V. , Malboobi, M. A. , Tabrizi, Z. , Tavakol, E. , Owlia, P. , & Safari, M. (2017). Comprehensive genomic analysis of a plant growth‐promoting rhizobacterium Pantoea agglomerans strain P5. Scientific Reports, 7(1), 15610. 10.1038/s41598-017-15820-9 [DOI] [PMC free article] [PubMed] [Google Scholar]
- Sheaffer, C. C. , & Seguin, P. (2008). Forage legumes for sustainable cropping systems. Journal of Crop Production, 8(1–2), 187–216. 10.1300/J144v08n01_08 [DOI] [Google Scholar]
- Trivedi, P. , Leach, J. E. , Tringe, S. G. , Sa, T. , & Singh, B. K. (2020). Plant‐microbiome interactions: From community assembly to plant health. Nature Reviews Microbiology, 18(11), 607–621. 10.1038/s41579-020-0412-1 [DOI] [PubMed] [Google Scholar]
- Turner, T. R. , James, E. K. , & Poole, P. S. (2013). The plant microbiome. Genome Biology, 14(6), 209. 10.1186/gb-2013-14-6-209 [DOI] [PMC free article] [PubMed] [Google Scholar]
- Van de Poel, B. , & Van Der Straeten, D. (2014). 1‐aminocyclopropane‐1‐carboxylic acid (ACC) in plants: More than just the precursor of ethylene! Frontiers in Plant Science, 5, 640. 10.3389/fpls.2014.00640 [DOI] [PMC free article] [PubMed] [Google Scholar]
- Vandenkoornhuyse, P. , Quaiser, A. , Duhamel, M. , Le Van, A. , & Dufresne, A. (2015). The importance of the microbiome of the plant holobiont. New Phytologist, 206(4), 1196–1206. 10.1111/nph.13312 [DOI] [PubMed] [Google Scholar]
- Vannette, R. L. (2020). The floral microbiome: Plant, pollinator, and microbial perspectives. Annual Review of Ecology, Evolution, and Systematics, 51(1), 363–386. 10.1146/annurev-ecolsys-011720-013401 [DOI] [Google Scholar]
- Voolstra, C. R. , & Ziegler, M. (2020). Adapting with microbial help: Microbiome flexibility facilitates rapid responses to environmental change. BioEssays, 42(7), e2000004. 10.1002/bies.202000004 [DOI] [PubMed] [Google Scholar]
- Wagner, M. R. , Lundberg, D. S. , Del Rio, T. G. , Tringe, S. G. , Dangl, J. L. , & Mitchell‐Olds, T. (2016). Host genotype and age shape the leaf and root microbiomes of a wild perennial plant. Nature Communications, 7, 12151. 10.1038/ncomms12151 [DOI] [PMC free article] [PubMed] [Google Scholar]
- Wahdan, S. , Hossen, S. , Tanunchai, B. , Schädler, M. , Buscot, F. , & Purahong, W. (2020). Future climate significantly alters fungal plant pathogen dynamics during the early phase of wheat litter decomposition. Microorganisms, 8(6), 908. 10.3390/microorganisms8060908 [DOI] [PMC free article] [PubMed] [Google Scholar]
- Wahdan, S. F. M. , Reitz, T. , Heintz‐Buschart, A. , Schädler, M. , Roscher, C. , Breitkreuz, C. , Schnabel, B. , Purahong, W. , & Buscot, F. (2021). Organic agricultural practice enhances arbuscular mycorrhizal symbiosis in correspondence to soil warming and altered precipitation patterns. Environmental Microbiology. 10.1111/1462-2920.15492. in press. [DOI] [PubMed] [Google Scholar]
- White, T. J. , Bruns, T. D. , Lee, S. B. , & Taylor, J. W. (1990). Amplification and direct sequencing of fungal ribosomal RNA genes for phylogenetics. In Innis M. A., Gelfand D. H., Sninsky J. J., & White T. J. (Eds.), PCR protocols: A guide to methods and applications (pp. 315–322). Academic Press. [Google Scholar]
- Yakti, W. , Kovacs, G. M. , & Franken, P. (2019). Differential interaction of the dark septate endophyte Cadophora sp. and fungal pathogens in vitro and in planta. FEMS Microbiology Ecology, 95(12), fiz164. 10.1093/femsec/fiz164 [DOI] [PMC free article] [PubMed] [Google Scholar]
- Yin, R. , Eisenhauer, N. , Auge, H. , Purahong, W. , Schmidt, A. , & Schädler, M. (2019). Additive effects of experimental climate change and land use on faunal contribution to litter decomposition. Soil Biology & Biochemistry, 131, 141–148. 10.1016/j.soilbio.2019.01.009 [DOI] [Google Scholar]
- Zarraonaindia, I. , Owens, S. M. , Weisenhorn, P. , West, K. , Hampton‐Marcell, J. , Lax, S. , Bokulich, N. A. , Mills, D. A. , Martin, G. , Taghavi, S. , van der Lelie, D. , & Gilbert, J. A. (2015). The soil microbiome influences grapevine‐associated microbiota. mBio, 6(2), e02527‐14. 10.1128/mBio.02527-14 [DOI] [PMC free article] [PubMed] [Google Scholar]
- Zheng, Y. , & Gong, X. (2019). Niche differentiation rather than biogeography shapes the diversity and composition of microbiome of Cycas panzhihuaensis . Microbiome, 7(1), 152. 10.1186/s40168-019-0770-y [DOI] [PMC free article] [PubMed] [Google Scholar]
Associated Data
This section collects any data citations, data availability statements, or supplementary materials included in this article.
Data Availability Statement
The bacterial 16S and fungal ITS2 raw read sequence datasets are available at the National Center for Biotechnology Information (NCBI) Sequence Read Archive (SRA) under BioProject accession number PRJNA680230: https://www.ncbi.nlm.nih.gov/bioproject/PRJNA680230