

Abstract
Evolution explains both the unity and the diversity of all organisms, and developing students’ ability to represent and communicate evolutionary relationships is an important component of a complete biology education. We present a series of student-centered, exploratory activities to help students develop their tree-thinking skills. In these activities, students use complementary phenotypic and molecular data to explore how to build phylogenetic trees and interpret the evolutionary relationships they represent. This learning module is designed to engage students in the process of science, provide them with active learning experiences using online bioinformatics tools, and foster their appreciation for the evolutionary connections across the tree of life.
Keywords: tree-thinking, cladogram, DNA sequences, evolution, bioinformatics, inquiry
Introduction
Understanding the evolutionary relationships among organisms is a central goal of biology (Darwin, 1859; Dobzhansky, 1973; Schluter, 2000; Grant & Grant, 2011) and a key component of a complete biology education (Baum et al., 2005; Gregory, 2008; Meisel, 2010; Young et al., 2013). Phylogenetic trees are one of the most important tools that evolutionary biologists use to depict the hypothesized relationships among a set of species. Because phylogenies illustrate the key evolutionary concept that all living organisms are connected through common ancestry, understanding phylogenies is critical for understanding evolution (Baum & Offner, 2008).
Numerous studies have shown that students have difficulty interpreting phylogenetic trees and understanding the evolutionary relationships they represent (Meir et al., 2007; Gregory, 2008; Halverson, 2011; Catley et al., 2013; Dees et al., 2014; Blacquiere & Hoese, 2016; Kummer et al., 2016). For example, many students misinterpret phylogenetic trees by reading the order of species along the tips (usually from left to right) to infer relatedness, and therefore make the common mistake of assuming that “primitive” species on the left give rise to “advanced” specie on the right (Meir et al., 2007; Omland et al., 2008; Meisel, 2010). Similarly, many students get distracted by the shape of the tree and erroneously assume that species that appear in clos proximity at the tips of the tree are more closely related than those further apart (Baum et al., 2005; Meir et al., 2007; Baum & Offner, 2008). The correct way to interpret a phylogenetic tree is as a set of nested hierarchies: trees can be rotated around any node and still depict the same evolutionary relationships. Teaching students to focus on the relative branching pattern of the tre helps emphasize that evolution is indeed a branching process, and that there is no single, linear narrative to describe the divergence of species (Baum et al., 2005; Meisel, 2010).
Science educators have argued that developing students’ tree-thinking skills should be a priority for biology curricula (Baum et al., 2005; Catley, 2006; Meisel, 2010), and more educational resource are needed to train students to accurately read phylogenetic trees and understand what they communicate (O’Hara, 1997; Baum et al., 2005; Meisel, 2010; Halverson, 2011). Additionally, research indicate that student performance and conceptual understanding increases in classes that incorporate inquiry-based instruction (Minner et al., 2010; Freeman et al., 2014). In particular, the integration of web-based resources allows students to gather up-to-date information in virtually any subject area and become actively engaged in the learning process through exploration (Kuzoff et al., 2009; Satterthwait, 2010). Particularly among contemporary students who have grown up in a technology-driven world, the use of online resources has the potential to enhance classroom activities and invigorate science education (Mistler-Jackson & Songer, 2000; Jang, 2009; Kuzoff et al., 2009). We capitalized on the wealth of online bioinformatics resources to develop a series of inquiry-based activities aimed at improving students’ tree-thinking skills. The learning module described here will help students recognize the evolutionary relationships among organisms, understand how these relationships are determined, and appreciate that phylogenetic trees are hypotheses that are subject to revision following new discoveries and analyses.
Alignment with Next Generation Science Standards
The activities described in this module allow students to engage in several Science and Engineering Practices of the Next Generation Science Standards, or NGSS (NGSS Lead States, 2013). Specifically, students will gain experience developing and using models; analyzing and interpreting data; constructing explanations; and obtaining, evaluating, and communicating information. By participating in the same practices used by scientists and engineers, students gain a more meaningful learning experience and a better understanding of the relevance of science, technology, engineering, and mathematics to their everyday lives (NGSS Lead States, 2013). This module also presents several NGSS Crosscutting Concepts that will help students organize interrelated knowledge from various scientific fields and develop a more coherent and scientifically based view of the world (National Research Council, 2012). In particular, the module helps to unite central concepts related to patterns, systems and system models, structure and function, and stability and change. Finally, this module addresses several NGSS Disciplinary Core Ideas that reflect unifying principles in life sciences, including structure and function, variation of traits, evidence of common ancestry and diversity, natural selection, and adaptation. These core ideas are essential for understanding the central organizing principle that evolution explains both the unity and diversity of life on Earth. We list the specific student activities in the module that are aligned with each NGSS dimension in Table 1.
Table 1.
Alignment of student activities with Next Generation Science Standards (NGSS).
| NGSS Dimension | NGSS Topics & Codes | Student Activities |
|---|---|---|
| Science and Engineering Practices | ● Developing and using models ● Analyzing and interpreting data ● Constructing explanations ● Obtaining, evaluating, and communicating information |
● Construct phylogenetic trees as a visual representation of the evolutionary relationships among organisms. ● Search online bioinformatics resources (NCBI website) to collect genetic data. ● Use online phylogenetics software (Phylogeny.fr) to align DNA sequences and construct molecular phylogenies. ● Make a prediction about the evolutionary relationships among present-day animals, and then test it using genetic data and phylogenetic analyses. ● Evaluate the impact of new data by adding a “Discovery” species to the phylogenetic tree. ● Compare the advantages of different types of data (morphological vs. molecular) for determining the evolutionary relationships among organisms. |
| Crosscutting Concepts | ● Patterns ● Systems and system models ● Structure and function ● Stability and change |
● Group organisms based on their shared characteristics. ● Construct phylogenetic trees to model evolutionary relationships. ● Explain the relationship between DNA and protein production. ● Compare if/how the phylogenetic tree changes with the addition of new data (the “Discovery” species). |
| Disciplinary Core Ideas | ● Structure and function (LS1.A) ● Variation of traits (LS3.B) ● Evidence of common ancestry and diversity (LS4.A) ● Natural selection (LS4.B) ● Adaptation (LS4.C) |
● Explain the relationship between DNA and protein production for the hemoglobin molecule used in the phylogenetic analyses. ● Evaluate the variation in nucleotide sequences across the different animals on the Alignment page of Phylogeny.fr. ● Observe that the nucleotide sequences for the hemoglobin gene vary among species, but that there are also many overlaps. ● Identify the shared, derived characteristics among a group of organisms that make them adapted to their particular environments. ● Consider how similar environments and lifestyles may lead to the evolution of similar phenotypic characteristics among distantly related species through the process of convergent evolution. |
Details of the Module
Learning Objectives
The goal of this learning module is to develop students’ skills in building phylogenetic trees and interpreting the evolutionary relationships they represent. Students will gain firsthand experience in the construction of phylogenetic trees using both morphological and molecular data, and will use interactive worksheets and online phylogenetic resources to explore how phylogenetic trees are testable hypotheses that are updated over time following the addition of new data. Having completed the module, students will recognize that there is still uncertainty about the true evolutionary relationships among organisms, and that new evidence continues to improve our understanding of the tree of life.
Overview
This module was designed as a story in which students are applying for an internship at a local college. Stories help capture students’ attention and keep them engaged in activities because they appeal to the human desire for goals (Wilson, 2002; Schultheis & Kjelvik, 2015). The module is presented in two sections: (1) a “Diagnostic Assessment” in which students investigate the relationships among fictitious alien species using solely morphological data; and (2) an “Application” in which students use online resources to gather real DNA sequences on present-day animals, construct a phylogenetic tree based on these genetic data, and then revise their tree after the addition of a new species. An educator’s guide with step-by-step instructions for the entire module (Supplemental File 1), readymade student worksheets and activity cards (Supplemental Files 2–4), handouts for students on how to use the online resources (Supplemental Files 5 and 6), and a complete educator’s key (Supplemental File 7) are all provided as Supplemental Material with the online version of this article.
Section 1: Comparing Shared Characteristics among Fictitious Species (Days 1–2)
In the “Diagnostic Assessment” section, students compare the characteristics (i.e., phenotypes) among nine fictitious alien species using a character matrix, group the species on the basis of their shared characteristics, and then build a phylogenetic tree based on these groupings (Figure 1). The tree contains multiple gains and losses of traits across two major lineages, which are designed to challenge students’ misconceptions that evolution is a linear, progressive process toward increasing complexity. This activity is designed to help students understand how shared, derived characteristics are used to infer evolutionary relationships, and that, in general, species with recent common ancestry will have more phenotypic characteristics in common.
Figure 1.

Alien species used in the “Diagnostic Assessment” section of the module. Students are asked to group species on the basis of shared characteristics to infer their evolutionary relationships.
Section 2: Using Online Tools to Construct a Real Phylogenetic Tree (Days 2–3)
In the “Application” section, students apply the tree-thinking skills they developed in the alien species activity to analyze the evolutionary relationships among 10 present-day animals: nine mammals and a bird (Figure 2). Students are asked to construct a phylogenetic tree for the 10 species based on their knowledge of shared phenotypic characteristics. Students then search the National Center for Biotechnology Information website (https://www.ncbi.nlm.nih.gov) to collect DNA sequences for the hemoglobin alpha protein for all 10 species, and use these molecular data to construct a phylogenetic tree with the web-based phylogenetic alignment and analysis software Phylogeny.fr (http://www.phylogeny.fr; Dereeper et al., 2008). Allowing students to explore computational resources used by scientists to collect genetic data, align DNA sequences, and construct molecular phylogenies helps them appreciate the importance of computational technologies for evolutionary analyses and scientific research.
Figure 2.
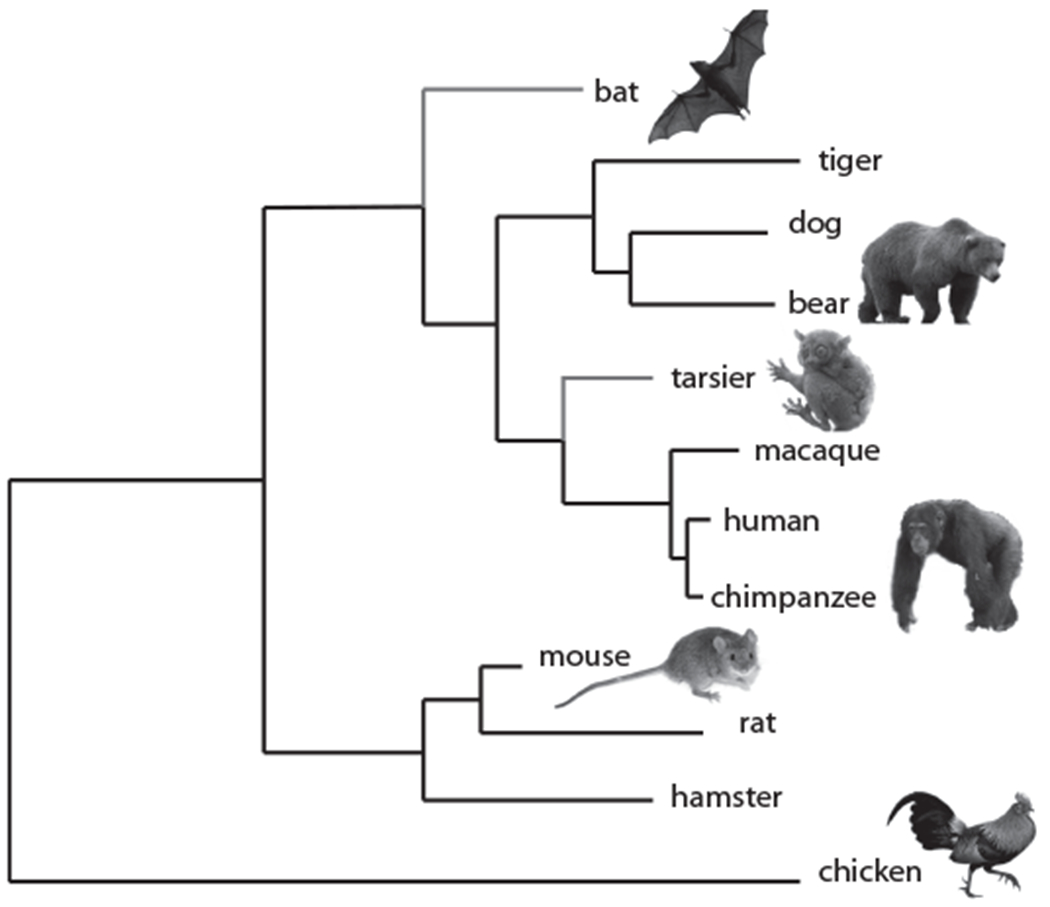
Phylogenetic tree depicting the evolutionary relationships among the animals used in the “Application” section of the module. The relative branching pattern was established using the online phylogenetic software Phylogeny. fr, based on the DNA sequences for the hemoglobin alpha protein. The original 10 species are indicated in black, and the addition of two “discovery” species is illustrated in red. All images are from Wikimedia Commons. Photo credits (top to bottom): Hasitha Tudugalle, Anbeast25, mtoz, Hans Hillewaert, George Shuklin, CK Subramanya.
Lastly, to mirror the discovery of a new species or the incorporation of new data, students are asked to select one of six possible “discovery” mammals to add to their phylogenetic tree: bat, platypus, hedgehog, tarsier, walrus, or whale. These organisms were intentionally selected to challenge students’ understanding of evolutionary relationships and foster discussion about convergent evolution. Students are asked to predict the position of the new species on their existing tree, and then test their prediction by collecting the DNA sequence data for the 11th species and constructing an updated phylogenetic tree. By engaging in the iterative process of reexamining and revising their evolutionary hypotheses, students gain experience with the process of science.
Target Student Audience
The primary target audience for this module is high school students enrolled in an Advanced Placement (AP) Biology course, an International Baccalaureate (IB) Biology program, or a higher-level evolution elective. However, the module can easily be adapted for a variety of student levels. For example, instructors of lower-level biology courses can distribute the DNA sequences of the animals in the “Application” section to the students directly if the task of collecting DNA sequence from the NCBI website may be too challenging. Ready-made handouts with the DNA sequences for the hemoglobin alpha protein of all 10 species in Card Set B and the six “discovery” species are available in the Supplemental Material (Supplemental Files 8 and 9). Alternatively, instructors of an undergraduate evolution course can expand the module by building a three-dimensional phylogenetic tree to tackle the misconception of relatedness that two-dimensional trees may convey, or by engaging the students in further discussions about the applications of phylogenetics in diverse disciplines (see “Beyond the Module” in Supplemental File 1).
Prior to starting these activities, students should be familiar with binomial nomenclature, homologous and analogous structures, evolutionary histories, and the basic methodology of building and interpreting phylogenetic trees. Students should work in pairs and will need approximately three 45-minute class periods to complete both the “Diagnostic Assessment” and “Application” sections.
Educator Comments
This module was assessed in a classroom of 20 high school seniors at KIPP NYC College Prep High School in the Bronx, New York. It was used as a summative assessment following a series of lessons on common ancestry, evolutionary relatedness, and phylogenetics. Students found the activities engaging, and the educator found that the module improved the students’ overall understanding of evolution. Although some students were initially hesitant about “making a mistake” when asked to place animals on the phylogenetic tree, they enjoyed being able to predict and test their hypotheses about the evolutionary relationships of familiar and unfamiliar organisms. Importantly, some of the “mistakes” that students made about the arrangement of animals on the tree revealed common misconceptions about phylogenies, which led to valuable classroom discussions to address these misconceptions. Students also found it exciting to use the online resources and real genetic data. The inclusion of these technologies elicited an appreciation for scientists who regularly analyze large-scale molecular data, and for the speed at which large amounts of information can be processed with modern computers. Finally, the process of revising the phylogenies after the inclusion of new data led to fruitful discussions about tree-thinking and gave students firsthand experience with the iterative nature of science.
Conclusions
Developing students’ tree-thinking skills should be a major goal for biology education in order to help them organize knowledge about biological diversity (Baum & Offner, 2008). The learning module presented here provides students with practical experiences using online technologies to explore phylogenetic trees and the evolutionary relationships they represent. The activities are designed to address several common misconceptions about phylogenetic trees, and to challenge students to reexamine and revise their predictions about evolutionary relationships using multiple types of data. By allowing students to collect, analyze, and evaluate real data using authentic bioinformatics tools, this module engages students in important scientific practices that will be applicable throughout their lives. We hope that these activities, or variations of them, will be useful to educators and spark student excitement about the evolutionary connections among all organisms.
Supplementary Material
Acknowledgments
The development of this educational module was part of a Broader Impact educational outreach initiation funded by NSF DEB 1655840 and associated Research Experience for Teachers and Research Assistantships for High School Students Supplements to S.D.
Footnotes
Supplemental Material
The following resources are available with the online version of this article.
Supplemental File 1: Educator’s Guide
Supplemental File 2: Student Handout
Supplemental File 3: Card Set A – Alien Species
Supplemental File 4: Card Set B – Present-Day Animals (including the six Discovery Species)
Supplemental File 5: Resource no. 1 – How to Use NCBI
Supplemental File 6: Resource no. 2 – How to Use Phylogeny.fr
Supplemental File 7: Educator’s Key to Student Handout
Supplemental File 8: DNA Sequences for 10 Original Species (optional handout for lower level)
Supplemental File 9: DNA Sequences for 6 Discovery Species (optional handout for lower level)
Contributor Information
ERIN L. McCULLOUGH, Postdoctoral Researcher in the Center for Reproductive Evolution (CRE), Department of Biology, Syracuse University, Syracuse, NY 13244.
LAUREN VERDEFLOR, Science Educator at KIPP NYC College Prep High School, Bronx, NY 10451.
ALAINA WEINSZTOK, Science Educator at Westhill High School, Syracuse, NY 13219.
JASON R. WILES, Associate Professor in the Department of Biology, Syracuse University
STEVE DORUS, Associate Professor in the CRE, Department of Biology, Syracuse University.
References
- Baum DA & Offner S (2008). Phylogenies and tree-thinking. American Biology Teacher, 70, 222–229. [Google Scholar]
- Baum DA, Smith SD & Donovan SSS (2005). The tree-thinking challenge. Science, 310, 979–980. [DOI] [PubMed] [Google Scholar]
- Blacquiere LD & Hoese WJ (2016). A valid assessment of students’ skill in determining relationships on evolutionary trees. Evolution: Education and Outreach, 9, 5. [Google Scholar]
- Catley KM (2006). Darwin’s missing link – a novel paradigm for evolution education. Science Education, 90, 767–783. [Google Scholar]
- Catley KM, Phillips BC & Novick LR (2013). Snakes and eels and dogs! Oh, my! Evaluating high school students’ tree-thinking skills: an entry point to understanding evolution. Research in Science Education, 43, 2327–2348. [Google Scholar]
- Darwin C (1859). On the Origin of Species by Means of Natural Selection. London: John Murray. [Google Scholar]
- Dees J, Momsen JL, Niemi J & Montplaisir L (2014). Student interpretations of phylogenetic trees in an introductory biology course. CBE-Life Sciences Education, 13, 666–676. [DOI] [PMC free article] [PubMed] [Google Scholar]
- Dereeper A, Guignon V, Blanc G, Audic S, Buffet S, Chevenet F, et al. (2008). Phylogeny.fr: robust phylogenetic analysis for the nonspecialist. Nucleic Acids Research, 36, W465–W469. [DOI] [PMC free article] [PubMed] [Google Scholar]
- Dobzhansky T (1973). Nothing in biology makes sense except in the light of evolution. American Biology Teacher, 75, 87–91. [Google Scholar]
- Freeman S, Eddy SL, McDonough M, Smith MK, Okoroafor N, Jordt H & Wenderoth MP (2014). Active learning increases student performance in science, engineering, and mathematics. Proceedings of the National Academy of Sciences USA, 111, 8410–8415. [DOI] [PMC free article] [PubMed] [Google Scholar]
- Grant PR & Grant BR (2011). How and Why Species Multiply: The Radiation of Darwin’s Finches. Princeton, NJ: Princeton University Press. [Google Scholar]
- Gregory TR (2008). Understanding evolutionary trees. Evolution: Education and Outreach, 1, 121–137. [Google Scholar]
- Halverson KL (2011). Improving tree-thinking one learnable skill at a time. Evolution: Education and Outreach, 4, 95–106. [Google Scholar]
- Jang S-J (2009). Exploration of secondary students’ creativity by integrating web-based technology into an innovative science curriculum. Computers & Education, 52, 247–255. [Google Scholar]
- Kummer TA, Whipple CJ & Jensen JL (2016). Prevalence and persistence of misconceptions in tree thinking. Journal of Microbiology & Biology Education, 17, 389–398. [DOI] [PMC free article] [PubMed] [Google Scholar]
- Kuzoff RK, Kemmeter SB, McKinnon JS & Thompson CP (2009). Phylogenetic analysis: how old are the parts of your body? Evolution: Education and Outreach, 2, 405–414. [Google Scholar]
- Meir E, Perry J, Herron JC & Kingsolver J (2007). College students’ misconceptions about evolutionary trees. American Biology Teacher, 69, 71–76. [Google Scholar]
- Meisel RP (2010). Teaching tree-thinking to undergraduate biology students. Evolution: Education and Outreach, 3, 621–628. [DOI] [PMC free article] [PubMed] [Google Scholar]
- Minner DD, Levy AJ & Century J (2010). Inquiry-based science instruction – what is it and does it matter? Results from a research synthesis years 1984 to 2002. Journal of Research in Science Teaching, 47, 474–496. [Google Scholar]
- Mistler-Jackson M & Songer NB (2000). Student motivation and Internet technology: are students empowered to learn science? Journal of Research in Science Teaching, 37, 459–479. [Google Scholar]
- National Research Council (2012). A Framework for K–12 Science Education: Practices, Crosscutting Concepts, and Core Ideas. Washington, DC: National Academies Press. [Google Scholar]
- NGSS Lead States (2013). Next Generation Science Standards: For States, By States. Washington, DC: National Academies Press. [Google Scholar]
- O’Hara RJ (1997). Population thinking and tree thinking in systematics. Zoologica Scripta, 26, 323–329. [Google Scholar]
- Omland KE, Cook LG & Crisp MD (2008). Tree thinking for all biology: the problem with reading phylogenies as ladders of progress. BioEssays, 30, 854–867. [DOI] [PubMed] [Google Scholar]
- Satterthwait D (2010). Why are “hands-on” science activities so effective for student learning? Teaching Science: The Journal of the Australian Science Teachers Association, 56, 7–10. [Google Scholar]
- Schluter D (2000). The Ecology of Adaptive Radiation. Oxford, UK: Oxford University Press. [Google Scholar]
- Schultheis EH & Kjelvik MK (2015). Data nuggets: bringing real data into the classroom to unearth students’ quantitative and inquiry skills. American Biology Teacher, 77, 19–29. [Google Scholar]
- Wilson EO (2002). The power of story. American Educator, 26, 8–11. [Google Scholar]
- Young AK, White BT & Skurtu T (2013). Teaching undergraduate students to draw phylogenetic trees: performance measures and partial successes. Evolution: Education and Outreach, 6, 16. [Google Scholar]
Associated Data
This section collects any data citations, data availability statements, or supplementary materials included in this article.