Abstract
A quantitative systems pharmacology model for metastatic melanoma was developed for immuno‐oncology with the goal of predicting efficacy of combination checkpoint therapy with pembrolizumab and ipilimumab. This literature‐based model is developed at multiple scales: (i) tumor and immune cell interactions at a lesion level; (ii) multiple heterogeneous target lesions, nontarget lesion growth, and appearance of new metastatic lesion at a patient level; and (iii) interpatient differences at a population level. The model was calibrated to pembrolizumab and ipilimumab monotherapy in patients with melanoma from Robert et al., specifically, waterfall plot showing target lesion response and overall response rate (Response Evaluation Criteria in Solid Tumors [RECIST] version 1.1), which additionally considers nontarget lesion growth and appearance of new metastatic lesions. We then used the model to predict waterfall and RECIST version 1.1 for combination treatment reported in Long et al. A key insight from this work was that nontarget lesions growth and appearance of new metastatic lesion contributed significantly to disease progression, despite reduction in target lesions. Further, the lesion level simulations of combination therapy show substantial efficacy in warm lesions (intermediary immunogenicity) but limited advantage of combination in both cold and hot lesions (low and high immunogenicity). Because many patients with metastatic disease are expected to have a mixture of these lesions, disease progression in such patients may be driven by a subset of cold lesions that are unresponsive to checkpoint inhibitors. These patients may benefit more from the combinations which include therapies to target cold lesions than double checkpoint inhibitors.
Study Highlights.
WHAT IS THE CURRENT KNOWLEDGE ON THE TOPIC?
The pathophysiology of immuno‐oncology (IO) failure is complex and not fully understood. Several companies and academic groups are developing mechanistic quantitative systems pharmacology (QSP) models to facilitate pathophysiology‐driven decision making. Most of these models have focused on immune pathophysiology in a single average lesion and have not integrated tumor‐to‐tumor variability, and secondary causes for progression, such as growth of nontarget lesions, or new metastatic lesions into their clinical trial simulations.
WHAT QUESTION DID THIS STUDY ADDRESS?
How do patients develop progression on pembrolizumab and ipilimumab? Does the combination treatment address the causes of failure? Can a QSP approach enable rational decision making in checkpoint therapies (and more generally in IO) by predicting responses to combinations with anti‐PD1 (first line therapy) and helping prioritize targets? Can we use this approach to identify potential responders to combination therapies?
WHAT DOES THIS STUDY ADD TO OUR KNOWLEDGE?
Lesion‐to‐lesion heterogeneity plays a critical role in the pathophysiology of drug failure. Most patients with melanoma with progression display a reduced tumor burden. For most patients, disease progression is either driven by nontarget progression and/or the appearance of new lesions. Few clinical studies or QSP models have focused on these aspects of disease progression. In addition, this study suggests that patients may display both hot and cold lesions; potentially limiting the efficacy of checkpoint inhibitor combinations.
HOW MIGHT THIS CHANGE DRUG DISCOVERY, DEVELOPMENT, AND/OR THERAPEUTICS?
These finding should increase focus on intrapatient heterogeneity in tumor response to therapy.
INTRODUCTION
Immune therapy has shown great promise in the treatment of metastatic melanoma. However, many patients on immune therapies develop disease progression. Quantitative systems pharmacology (QSP) modeling can be used to understand clinical drug failure with immuno‐oncology (IO) therapies and inform combination strategies that address the causes of progression (lack or loss of response). Several IO QSP models have been published and have been comprehensively reviewed elsewhere. 1 , 2 QSP models generally focus on average target lesion dynamics, with little or no modeling of nontarget or new metastatic lesions.
In oncology clinical trials, disease progression is defined by diagnosis of progressive disease (PD) using Response Evaluation Criteria in Solid Tumors (RECIST) version 1.1 criterion. Patients are classified as having PD due to target lesion progression (aggregate growth of multiple target lesions), nontarget progression (unequivocal growth of at least one non‐target lesion), the appearance of a new metastatic lesions, or any combination of these three determinations. Recent analysis by our group 3 , 4 has shown that growth of nontarget lesions and the appearance of new metastatic lesions can contribute significantly to PD, despite stabilization or reduction in target tumor burden. Furthermore, these analyses with pembrolizumab clinical data have also shown that different lesions within a patient can respond differently (i.e., some lesions may shrink, and others may grow). This emphasizes that the need to account for lesion‐to‐lesion heterogeneity and the appearance of new metastatic lesions to better characterize the mechanisms of drug failure. Such a characterization of treatment failure can inform novel combinations to treat patients with cancer.
Here, we propose an IO QSP modeling framework accounting for lesion level description of the therapeutic effect in order to model clinical response to pembrolizumab (anti‐PD1 monoclonal antibody [mAb]) and ipilimumab (anti‐CTLA4 mAb) therapy in metastatic melanoma. This model, to our knowledge, is the first to incorporate intrapatient (lesion‐to‐lesion) variability in the pathophysiology of immune‐mediated tumor killing. Further, we have considered all aspects of RECIST version 1.1 progression: target, nontarget, and new metastatic lesions. It is important to emphasize that a detailed representation of how immune system is modulated by IO therapies is beyond the scope of this work. Such a “bottom up” model, with multiple biological uncertainties and lack of quantitation of aspects of tumor‐immune interactions, can be used to identify gaps in knowledge and guide further biological investigations. Here, we implement a “top down” model with the purpose to describe clinical efficacy data using a minimal (and lumped) description of underlying biological mechanisms. The model was calibrated to clinical data from monotherapy studies of pembrolizumab and ipilimumab and was tested by comparing model predictions (tumor size changes and RECIST version 1.1 score) of their combination in melanoma. 5 , 6 , 7 , 8 Overall, this work highlights the complexity of RECIST version 1.1 progression and its implications. Our work shows the need for novel combinations to address multiple heterogeneous tumors within a single patient suggesting that combinations with orthogonal mechanisms (i.e., immune and nonimmune approaches) may be more promising than combinations that target similar mechanisms (i.e., double immune checkpoints) of tumor killing.
METHODS
Model hierarchy
QSP model development typically proceeds in stages and involves integration of physiological knowledge across multiple scales. 9 This model begins with a description of CD8 T cell mediated tumor killing within a single tumor (Figure 1). Virtual patients are then created with multiple such target lesions. Progression due to nontarget causes (such as appearance of new metastatic lesions) is captured by a probabilistic model (Figure 2). Finally, multiple such virtual patients are integrated into a virtual population.
FIGURE 1.
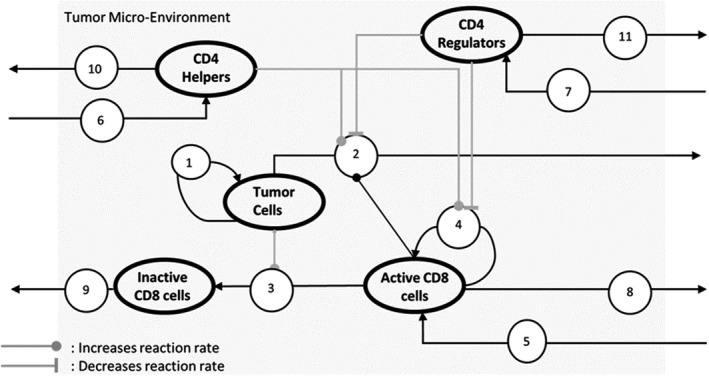
Model with 5 variables (shown as bolded ovals) and 11 reactions (shown as numbered circles). (1) Growth of tumor cells. (2) Tumor cells are killed by interaction with Active CD8 that is upregulated by helper and downregulated by regulator cells. (3) Active CD8 cells are inactivated on interaction with tumor cells due to the PD1‐PDL1 interaction. (4) Proliferation of active CD8, increased by helpers, and decreased by regulators. (5) Recruitment of active CD8 into tumor microenvironment (TME). (6) Recruitment of CD4 helpers. (7) Recruitment of CD4 regulators. (8) Clearance of active CD8. (9) Clearance of inactive CD8. (10) Clearance of CD4 helpers. (11) Clearance of CD4 regulators. The model equations are outlined in Figure 3 and the detailed explanations of the modeling assumptions are in the Supplementary Section titled “Model Design.” Pembrolizumab is modeled as decreasing inactivation of CD8 (rate of reaction 3), increasing CD8 proliferation (rate of reaction 4), and recruitment (rate of reaction 5). Ipilimumab is modeled as functioning in the lymph node and increasing influx of active CD8 and CD4 helpers into the TME (rates of reactions 5 and 6) and decreasing influx of CD4 regulators (rate of reaction 7)
FIGURE 2.
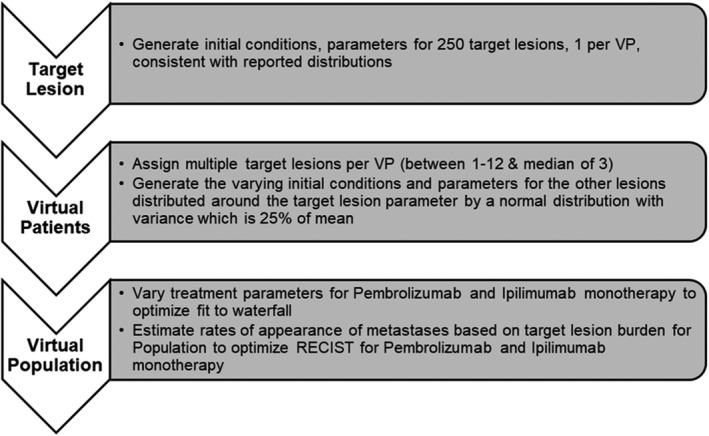
Schematic to show general method to show model development to be consistent with pembrolizumab and ipilimumab monotherapy clinical trial data. Parameterization starts with target lesion and cumulatively to virtual patient (VP) with multiple target lesions. A virtual population’s response to therapy depends on target lesion response (constrained by waterfall data) and appearance of metastases or nontarget lesion growth (constrained by Response Evaluation Criteria in Solid Tumors [RECIST] version 1.1 scores)
Lesion‐level model structure
Model equations described hypothesized interactions in the tumor microenvironment of a single target lesion
A lesion is assumed to be a well‐mixed volume of tumor cells and tumor infiltrating lymphocytes (TILs). The model of the lesion contains 5 ordinary differential equations to track time trajectories of the numbers of these cells: (1) tumor cells, (2) activated CD8 T cells, (3) inactivated CD8 T cells, (4) helper cells, and (5) regulatory cells over time. The latter 4 cell types ‐ CD8 T cells (active and inactive), helper and regulator cells are together referred to as the TILs. Model structure is shown in Figure 1 and underlying mathematical equations are laid out in Figure 3.
FIGURE 3.
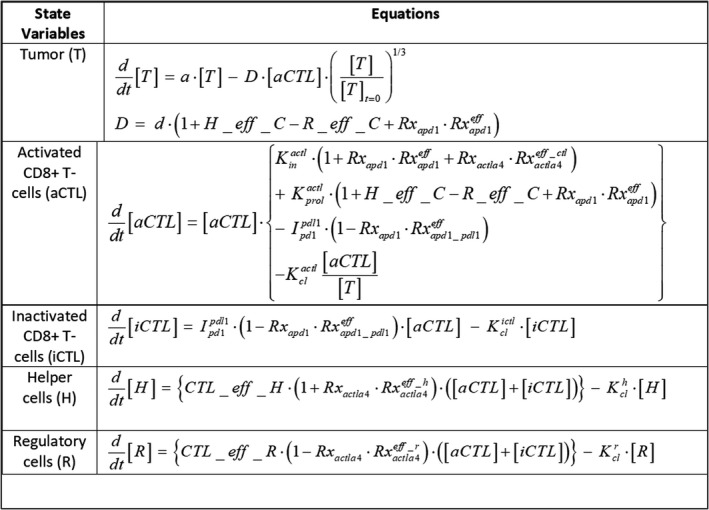
The model equations for interactions within a single target lesion. Five species interact in a well‐mixed volume: tumor cells (T), activated CD8 T cells (aCTL), inactive CD8 T cells (iCTL), helper cells (H), and regulatory cells (R), as shown in Figure 1. Therapy effect is turned on or off using switch parameters () and the therapy effect is modeled as affecting various rates (: decreases rate of conversion from iCTL to aCTL, : increases killing rate, infux rate into TME of aCTL, : respectively, increase influx rate into TME of aCTL, H and R). H_eff_C and R_Eff_C, are functions capturing saturating effect of H and R on aCTL, and CTL effect on H and R are captured by CTL_eff_H, CTL_eff_R (details in Supplementary section titled: “Role of immune cells in the model of target lesion”)
Tumor cells can grow exponentially or can be killed by activated CD8 T cells. Activated CD8 T cell are functionally active cells that are capable of cytotoxicity (secrete Granzyme B and IFN‐g) and proliferate. 10 Activated CD8 T cells are taken into an anergic state by the interaction between checkpoint receptor and its ligand (e.g., PD‐1 in the T cell and PD‐L1 in the tumor). This anergic pool of CD8 T cells are defined as inactivated CD8 T cells in the model are incapable of cytotoxicity or proliferation. 8 , 11 Additionally, helper cells aid activated CD8 T cells to perform with more efficacy, whereas regulatory cells impede the activity of activated CD8 T cells.
As a simplification, all functionally active tumor antigen specific CD8 T cells are aggregated into one entity and their tumor killing rate into a single parameter. Future versions of the model may consider various subsets of CD8 T cells as well as consider a range of PD‐1 and PD‐L1 expressions explicitly. Helper cells are a pool of pro‐inflammatory immune cell types—currently identified with data from CD4 T helpers. They upregulate CD8 T cells’ cytotoxicity as well as increase their proliferation. Regulator cells are anti‐inflammatory immune cell types—currently identified with regulatory T cells (Tregs) but can also include mechanisms implicated by myeloid‐derived suppressor cells, other anti‐inflammatory mediators. They downregulate CD8 T cells’ cytotoxicity as well as decrease its proliferation. Additional details of modeling assumptions, mathematical description, and parameterization of the target lesion model are in the Supplementary section titled “Model Design.”
Initial fraction of the TILs (TILs = inactive CD8 + active CD8 + helper cells + regulator cells, TIL% = 100* TIL/[TIL + tumor cells]) is an important metric, which determines immunogenicity of the tumor and response to IO therapy.
Implementation of anti‐PD1 and anti‐CTLA4 mechanisms of action
Mechanism of action of anti‐PD‐1 is modeled as a decrease in the rate of conversion of active CD8 T cells to inactive CD8 T cells (due to blocking of PD‐1::PD‐L1 interaction) in a lesion. 12 , 13 This results in increased cytotoxicity, infiltration, and proliferation of the CD8 T cell population. The effect of anti‐CTLA4 is modeled as increased infiltration of pro‐inflammatory helper (CD4 T helpers) and CD8 T cells, and decreased infiltration of regulators (CD4 Tregs) in a lesion. 12 , 13 Because pembrolizumab concentrations during chronic dosing are considered to be well above half‐maximal effective concentration, pharmacokinetics, and receptor occupancy have not been explicitly modeled here. 14 The data used to estimate treatment effects are detailed in the Supplementary section titled “Clinical data used to develop virtual population.”
Patient and population level model structure
Generating multiple lesions per virtual patient
A single virtual patient (VP) in the model consists of multiple target lesions as in real‐world clinical trials. These lesions within a patient have variable initial conditions (size, initial TIL%) and some variable parameters (e.g., growth rate, CD8 T cell proliferation rate, etc.). Details on which parameters are held constant and which are varied are in Tables S1–S3. We generate multiple tumors within a VP, and then multiple VPs to generate a candidate virtual population.
The following data are used to estimate the initial conditions of the cell types of the first target lesion of a VP.
Based on metastatic melanoma samples collected from patients with stage III/IV melanoma, the cell density is assumed to be 235 million cells/ml and is fixed for all lesions and all VPs (inclusive of tumor cells and TILs 15 ).
Based on baseline distributions reported in clinical trials, 5 , 16 lesion diameters of the VPs in the model are lognormally distributed with a mean of 20 mm and SD of 8 mm (estimated to match reported range) and minimum of 10 mm (according to RECIST version 1.1 criteria, the minimum size for a non‐nodal target lesion and nodal target lesion is 10 mm and 15 mm, whereas we have not made this distinction and have the minimum size set at 10 mm).
Once a lesion diameter is picked, volume is calculated (assuming the lesion is spherical) and the total number of cells are calculated (number of cells = density × volume). Details of the calculation of initial cell numbers is in Supplementary subsection titled “Initial conditions in the lesions of a virtual patient.”
Next, multiple such target lesions are assigned to a single VP. Based on internal data from Merck Sharp & Dohme Corp., a subsidiary of Merck & Co., Inc., Kenilworth, NJ, USA., 3 the median number of target lesions in a VP is 3 and varies from 1–12 (see Figures S3 and S4).
Based on melanoma biopsies, the initial TIL% for a single lesion of a VP 15 is estimated from a long‐tailed distribution with median 12% 8 and SD of 10%. Further, the fraction of CD8 T cells among TILs is 70% 10 and helpers are 20% and the remaining TILs are regulators (based on breakdown of CD4 T cells in 15 ; Figure S1).
Based on the observation that immunogenic lesions have greater fraction of anergic CD8 T cells, 10 the fraction of inactive CD8 (reported as partially exhausted CD8 T cells) is modeled as a function of TIL% and varies from 90% to 10% as seen in data (Figure S2).
The other target lesions of a VP are generated similarly. The initial TIL% is varied by 25% around the TIL% of the first target lesion in a given VP (this within patient heterogeneity parameter “h” has been empirically fixed at 25%). Figure 4a, shows first the number of target lesions per VP (for only 10% of the virtual population used in this analysis, for clarity). Figure 4b shows the initial TIL% in the multiple target lesions (141 lesions in 25 VPs are shown in the figure and there are altogether 930 lesions in the entire set of 250 VPs; see Figure S4). The sum of the longest diameters (SLDs) of these lesions in a VP are tracked to be compared with the change in sum of longest diameters (dSLDs) reported in the waterfall plot in the clinical literature.
FIGURE 4.
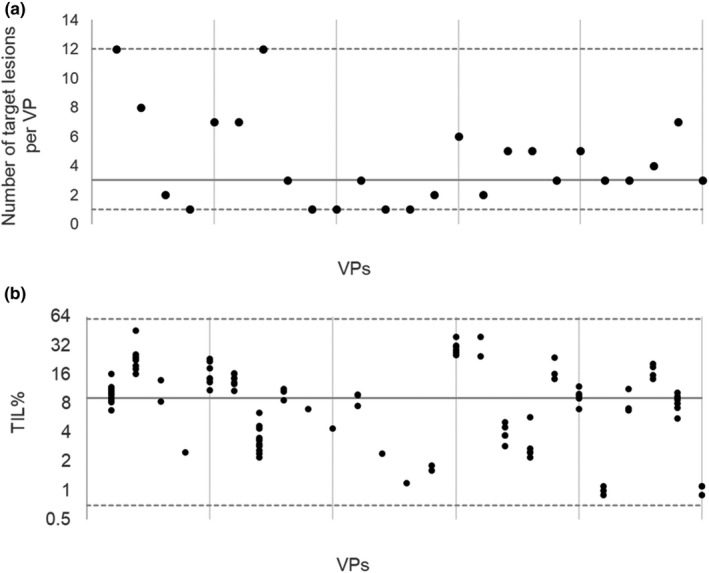
These figures show initial conditions for multiple target lesions for 25 virtual patients (VPs) for clarity (10% of the virtual population [every 10 VP when arranged in the order of their target response as shown in the waterfall], used in this study). Median value for the virtual population (solid line) and minimum and maximum (dashed lines) are shown in the figures (data sources shown in the Supplementary material). Within patient variability for initial tumor infiltrating lymphocyte (TIL% = 100* TIL/[TIL + tumor cells] is set to 25% [heterogeneity of target lesions]). (a) Number of target lesions per VP. (b) Initial TIL% per target lesion. Distribution of number of lesions per VP and initial TIL% for the first lesion of a VP are shown in Figures S3 and S1b
The parameters of the target lesions are determined from clinical data as much as possible. For example, median tumor proliferation rate for metastatic melanoma is assumed to be is 0.01/day with a range of 0.005 to 0.04/day. 17 , 18 Some parameters, such as rate of conversion from active to inactive CD8 T cell is modeled as being correlated to initial TIL% (based on data that in melanoma tumor immunogenicity is correlated with PDL1+ status 8 ). Other mechanistic parameters are kept invariant across all lesions. For example, parameters determining the half‐maxima of the saturating Hill function effects of immune cells (helper and regulator) on CD8 T cell, clearance rate constants of the various immune cells from the lesion. Details of available literature support for these parameters has been laid out in Tables S1–S3.
Matching the waterfall to generate a virtual population
Prior work 19 , 20 , 21 has reported generating virtual populations by assigning weights either to clinical readouts or mechanistic axes (parameters), or alternatively by generating them from an ensemble of physiologically plausible VPs and only including those that are consistent with clinical constraints, in a computationally efficient manner.
Our method is similar to the latter, where there is no weighting of mechanistic axes but rather candidate virtual populations are generated a priori with initial conditions, parameter distributions, and correlations consistent with data (or model hypotheses; Supplementary section titled “Development of virtual population” and table of VP parameters in supporting content). We changed the following parameters to generate multiple VPs for the candidate virtual populations: the number of lesions per VP, the initial conditions of all lesions (the number of tumor cells and the TIL%), parameters dependent on TIL%, tumor growth rates, maximum value (Vmax) of helper and regulator effects on CD8 T cell. As mentioned, patient heterogeneity parameter “h” that determines variability in parameters among the target lesions of a VP, was fixed at 25%. Parameters characterizing monotherapy effects of anti PD1 and anti CTLA4 were then optimized to simultaneously match target dynamics seen in the waterfall plot (waterfall plots capture the dSLD over 1 year per VP). This process is repeated for multiple candidate virtual populations and the population with the closest fit to the waterfall data of both therapies is picked.
Matching the RECIST version 1.1 score to estimate growth of nontarget lesions and new metastases
Radiographic progression according to RECIST version 1.1 is defined as greater than 20% growth in the SLD of target lesions from the nadir. Further, patients with unequivocal growth in any of the nontarget lesions (lesions not selected to be quantitatively tracked in the beginning of the trial) and/or the occurrence of a new metastatic lesion are also classified as “progressive disease.” 22 These secondary causes of disease progression are captured in a probabilistic model dependent on the tumor burden (sum of diameters of all target lesions). This probability of PD due to non‐target growth or appearance of metastases is estimated every 12 weeks. The parameters of the probabilistic model are estimated by simultaneously matching RECIST version 1.1 for both monotherapy trials at once.
Optimization for waterfall and RECIST version 1.1 was performed via a genetic algorithm (Matlab Global Optimization Toolbox) designed to minimize the distance between simulation results and calibration datasets. The objective function to be minimized was the difference in the data and virtual population of the fraction of patients in each of the dSLD buckets in the waterfall plots (dSLD < −30, −30 < dSLD < 20, dSLD > 20) and each of the RECIST version 1.1 classifications (complete response [CR], partial response [PR], stable disease [SD], and PD). In all cases, simulations were run for a year. The initial conditions and parameters for all target lesions for all VPs used in this analysis is provided in the Supplementary content.
Model assumptions and knowledge gaps
The following are major knowledge gaps that limit our ability to predict clinical outcome for novel therapeutic strategies using our approach.
Within patient distribution of TIL% across lesions: lesion‐to‐lesion response to pembrolizumab is highly variable. This implies lesion‐to‐lesion heterogeneity in pathophysiology such as TIL density. Given the paucity of data available about the heterogeneity of lesions in each patient, unimodal distributions for TILs with variances from 20%–60% was tested in the simulations. The current simulation results shown here assume a fixed variation of 25%.
Nontarget lesion growth and metastases: public literature generally reports the overall RECIST version 1.1 progression (overall response rate and progression‐free survival) but generally do not report the cause of progression (target PD, nontarget PD, rebound, or new metastatic lesion). At this time, nontarget lesion growth and metastases in the model are assumed to be a single, probabilistic, sigmoidal function dependent only on the total tumor burden in a patient, regardless of treatment with pembrolizumab, ipilimumab, or their combination. Physiological correlates of nontarget and metastatic lesion growth are critical in understanding disease progression and these may include length of disease, location of new metastases, and mechanism of action of the therapy.
Patient discontinuation due to dropouts: in cancer trials, patients often dropout due to multiple reasons, such as clinical progression, radiographic progression, protocol violation, death, withdrawal by patients, and adverse events. The present model only incorporates dropout due to radiographic progression evaluated at a fixed time (end of the year). Matching dynamic progression‐free survival and overall survival curves over time will constrain dynamics of progression and this will be addressed in future efforts.
Multiple levels of “activated” CD8 when combination therapies interact: two populations of CD8 T cells—active and inactive are being tracked in the model. However, the activation state for CD8 is unlikely to be binary like we have modeled, and there could be graded increase in activation, which results in higher proliferation rates and cytotoxicity. Markers for these are not explicit, however, they may be critical in determining response.
RESULTS
Model simulations for monotherapies (pembrolizumab and ipilimumab)
The model was designed to capture the clinical responses, measured in terms of waterfall plots and objective response rates (ORRs) in RECIST version 1.1 in stages III and IV melanoma to IO treatments with pembrolizumab and ipilimumab. Plots of time‐course of change in target tumor‐size (“spider” plots, shown as sum of target lesions within a VP) across VPs on treatment with pembrolizumab and ipilimumab were simulated (Figure 5 [P1 blue,I1 brown]). The model can capture the diversity in tumor response observed clinically in response to pembrolizumab and is also consistent with the reported clinical changes in CD8 T cell densities for pembrolizumab (shown in Figure S6, reported data for subset of patients and time‐course was only reported for pembrolizumab).
FIGURE 5.
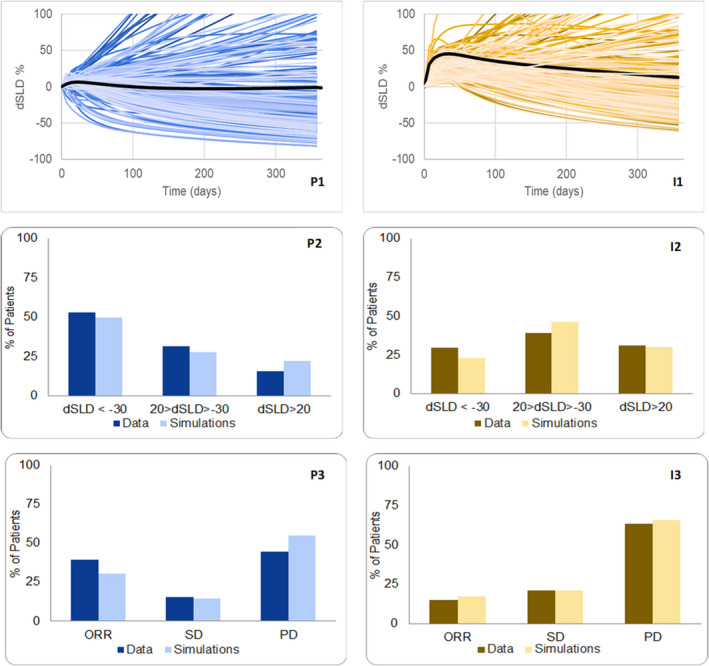
P1 and I1 show the simulated time dynamics over a year of the change in sum of longest diameters (dSLDs) for 250 virtual patients (VPs; each shaded differently) in response to pembrolizumab and ipilimumab, respectively, with median simulated response in a darker shade. Data for buckets of dSLD (<−30, −30 < dSLD < 20, dSLD > 20) are digitized from waterfall plots and are compared against the dSLD from 1 year of simulations, and these are shown in P2 and I2. P3 and I3 show comparison between model and simulation for Response Evaluation Criteria in Solid Tumors (RECIST) scores. The classification of disease progression may be due to target lesion dSLD > 20 during a year and/or a probabilistic event (such as metastases). All data are from ref. 4
Simulated waterfall plots for monotherapy pembrolizumab and ipilimumab are consistent with clinical data (categorized as dSLD < −30, −30 < dSLD < 20, dSLD > 20), shown in Figure 5 (P2, I2). Furthermore, Figure 5 (P3, I3) show consistency between model simulations and clinical data of RECIST version 1.1 scores of CR, PR, SD, and PD for pembrolizumab and ipilimumab, respectively. Importantly, in patients who received pembrolizumab treatment, ~ 45% report RECIST version 1.1 PD and only ~ 15% of them showed an increase in target tumor burden (dSLD > +20% as measured from baseline). This shows that, in most patients, disease progression is driven by growth of a subset of lesions (nontarget progression) or the appearance of new metastatic lesions.
Tumor‐size changes at lesion level are shown in Figure 6 for pembrolizumab and ipilimumab. The heterogeneity in response (i.e., patients having both shrinking and growing lesions), is evident from these simulations. Although clinical data at lesion level is not reported for comparison, this was consistent with internal data. 3 Similar heterogeneity in response to treatment has also been previously reported for pembrolizumab in patients with non‐small cell lung cancer. 23
FIGURE 6.
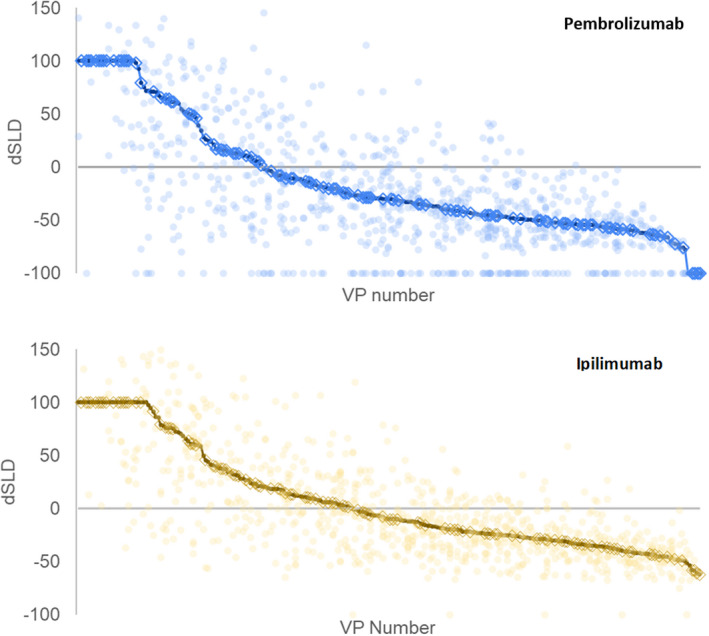
These figures show the behavior for the individual lesions in the 250 virtual patients (VPs). The unbroken line shows the simulated waterfall (change in sum of longest diameters [dSLDs]) for the patients. The lighter dots show the change in tumor size for each of the lesions. The circled VPs are those that were simulated to also have nontarget growth or appearance of metastases
It is unclear which patients develop new metastatic lesions. Here, we assume that the probability of developing new metastatic lesions is proportional to tumor burden and calibrate that model to match the overall rates of overall progression. Figure 6 also shows the effect of our metastases model with 46% of patients on pembrolizumab and 53% of patients on ipilimumab predicted to have metastases (VPs with metastases are circled in the waterfall).
Model predictions for combination (pembrolizumab + ipilimumab) therapy
The model, calibrated to pembrolizumab and ipilimumab monotherapies, was used to predict the clinical response to combination of these two therapies, without adjustments. The same virtual population was used to predict combination and assumptions on initial conditions (number of lesions, TIL%, etc.) and model parameters (rate of growth of new lesions, metastases model, etc.) were identical to the virtual population calibrated to the two monotherapies.
Consistent with the hypotheses on mechanisms of actions included in the model, simulations show that pembrolizumab leads to a greater fraction of active CD8 T cells from 3% to 12% (population median), and ipilimumab leads to a greater influx of CD8 T cells, helper and reduced influx of regulatory cells leading to increase in total T cells from 8% to 15% (population median) within a lesion. Combined together, these two effects lead to an increase in active CD8 T cells (as a result of higher fraction of active CD8 T cells and higher total T cells) and their functionality (greater cytotoxicity as a result of higher helper and lower regulatory cells) to drive reduction of lesion size.
Figure 7a shows that the predictions for dSLD of the target lesions were comparable to the clinical data reported in ref. 6. Figure 7b shows that the ORR (CR + PR) was underestimated—predicted ORR was 52% in simulations versus 62% in clinical trials. 6
FIGURE 7.
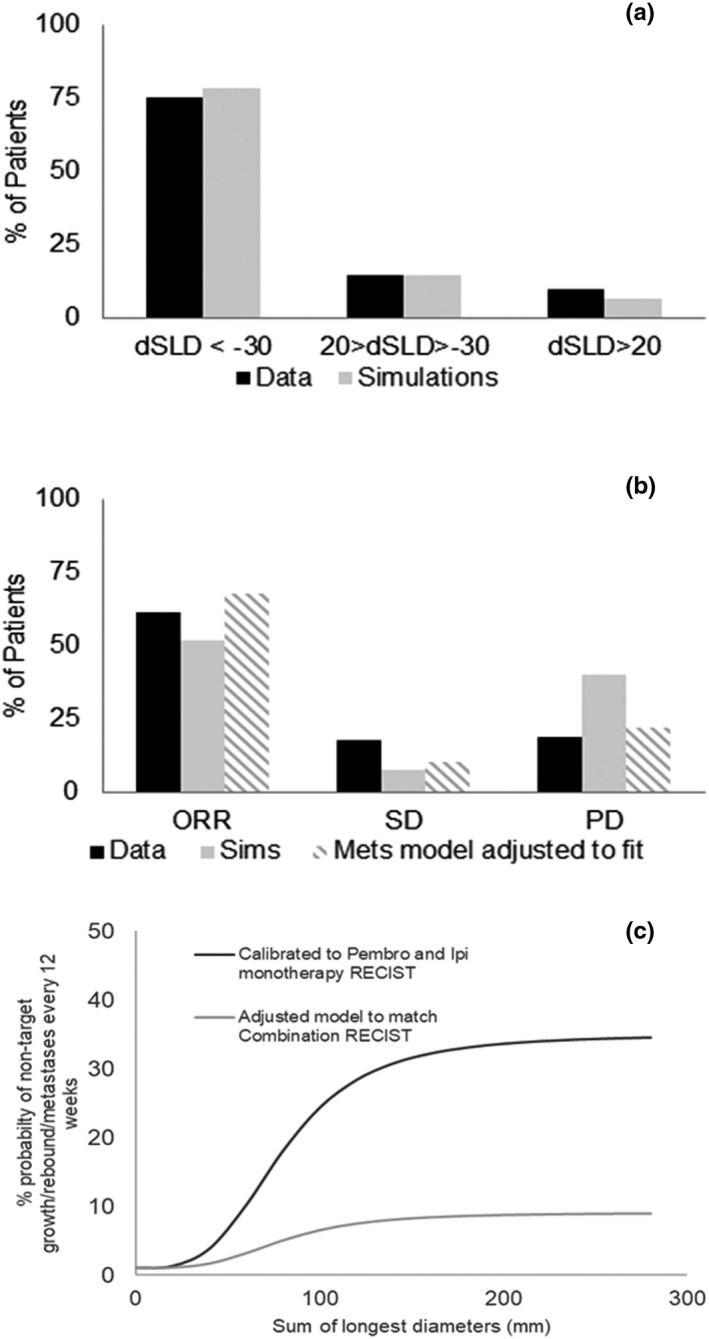
Percent change predicted by combining treatment parameters for pembrolizumab and ipilimumab with no further adjustments. (a) show good fits to the waterfall plots reported in ref. 6. (b) Bar chart comparing simulated Response Evaluation Criteria in Solid Tumors (RECIST) version 1.1 scores using unadjusted metastases model underestimates of objective response rates (ORRs; complete response [CR] + partial response [PR]) and overestimates of progressive disease (PD). The simulations from the adjusted model match the data (c) event probability (for example, probability that a virtual patient [VP] gets new metastatic lesion) is assumed to be a sigmoidal function of SLD and it is computed every 12 weeks. Model adjusted to match combination (pembrolizumab + ipilimumab) RECIST suggests fewer events on combination compared to monotherapy and that needs to be investigated further
The model was able to predict dynamics of target lesions, but overestimated the percentage of patients who are classified as PD. When we use the probabilistic model calibrated to monotherapy RECIST version 1.1 score, without adjustment, to predict combination response, 40% of VPs are predicted to be classified as PD (vs. only 19% in the data). A model adjusted to specifically match RECIST version 1.1 score in the combination trial (Figure 7c) assumes lower probabilities of nontarget growth and appearance of metastases (9% vs. 36% as maximum probability) and can then match the combination RECIST version 1.1 data. This suggests that growth of nontarget lesions or appearance of new metastases may have additional mechanistic underpinnings than the simple dependence on the target lesion burden that we have proposed (as a surrogate for response to therapy).
Model simulations to guide patient selection for combination (pembrolizumab + ipilimumab) therapy
To assess the advantage of combination over pembrolizumab monotherapy, 1000 hot lesions with initial TIL% greater than 5%, 1000 cold lesions with initial TIL% less than 1.5% and 1000 warm lesions with intermediary TILs were simulated. The lesions were distributed uniformly over the TIL% range in each bucket. The model was simulated such that each lesion was treated for 1 year with pembrolizumab monotherapy and the combination of pembrolizumab and ipilimumab (Figure 8). This shows that the advantage of combination over pembrolizumab is small in both hot and cold lesions. Warm lesions show substantial change in tumor diameter reduction from 0% to −40% (mean across 1000 lesions) in response to pembrolizumab and combination, respectively.
FIGURE 8.
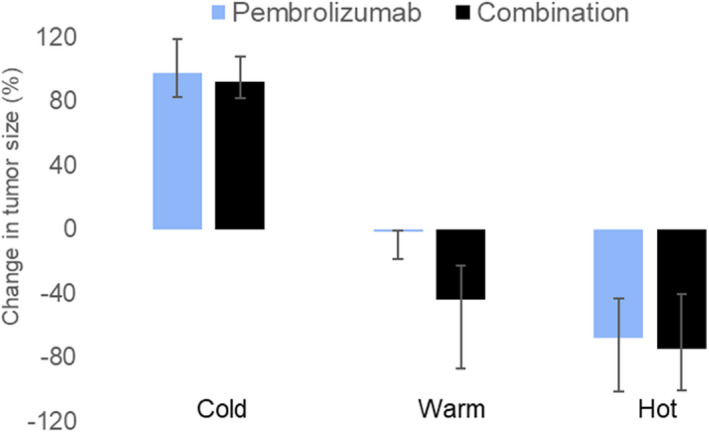
Comparison of simulated mean percent change (+ 1SD) in tumor diameter in response to pembrolizumab monotherapy (light blue) and pembrolizumab + ipilimumab combination therapy (black), by varying baseline tumor infiltrating lymphocytes (TILs) in the tumor microenvironment (TME) with combination therapy. We have defined cold as TIL less than 1.5% and hot as TIL greater than 5% and warm are intermediary TIL%. dSLD, change in sum of longest diameter; ORR, objective response rate; PD, progressive disease; RECIST, Response Evaluation Criteria in Solid Tumors; SD, stable disease; Sims, simulations
Mechanistically, the model showed T cell infiltration in median cold lesions was ~ 1% for pembrolizumab, increasing to only ~ 1.7% in response to combination treatment. For hot lesions, the T cell infiltration was 20% for pembrolizumab and increased to 32% in response to combination treatment, showing some enhancement in efficacy due to combination. In warm lesions, the model showed that T cell infiltration doubled from 8% with pembrolizumab treatment to 16% with combination treatment. However, in the clinical setting, because most patients with warm lesions (as in Figure 8, median change in warm lesions diameter = 0%) also have cold lesions (median change in cold lesions diameter > +20%), combination therapy is predicted to both reduce average tumor burden (via shrinking of warm lesions) and fail to prevent progression (as cold lesions continue to grow).
DISCUSSION
The goal of adding a combination agent is to improve the efficacy of pembrolizumab, which is increasingly becoming the first line of treatment across cancer types. 24 Guiding combination strategy requires characterization of lesion level response to pembrolizumab. A QSP model of melanoma was developed and calibrated to the clinical efficacy outcomes (change in tumor size from waterfall plots and RECIST version 1.1 scores) reported with pembrolizumab and ipilimumab monotherapies in melanoma. 5 , 7 , 14 In this model, heterogeneous target lesions, nontarget lesion growth, and appearance of new metastatic lesions were considered to mathematically model determination of PD. Simulations show that most patients with PD display a mix of growing (nonresponding) and shrinking (responding) lesions as well as can become progressive due to reasons other than target lesion growth. In other words, thinking of PD simplistically in terms of growth of a single, average tumor in a patient can be misleading.
Without changing any parameter, the model was able to predict the tumor‐size change reported clinically with the combination of pembrolizumab and ipilimumab. 6 However, the model underestimated the ORR in combination. This discrepancy lies in the model’s inability to characterize progression due to growth of nontarget lesions or the appearance of new metastatic lesions in combination. For example, there is clinical evidence suggesting that the appearance of metastatic lesions may be delayed with the combination relative to pembrolizumab. 6 This change in appearance of metastases and its mechanistic underpinning, which may depend on factors other than target lesion response alone, will be investigated in future work.
The incorporation of intrapatient lesion level heterogeneity in our simulations provided insights into the limitations of combinations of checkpoint inhibitors. Most patients with PD display a mix of growing and shrinking lesions. The lesion level simulations of pembrolizumab and ipilimumab combination therapy show substantial efficacy in warm lesions (intermediary immunogenicity) but limited advantage of combination in both cold (low immunogenicity) and hot lesions (high immunogenicity). The combination advantage in hot lesions is limited as pembrolizumab on its own is expected to effectively shrink these lesions. These simulation results provide insights of future combinations. Specifically, disease progression in many patients in the metastatic setting can be driven by a subset of cold lesions that are unresponsive to checkpoint inhibitors.
IO QSP models will be able to better predict clinical outcomes if they can consider the impact of therapies at lesion level versus the aggregate change in the dSLA of all lesions. However, there are limited lesion level data in the public literature on the heterogeneous causes of PD other than average target lesion growth. This work develops a mathematical framework that will be improved with proprietary, individual patient data in the future.
CONCLUSIONS
Checkpoint inhibitors have shown remarkable efficacy in melanoma. However, disease progression is still a problem for many patients. Combinations with IO treatments are needed to improve clinical outcome. A clinical QSP model was developed to mechanistically assess the pembrolizumab and ipilimumab combination benefit in melanoma. Many patients with cancer have heterogeneous lesions (i.e., cold, warm or hot lesions), 23 as well as reach disease progression due to reasons such as nontarget lesion growth and/or appearance of a lesion growth. 3 The combination of checkpoint inhibitors, such as pembrolizumab and ipilimumab, is not sufficient to shrink all lesions, in particular cold lesions, which ultimately leads to disease progression. A combination strategy of orthogonal therapies (e.g., combination of pembrolizumab with non‐IO drugs) that can also target cold lesions is needed to expand clinical benefit of IO therapies in a wider patient population.
CONFLICT OF INTEREST
B.T., K.M., and D.A. are employees of Merck Sharp & Dohme Corp., a subsidiary of Merck & Co., Inc., Kenilworth, NJ, USA (MSD). L.L. was an employee of MSD at the time of this work. R.K. and K.T. are employees of Vantage Research. L.J. was employed at Vantage Research at the time of this work.
AUTHOR CONTRIBUTIONS
R.K., K.T., B.T., and K.M. wrote the manuscript. R.K., D.A., K.M., and B.T. designed the research. R.K. and K.T. performed the research. L.J. and L.L. analyzed the data.
Supporting information
Supplementary Material
Supinfo
Supplementary Material
ACKNOWLEDGEMENTS
The authors thank Tamara Ray and Mrittika Roy, Vantage Research, for clinical and biological data extraction and Aparna Mohan, Vantage Research, for simulation support in figures for the paper revision. The authors also thank Daniel Rosenbloom, Merck & Co., Inc., Kenilworth, NJ, USA, and Aparna Mohan, Vantage Research, for reviewing the model scripts.
Funding information
Funding for this research was provided by Merck Sharp & Dohme Corp., a subsidiary of Merck & Co., Inc., Kenilworth, NJ, USA.
REFERENCES
- 1. Chelliah V, Lazarou G, Bhatnagar S, et al. Quantitative Systems Pharmacology approaches for Immuno‐oncology: adding virtual patients to the development paradigm. Clin Pharmacol Ther. 2021;109(3):605‐618. [DOI] [PMC free article] [PubMed] [Google Scholar]
- 2. Peskov K, Azarov I, Chu L, et al. Quantitative mechanistic modeling in support of pharmacological therapeutics development in immuno‐oncology. Front Immunol. 2019;10:924. [DOI] [PMC free article] [PubMed] [Google Scholar]
- 3. Topp B, Kumar R, Mayawala K, de Alwis D , Hellmann M, Snyder A. "Inter‐tumoral heterogeneity of progressive disease in melanoma patients treated with pembrolizumab," in Cancer Res (AACR Virtual Special Conference on Tumor Heterogeneity: From Single Cells to Clinical Impact), Virtual, September 17–18, 2020.
- 4. Channavazzala M, Thiagarajan K, Ray T, et al. Using an IO QSP model to re‐define efficacy, discontinuation criteria, and biomarker analysis. ACoP11. 2020;2:325. ISSN:2688‐3953. [Google Scholar]
- 5. Robert C, Schachter J, Long GV, et al. Pembrolizumab versus ipilimumab in advanced melanoma. N Engl J Med. 2015;372:2521‐2532. [DOI] [PubMed] [Google Scholar]
- 6. Long GV, Atkinson V, Cebon JS, et al. Standard‐dose pembrolizumab in combination with reduced‐dose ipilimumab for patients with advanced melanoma (KEYNOTE ‐ 029): an open label, phase 1b trial. Lancet Oncol. 2017;18(9):1202‐1210. [DOI] [PubMed] [Google Scholar]
- 7. Robert C, Ribas A, Wolchok JD, et al. Anti‐programmed‐death‐receptor‐1 treatment with pembrolizumab in ipilimumab refractory advanced melanoma: a randomised dose‐comparison cohort of a phase 1 trial. Lancet. 2014;384:1109‐1117. [DOI] [PubMed] [Google Scholar]
- 8. Tumeh PC, Harview CL, Yearley JH, et al. PD‐1 blockade induces response by inhibiting adaptive immune resistance. Nature. 2014;515(7528):568‐571. [DOI] [PMC free article] [PubMed] [Google Scholar]
- 9. Gadkar K, Kirouac DC, Mager DE, van der Graaf P, Ramanujan S. A six‐stage workflow for robust application of systems pharmacology. CPT Pharmacometrics Syst Pharmacol. 2016;5(5):235‐249. [DOI] [PMC free article] [PubMed] [Google Scholar]
- 10. Daud AI, Loo K, Pauli ML, et al. Tumor immune profiling predicts response to anti‐PD‐1 therapy in human melanoma. J Clin Invest. 2016;126(9):3447‐3452. [DOI] [PMC free article] [PubMed] [Google Scholar]
- 11. Huang AC, Postow MA, Orlowski RJ, et al. T‐cell invigoration to tumor burden ratio associated with anti‐PD‐1 response. Nature. 2017;545(7652):60‐65. [DOI] [PMC free article] [PubMed] [Google Scholar]
- 12. Buchbinder E, Desai A. CTLA‐4 and PD‐1 pathways: similarities, differences and implications of their inhibition. Am J Clin Oncol. 2016;39(1):98‐106. [DOI] [PMC free article] [PubMed] [Google Scholar]
- 13. Seidel JA, Otsuka A, Kabashima K. Anti‐PD‐1 and Anti‐CTLA‐4 therapies in cancer: mechanism of action, efficacy and limitations. Front Oncol. 2018;8:86. [DOI] [PMC free article] [PubMed] [Google Scholar]
- 14. Patnaik A, Kang SP, Rasco D, et al. Phase I study of pembrolizumab (MK3475; anti‐PD‐1 monoclonal antibody) in patients with advanced solid tumors. Clin Cancer Res. 2015;21(19):4286‐4293. [DOI] [PubMed] [Google Scholar]
- 15. Erdag G, Schaefer JT, Smolkin ME, et al. Immunotype and immunohistologic characteristics of tumor‐infiltrating immune cells are associated with clinical outcome in metastatic melanoma. Cancer Res. 2012;72(5):1070‐1080. [DOI] [PMC free article] [PubMed] [Google Scholar]
- 16. Ribas A, Hamid O, Daud A, et al. Association of pembrolizumab with tumor response and survival among patients with advanced melanoma. JAMA. 2016;315(15):1600‐1609. [DOI] [PubMed] [Google Scholar]
- 17. Carlson JA. Tumor doubling time in cutaneous melanoma and its metastasis. Am J Dermatopathol. 2003;25(4):291‐299. [DOI] [PubMed] [Google Scholar]
- 18. Hamid O, Robert C, Daud A, et al. Safety and anti‐tumor responses with lambrolizumab (anti‐PD‐1) in melanoma. N Engl J Med. 2013;369(2):134‐144. [DOI] [PMC free article] [PubMed] [Google Scholar]
- 19. Klinke D 2nd. Integrating epidemiological data into a mechanistic model of Type 2 diabetes: validating the prevalence of virtual patients. Ann Biomed Eng. 2008;36(2):321‐334. [DOI] [PubMed] [Google Scholar]
- 20. Schmidt B, Casey F, Paterson T, Chan J. Alternate virtual populations elucidate the type I interferon signature predictive of the response to rituximab in rheumatoid arthritis. BMC Bioinformatics. 2013;14:221. [DOI] [PMC free article] [PubMed] [Google Scholar]
- 21. Allen RJ, Rieger TR, Musante CJ. Efficient generation and selection of virtual populations in quantitative systems pharmacology models. CPT Pharmacometrics Syst Pharmacol. 2016;5:140‐146. [DOI] [PMC free article] [PubMed] [Google Scholar]
- 22. Schwartz LH, Seymour L, Litière S, et al. RECIST 1.1 ‐ standardisation and disease‐specific adaptations: perspectives from the RECIST Working Group. Eur J Cancer. 2016;62:138‐145. [DOI] [PMC free article] [PubMed] [Google Scholar]
- 23. Osorio JC, Arbour KC, Le DT, et al. Lesion‐level response dynamics to programmed cell death protein (PD‐1) blockade. J Clin Oncol. 2019;37(36):3546‐3555. [DOI] [PMC free article] [PubMed] [Google Scholar]
- 24. FDA . “Highlights of prescribing information,” FDA, 2019. [Online]. Available at: https://www.accessdata.fda.gov/drugsatfda_docs/label/2019/125514s040lbl.pdf
Associated Data
This section collects any data citations, data availability statements, or supplementary materials included in this article.
Supplementary Materials
Supplementary Material
Supinfo
Supplementary Material


