

Abstract
Background
Long-term effects of Coronavirus Disease of 2019 (COVID-19) are of utmost relevance.
We aimed to determine: 1) the functional capacity of COVID-19 survivors by cardiopulmonary exercise testing (CPET); 2) the characteristics associated with cardiopulmonary exercise testing (CPET) performance; 3) the safety and tolerability of CPET.
Methods
We prospectively enrolled consecutive patients with laboratory-confirmed COVID-19 from Azienda Sanitaria Locale 3, Genoa. Three months after hospital discharge a complete clinical evaluation, trans-thoracic echocardiography, CPET, pulmonary function tests, and dominant leg extension (DLE) maximal strength measurement were performed.
Results
From the 225 patients discharged alive from March to November 2020, we excluded 12 incomplete/missing cases and 13 unable to perform CPET, leading to a final cohort of 200. Median percent-predicted peak oxygen uptake (%pVO2) was 88% (78.3–103.1).
Ninety-nine (49.5%) patients had %pVO2 below, whereas 101 (50.5%) above the 85% predicted value.
Among the 99 patients with reduced %pVO2, 61 (61%) had a normal anaerobic threshold: of these, 9(14.8%) had respiratory, 21(34.4%) cardiac, and 31(50.8%) non-cardiopulmonary reasons for exercise limitation. Inerestingly, 80% of patients experienced at least one disabling symtpom, not related to %pVO2 or functional capacity.
Multivariate linear regression showed percent-predicted forced expiratory volume in one-second(β = 5.29,p = 0.023), percent-predicted diffusing capacity of lungs for carbon monoxide(β = 6.31,p = 0.001), and DLE maximal strength(β = 14.09,p = 0.008) to be independently associated with pVO2.
No adverse event was reported during or after CPET, and no involved health professional developed COVID-19.
Conclusions
At three months after discharge, about 1/3rd of COVID-19 survivors show functional limitations, mainly explained by muscular impairment, calling for future research to identify patients at higher risk of long-term effects that may benefit from careful surveillance and targeted rehabilitation.
Keywords: COVID-19, Coronavirus infection, Severe acute respiratory syndrome, Lung diseases, Cardiopulmonary exercise testing, Coronavirus
1. Introduction
Up to July 2021, the Coronavirus Disease of 2019 (COVID-19) pandemic accounts for more than 194 million confirmed cases and more than 4 million deaths worldwide [1].
COVID-19 is a respiratory disease, but cardiovascular (CV) alterations are associated with worse prognosis [[2], [3], [4], [5], [6]]. For the chronic phase, the main concerns are the development of pulmonary interstitial disease and/or of lingering CV involvement [7], potentially explained by a Severe Acute Respiratory Syndrome-Coronavirus type 2 (SARS-CoV2)-associated endothelitis [8]. How to intercept, assess, and treat these patients with long-term consequences of COVID-19 remains uncertain [[9], [10], [11], [12]].
Objective clinical and functional data on long-term functional effects in COVID-19 patients are scarce. Therefore, the aims of the study are: 1) to evaluate pulmonary, and cardiac functional capacity of COVID-19 survivors by performing cardio-pulmonary exercise testing (CPET) at three months; 2) to identify those baseline and clinical characteristics associated to worse performance at CPET; 3) to determine the safety and the tolerability of CPET for COVID-19 survivors and for medical staff, as well.
2. Methods
2.1. Study subjects
We included consecutive patients undergoing post-COVID-19 evaluation at the Outpatient Cardiac Rehabilitation center of Genoa, Italy. The local healthcare authority (Azienda Sanitaria Locale, ASL 3 Genovese) set up a structured follow-up program for patients with a history of reverse transcriptase-polymerase chain reaction (RT-PCR)-confirmed SARS-CoV-2 infection admitted to COVID-19 wards from 1st of March 2020 to date (recruitment is still ongoing).
2.2. Study design
At 3 months from hospital discharge, COVID-19 patients received a complete clinical evaluation, trans-thoracic echocardiography (TTE), pulmonary function test (PFT), and muscular strength evaluation with dominant leg extension (DLE) maximal test and sit-to-stand test.
All procedures and protocols are described in detail in Supplementary Material.
2.3. Safety measures
The study protocol was designed and started during the first wave of the pandemic in Italy, thusthe safety of any testing procedure both for patients and medical staff was of major concern.
The safety protocol required two consecutive negative RT-PCR swabs for SARS-CoV-2 at least 24 h apart before the patient could be admitted to the clinical evaluation, and the use of appropriate personal protection equipment (disposable surgical gowns, gloves, face masks, face shield or goggles, and operating room cap) for all the medical staff, as per guidelines [13].
2.4. Cardiopulmonary exercise testing
Every patient received a symptoms-limited CPET, according to European Respiratory Society (ERS) standard criteria [14]. COSMED system (Quark CPET, COSMED, Rome, Italy) with an electronically braked cycle ergometer (Excalibur Sport, Lode, Groningen, Germany) was used. An incremental and symptom-limited CPET was conducted under the supervision of an expert physician.
The symptom-slimited CPET was carried out adding a specific antibacterial/antiviral filter (A-182-300-004 filter, COSMED, Rome, Italy). This would ensure a 99.999% viral filtering without interfering with the gas exchange and respiratory measurement up to ventilations of 200 L/min, almost double of the filtering reached by our best performing patients [15].
To indentify the main reason causing the exercise limitation, we adopted both Wassermann and ERS criteria [14,16].
The main limiting r reason was independently identified by two experienced cardiopulmonary exercise testing researchers (C.B. and A.P.); when the interpretation was discordant, a third evaluation by a senior CPET researcher (P.C.) was performed.
2.5. Ethics
All patients signed an informed consent as per protocol, and to allow the use of their anonymized data for scientific purpose.
The study protocol conformed to the Declaration of Helsinki and was approved by the Ethics Committee of the Liguria Region (n° 430/2020CER).
2.6. Statistical analysis
Categorical variables are presented as frequencies and percentages and were compared by chi-square test or Fisher's exact-test. Continuous variables are reported as mean and standard deviation (SD) or median and interquartile range (IQR) according to their distribution. Normally distributed variables were compared by means of unpaired Student's t-test. Non-normally distributed variables were compared with the U Mann-Whitney non-parametric test.
The main outcome measure was peak VO2 (pVO2), although patients were categorized according to percent predicted (%pVO2) below or above 85% (considered as threshold for normality) [14].
A multivariate linear regression model was used to estimate the beta coefficients with 95% confidence interval (CI) of the variables related to pVO2. The model was adjusted for time from hospital discharge to CPET and for all clinically meaningful covariates exhibiting a p < 0.10 at univariate analysis.
A sensitivity analysis was also performed in the following cohorts: 1) those with and without significant cardiovascular disease (except for arterial hypertension), respiratory disease, kidney disease, or cancer (representing previous disease that could have impacted on CPET results regardless of COVID-19); 2) those with a length of hospital stay ≤7 days (indicating rapid recovery from symptomatic COVID-19, a subset in which muscular deconditioning is unlikely).
All analyses were performed with R environment 3.6.3 (R. Foundation for Statistical Computing, Vienna, Austria) and packages tableone, finalfit, and ggplot2.
3. Results
Of the 225 patients evaluated, we excluded 12 for missing clinical data and/or incomplete CPET/PFT evaluation, and another 13 as they were unable to perform CPET (10 because of orthopedic reasons, 2 unable to pedal, and 1 for general frailty).
Table 1 depicts the characteristics of the final 200 patients. Median age was 58.8 years (51.6–66.0) and 86 (43%) patients were female; pharmacological therapy included beta-blockers in 24 (12.0%) patients, angiotensin-converting enzyme inhibitor (ACE)/angiotensin receptor blockers (ARB) in 45 (22.5%), alfa-blockers in 7 (3.5%).
Table 1.
Characteristics of the study patients stratified according to percent predicted VO2 below/above 85%.
| Variable | Entire cohort (n = 200) | Percentage predicted VO2 below 85% (n = 99) | Percentage predicted VO2 above 85% (n = 101) | p value |
|---|---|---|---|---|
| Baseline and clinical characteristics | ||||
| Age (years) | 58.8 (51.6–66.0) | 57.0 (51.0–65.4) | 59.8 (52.8–67.1) | 0.124 |
| Sex (female) | 86 (43.0) | 41 (41.4) | 45 (44.6) | 0.760 |
| Height (centimeters) | 168.0 (163.0–176.0) | 170.0 (163.0–175.5) | 168.0 (163.0–176.0) | 0.942 |
| Body weight (kg) | 81.0 (69.0–92.0) | 80.0 (67.2–90.0) | 82.0 (70.0–95.0) | 0.218 |
| Body mass index (kg/m2) | 26.6 (24.1–30.2) | 26.0 (23.4–29.4) | 27.7 (25.0–31.2) | 0.027 |
| Hypertension | 83 (41.5) | 45 (45.5) | 38 (37.6) | 0.327 |
| Diabetes | 12 (6.0) | 10 (10.1) | 2 (2.0) | 0.034 |
| Active smoke | 85 (42.5) | 49 (49.5) | 36 (35.6) | 0.136 |
| Dyslipidemia | 76 (38.0) | 33 (33.3) | 43 (42.6) | 0.230 |
| CKD | 6 (3.0) | 5 (5.1) | 1 (1.0) | 0.205 |
| Heart failure | 10 (5.0) | 6 (6.1) | 4 (4.0) | 0.567 |
| Previous MI | 12(6.0) | 7(7.1) | 5 (5.0) | 0.127 |
| COPD | 15 (7.5) | 8 (8.1) | 7 (6.9) | 0.968 |
| Oxygen support during hospitalization | ||||
| No | 22 (11.0) | 14 (14.1) | 8 (7.9) | 0.002 |
| Venturi mask | 74 (37.0) | 25 (25.3) | 49 (48.5) | |
| NIV | 75 (37.5) | 39 (39.4) | 36 (35.6) | |
| MV | 29 (14.5) | 21 (21.2) | 8 (7.9) | |
| Steroid therapy | 200 (100.0) | 99 (100.0) | 101 (100.0) | 1.000 |
| Baseline ejection fraction | 60.0 (60.0–60.0) | 60.0 (55.0–60.0) | 60.0 (60.0–60.0) | 0.030 |
| Time from hospital discharge to CPET (days) |
107.0 (83.0–189.0) | 102.4 (74.2–166.0) | 111.0 (84.0–202.0) | 0.407 |
| Length of hospital stay (days) | 17.0 (5.0–32.0) | 23.5 (10.0–38.0) | 14.0 (3.0–24.0) | 0.001 |
| Three-month clinical evaluation | ||||
| 6MWT (meters) | 540.0 (476.2–597.5) | 525.0 (450.0–577.5) | 540.0 (480.0–600.0) | 0.061 |
| Ejection fraction | 60.0 (60.0–60.0) | 60.0 (55.0–60.0) | 60.0 (60.0–60.0) | 0.092 |
| Body weight (kg) | 77.0 (66.0–88.0) | 73.0 (65.0–84.0) | 78.0 (67.0–90.0) | 0.032 |
| Absolute weight loss (kg) | 7.0 (4.0–11.0) | 7.0 (5.0–12.0) | 6.0 (4.0–10.0) | 0.133 |
| Percent weight loss (%) | 8.8 (5.4–13.0) | 10.0 (6.7–15.3) | 7.9 (5.1–12.1) | 0.031 |
| Body mass index (kg/m2) | 26.6 (24.1–30.2) | 26.0 (23.4–29.4) | 27.7 (25.0–31.2) | 0.027 |
| Dyspnea | 118 (59.0) | 64 (64.6) | 54 (53.5) | 0.143 |
| NYHA class III/IV | 54 (27.0) | 34 (34.3) | 20 (19.8) | 0.058 |
| Chest pain | 63 (31.5) | 34 (34.3) | 29 (28.7) | 0.481 |
| Angina pectoris | 14 (7.0) | 9 (9.1) | 5 (5.0) | 0.342 |
| Fatigue | 115 (57.5) | 60(60.6) | 55 (54.5) | 0.069 |
| Palpitations | 51 (25.5) | 25 (25.3) | 26 (25.7) | 1.000 |
| Lipothymia/syncope | 1 (0.5) | 0 (0.0) | 1 (1.0) | 1.000 |
| Three-month cardiopulmonary exercise testing | ||||
| Reason for CPET interruption | ||||
| Exhaustion/leg fatigue | 186 (93.0) | 90 (90.9) | 75 (74.3) | 0.782 |
| Dyspnea | 10 (5.0) | 6 (6.1) | 4 (4.0) | |
| New arrhythmia | 4 (2.0) | 3 (3.0) | 1 (1.0) | |
| Peak VO2 (ml O2/min) | 1507.0 (1191.8–1976.8) | 1258.0 (1054.5–1588.5) | 1730.0 (1410.0–2258.0) | <0.001 |
| Percent predicted peak VO2 (%) | 85.0 (74.0–98.2) | 74.0 (63.5–79.2) | 98.1 (89.7–111.0) | <0.001 |
| Peak VO2/kg (mL O2/min /kg) | 20.1 (16.5–24.4) | 17.7 (14.6–20.2) | 23.0 (19.2–28.0) | <0.001 |
| Peak W (Watt) | 121.5 (91.8–165.2) | 103.0 (82.5–144.5) | 137.0 (112.0–187.0) | <0.001 |
| Percent predicted peak W (%) | 90.2 (67.8–110.1) | 63.0 (50.3–71.7) | 105.2 (92.8–119.7) | <0.001 |
| Peak HR (beat/min) | 149.0 (133.8–161.0) | 143.0 (121.5–157.5) | 152.0 (142.0–164.0) | 0.001 |
| Percent predicted HR (%) | 91.9 (82.2–98.2) | 85.0 (76.0–95.0) | 95.0 (89.0–99.4) | <0.001 |
| OUES | 1695.0 (1363.2–2169.5) | 1487.0 (1175.0–1853.0) | 1959.0 (1578.0–2379.0) | <0.001 |
| RER | 1.1 (1.1–1.2) | 1.1 (1.0–1.2) | 1.1 (1.1–1.2) | 0.597 |
| VE (L/min) | 66.8 (52.3–87.9) | 61.0 (45.6–73.8) | 74.2 (61.3–96.6) | <0.001 |
| VT (mL) | 1729.0 (1385.2–2188.2) | 1593.0 (1208.0–1974.0) | 1900.0 (1526.0–2435.0) | <0.001 |
| BR (breath/min) | 39.2 (34.3–43.9) | 38.0 (32.9–42.9) | 39.8 (35.4–45.7) | 0.032 |
| BrR | 50.9 (40.9–60.0) | 55.6 (47.9–59.7) | 48.6 (35.7–60.5) | 0.019 |
| AT W (watt) | 68.0 (48.0–93.0) | 60.0 (38.5–81.0) | 77.0 (57.0–103.0) | <0.001 |
| AT VO2 (mL O2/min) | 1019.5 (822.0–1283.8) | 899.0 (747.0–1076.0) | 1168.0 (963.0–1435.0) | <0.001 |
| AT HR (beat/min) | 113.0 (101.0–125.2) | 109.0 (98.5–125.5) | 114.0 (103.0–125.0) | 0.331 |
| Pulmonary function testing | ||||
| FEV1 (L) | 2.9 (2.5–3.7) | 2.9 (2.4–3.5) | 3.0 (2.5–3.8) | 0.418 |
| Percent predicted FEV1 (%) | 102.0 (89.0–113.0) | 95.5 (82.2–108.0) | 108.0 (92.8–116.0) | <0.001 |
| FVC (L) | 3.6 (3.0–4.4) | 3.5 (3.0–4.3) | 3.7 (3.0–4.5) | 0.443 |
| Percent predicted FVC (%) | 99.0 (85.5–109.0) | 95.0 (79.5–104.0) | 102.0 (91.0–111.0) | 0.001 |
| Percent FEV1/FVC (%) | 104.0 (99.0–110.0) | 104.0 (98.0–109.8) | 105.0 (100.0–113.0) | 0.089 |
| Percent predicted DLCO (%) | 77.0 (62.0–90.0) | 70.0 (56.0–83.5) | 85.5 (72.5–98.0) | <0.001 |
| Strength evaluation | ||||
| DLE maximal strength (kg) | 22.0 (14.2–30.0) | 20.0 (14.0–30.0) | 22.0 (15.0–30.0) | 0.654 |
| DLE maximal strength per BW | 0.3 (0.2–0.4) | 0.3 0.2–0.4) | 0.3 (0.2–0.4) | 0.845 |
| Sit-to-stand test | 10.5 (9.3–13.2) | 10.7 (9.3–13.2) | 10.5 (9.4–12.7) | 0.849 |
6MWT: 6 min walking test; AT: anaerobic threshold; BR: breathing rate; BrR: breathing reserve; CKD: chronic kidney disease; COPD: chronic obstructive pulmonary disease; CPET: cardiopulmonary exercise testing; DLCO: diffusing capacity of lungs for carbon monoxide; DLE: dominant leg extension; FEV1: forced expiratory volume in one second; FVC: forced vital capacity. HR: heart rate; MI: myocardial infarction; MV: mechanical ventilation; MVV: maximal voluntary ventilation; NIV: non-invasive ventilation; OUES: oxygen uptake efficiency slope; Peak VO2: peak oxygen uptake; RER: respiratory exchange ratio; VE= minute ventilation; VT= tidal volume; W: work level.
At hospital admission, median body weight (BW) was 81.0 (69.0–92.0) kg, median body mass index (BMI) was 28.1 (24.6–32.0) kg/m2. At the time of CPET, median BW was 77.0 (66.0–88.0) kg, median percent weight loss was 8.8 (5.4–13.0) %, and median BMI was 26.6 (24.1–30.2) kg/m2; both BW (p = 0.025) and BMI (p = 0.039) significantly decreased between hospital admission and CPET evaluation. Except for 10 (4.8%) patients with heart failure with reduced ejection fraction (HFrEF), of whom 4 (2.0%) showed a severe reduction in EF (<30%), and for 15 (7.5%) with chronic obstructive pulmonary disease (COPD), of whom 5 with concomitant HFrEF, there were no significant pre-existing comorbidities at the time of COVID-19 infection.
.
3.1. Three-month clinical evaluation
At the 3-month clinical evaluation, 160 (80.0%) patients reported at least one disabling symptom: 83/99 (83.3%) among those with %pVO2 below and 74/101 (73.4%) among those above 85% (p > 0.05). Of note, 118/200 (59.0%) patients complained of dyspnea, of whom 54/200 (27.0%) were in NYHA class III/IV, 63/200 (31.5%) had chest pain, 115/200 (57.5%) had fatigue, and 51/200 (25.5%) complained of palpitations. Symptoms frequencies did not differ between patients with %pVO2 below and above 85% predicted value (all p > 0.05).
Patients with %pVO2 below 85% had lower median 6-min walking test distance than patients with %pVO2 above 85% (525.0 (450.0–577.5) vs. 540 (480.0–600.0) meters, p = 0.064).
3.2. Cardiopulmonary exercise testing
The reason for CPET interruption was exhaustion/leg fatigue in 93.0% patients, dyspnea in 5%, and arrhythmia induced by exercise in 2.0% (see Table 1). Median %pVO2 was 88.0 (78.3–103.1), with a median peak respiratory exchange ratio of 1.1 (1.1–1.2). Almost half of patients achieved a %pVO2 below 85% (reduced exercise tolerance), with the other half reaching a value of %pVO2above this cut-off (preserved exercise tolerance).
The anaerobic threshold (AT) was identified by V-slope and ventilatory equivalents for O2 methods.
Of the 99 patients with reduced %pVO2, 61 had normal AT. Among these, 9/61 (14.8%) had a mainly respiratory limitation of exercise (RLE), 21/61 (34.4%) had a mainly cardiac limitatoin of exercise (CLE), and 31/61 (50.8%) had non-cardiopulmonary limitation of exercise.
3.3. Safety and tolerability of CPET
The CPET test was well tolerated and only two cases (1.0%) showed a mild post exercise symptomatic hypotension. During the study period, lasting for more than nine months, the medical staff was periodically tested for asymptomatic COVID-19 infection and no positive cases were observed.
3.4. Pulmonary function tests
Median forced expiratory volume in one second (FEV1), forced vital capacity (FVC), and diffusing capacity of lungs for carbon monoxide (DLCO) were within normal limits in the entire cohort. However, those with %pVO2 below 85% had percent predicted FEV1 (p < 0.001), percent predicted FVC (p = 0.001), and percent predicted DLCO (p < 0.001) lower than patients with %pVO2 above 85%.
3.5. Predictors of peak oxygen uptake (VO2)
At multivariate linear regression analysis, percent predicted FEV1 (β = 5.29, 95%CI: 0.73–9.85, p = 0.023), percent predicted DLCO (β = 6.31, 95%CI: 2.49–10.13, p = 0.001), and DLE maximal strength (β = 14.09, 95%CI: 3.83–24.35, p = 0.008) (Fig. 1 ) were independently associated with pVO2 (Table 2 ).
Fig. 1.
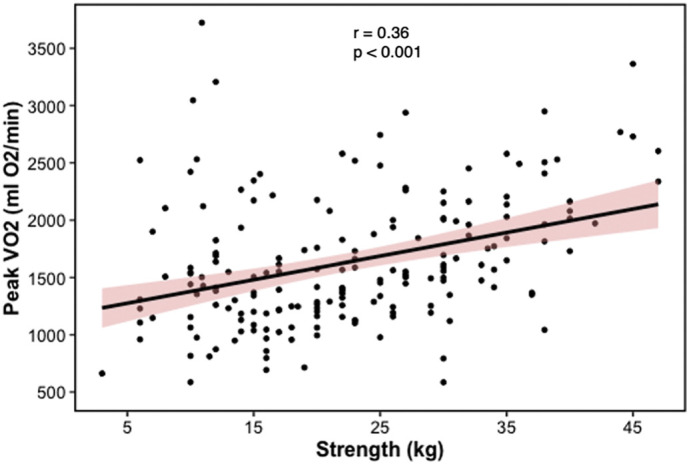
Scatterplot depicting the correlation between peak oxygen uptake (pVO2) and dominant leg extension strength.
Table 2.
Univariate and multivariate linear regression for peak oxygen uptake (pVO2).
| Variable | Univariate |
Multivariate |
||||
|---|---|---|---|---|---|---|
| β coefficient | 95% confidence interval |
p value | β coefficient | 95% confidence interval | p value | |
| Baseline and clinical characteristics | ||||||
| Age (years) | −10.89 | −17.22 to −4.55 | 0.001 | −6.64 | −14.21 to 0.94 | 0.085 |
| Sex (female) | −25.11 | −88.69 to 50.54 | 0.102 | |||
| Height (centimeters) | 24.90 | 17.03 to 32.77 | <0.001 | |||
| Body weight (kg) | 10.59 | 6.28 to 14.90 | <0.001 | |||
| Body mass index (kg/m2) | 14.19 | 0.43 to 27.95 | 0.043 | −10.66 | −60.70 to 39.37 | 0.673 |
| Hypertension | 17.20 | −150.95 to 185.35 | 0.840 | |||
| Diabetes | −472.91 | −815.45 to −130.36 | 0.007 | |||
| Active smoke | 0.60 | −153.59 to 154.79 | 0.994 | |||
| Dyslipidemia | −31.89 | −202.54 to 138.76 | 0.713 | |||
| CKD | −155.36 | −640.60 to 329.88 | 0.529 | |||
| Previous MI | −182.57 | −530.53 to 165.39 | 0.302 | |||
| COPD | −222.20 | −535.24 to 90.84 | 0.163 | |||
| Oxygen support (NIV/MV) | 27.12 | −138.68 to 192.93 | 0.747 | |||
| Ejection fraction | 13.41 | −7.91 to 34.74 | 0.216 | |||
| Time from hospital discharge to CPET (days) | −0.06 | −1.36 to 1.23 | 0.922 | |||
| Length of hospital stay (days) | −4.63 | −8.54 to −0.72 | 0.021 | 0.27 | −4.33 to 4.87 | 0.907 |
| 3-month clinical evaluation | ||||||
| 6MWT (meters) | 1.99 | 1.21 to 2.77 | <0.001 | 1.06 | −0.13 to 2.26 | 0.080 |
| Ejection fraction | 13.41 | −7.91 to 34.74 | 0.216 | |||
| Body weight (kg) | 13.64 | 9.02 to 18.26 | <0.001 | |||
| Absolute weight loss (kg) | 4.41 | −9.40 to 18.21 | 0.530 | |||
| Percent weight loss (%) | −7.21 | −20.96 to 6.54 | 0.302 | |||
| Body mass index (kg/m2) | 19.46 | 4.45 to 34.47 | 0.011 | 27.26 | −26.34 to 80.87 | 0.315 |
| Dyspnea (NYHA class III/IV) | −189.07 | −355.44 to −22.69 | 0.026 | −24.32 | −431.34 to 35.12 | 0.069 |
| Chest pain | −63.92 | −242.07 to 114.23 | 0.480 | |||
| Fatigue | −331.16 | −492.22 to 170.10 | 0.104 | |||
| Palpitations | −374.47 | −557.19 to −191.76 | <0.001 | |||
| Pulmonary function test | ||||||
| Percent predicted FEV1 (%) | 10.44 | 6.63 to 14.26 | <0.001 | 5.29 | 0.73 to 9.85 | 0.023 |
| Percent predicted FVC (%) | 9.62 | 5.34 to 13.90 | <0.001 | |||
| Percent predicted FEV1/FVC (%) | 8.98 | 1.60 to 16.36 | 0.017 | |||
| Percent predicted PEF (%) | 6.76 | 0.38 to 13.13 | 0.038 | |||
| Percent predicted DLCO (%) | 10.62 | 6.95 to 14.29 | <0.001 | 6.31 | 2.49 to 10.13 | 0.001 |
| Strength evaluation | ||||||
| DLE maximal strength (kg) | 20.55 | 12.67 to 28.43 | <0.001 | 14.09 | 3.83 to 24.35 | 0.008 |
| DLE maximal strength x BW | 813.81 | 108.40 to 1519.23 | 0.024 | |||
6MWT: 6 min walking test; BW: body weight; CKD: chronic kidney disease; COPD: chronic obstructive pulmonary disease; DLCO: diffusing capacity of lungs for carbon monoxide; DLE: dominant leg extension; FEV1: forced expiratory volume in one second; FVC: forced vital capacity. MI: myocardial infarction; MV: mechanical ventilation; NIV: non-invasive ventilation.
3.6. Sensitivity analysis
In the sub-group of patients without any significant cardiovascular disease (except for arterial hypertension), respiratory disease, kidney disease, or cancer, percent predicted FEV1 (p = 0.013), percent predicted DLCO (p = 0.018) and DLE maximal strength (p = 0.041), and 6-min walking test (p = 0.025) were independently associated with pVO2 (Table S1).
Percent predicted DLCO (p = 0.018) and DLE maximal strength (p = 0.007) remained independently associated with pVO2 in the sub-group of patients with significant history of cardiovascular disease (except for arterial hypertension), respiratory disease, kidney disease, or cancer (Table S2).
In the sub-group of patients with length of hospital stay ≤7 days, percent predicted FEV1 (p = 0.039), percent predicted DLCO (p = 0.037) and DLE maximal strength (p = 0.029) remained significantly associated with pVO2 (Table S3).
4. Discussion
These main findings deserve mention: 1) about half of COVID-19 survivors had a significant alteration in pVO2 3 months after hospital discharge; 2) in nearly 1/3rd (31/99) of patients with reduced %pVO2, this was probably due to abnormal peripheral oxygen extraction,linked to some degree of muscle impairment, as DLE maximal strength was independently associated with pVO2; 3) 80% of patients experimented at least one disabling symptom at 3 months after hospital discharge, although there was no relationship between symptoms and abnormal pVO2; 4) cardiopulmonary exercise testing is both well tolerated and safe in post COVID-19; 5) cardiopulmonary exercise testing in post COVID-19 patients is also safe for the supervising medical staff,.
Our results are in agreement with those of Ong et al. [17], who found a 41% prevalence of reduced pVO2 among 44 SARS 3-month survivors
On note, abnormal physical function and performance in COVID-19 survivors have been preliminarily described by Belli et al. [9], using 1-min sit-to-stand test and Short Physical performance Battery, without CPET.
Due to the ongoing and accelerating COVID-19 worldwide pandemic, our observations should raise important concerns for healthcare systems, as we proved that a large number of COVID-19 patients still had objective exercise impairment several months after hospital discharge.
Moreover, a cardiopulmonary cause related to the exercise capacity limitation and pVO2 reduction could be found in about half of post COVID-19 patients with normal AT.
Interestingly, DLE maximal strength was independently associated with pVO2, suggesting that muscle impairment might be responsible for most of the functional impairment, probably due to bed rest and subsequently muscular deconditioning, but also with a potential role for corticosteroid myopathy [18,19]. Our numbers are again similar to those of Ong et al. (about 40% had non-cardiopulmonary impairment in their post-SARS cohort), although steroids during acute illness was less frequently used in their sample (15% vs. 100%). The important role of muscular factors is compounded by the higher weight loss in patients with abnormal pVO2.
We believe, however, that the most important finding of our study is the relationship between pVO2 and maximal strength of the lower limb muscles, maintained even after accounting for cardiopulmonary variables, for length of hospitalization, and for baseline and 3-month body mass index. In our opinion this reduces the likelihood that bed rest, exercise deprivation and loss of muscle mass alone could cause this degree of impairment, raising the possibility of a direct effect of SARS-CoV2 at the muscle level. We only mention here the possibility of mitochondrial dysfunction [20], as several ongoing research projects are exploring its role on the pathogenesis of COVID-19 acute phase [[21], [22], [23]].
Interestingly, these results were also confirmed when we analyzed those patients with short length of hospital stay (≤ 7 days)
Finally, we demonstrate that almost 3/4th of patients experienced at least one disabling symptom, without any relationship with exercise capacity. Several studies have already investigated the residual symptoms burden of patients recovering from COVID-19, observing different rates between out-patients (about 35% in Tenforde et al.) [24] and patients who had needed hospitalization (87% in the study by Carfì et al.) [25]. We report relatively high rates of disabling symptoms (59% dyspnea, 58% fatigue). Halpin et al. described 68 non-ventilated survivors of COVID-19 infection [10], of whom 60% complained of muscular fatigue and 43.6% dyspnea; thesedata are again similar to our results,
It has been known for many years that most critically ill patients face long-lasting functional impairment after discharge [18]; what is worrying about our data is that we found severe mid-term consequences of COVID-19 also in non-ICU patients. This observation supports the need for targeted management of these patients also during the acute phase (e.g. applying appropriate nutrition and early mobilization plans). Moreover, as there was no relationship with pVO2, symptoms alone should not guide the post-acute management of COVID-19 patients: more objective techniques, such as CPET, should be used to rapidly intercept and assess the exercise impairment and its underlying mechanisms and, perhaps, to decide whether to start a physical rehabilitation program.
4.1. Clinical implications
Our study demonstrates that most of post COVID-19 patients have not reached a full recovery at three months. The vast majority of them complains of limiting symptoms and havereduced exercise capacity.
The CPET appears the only technique that gives unequivocal results regarding the actual existence of a functional capacity impairment and also insights about the mechanisms of this reduction.
From this point of view, we believe that CPET should be proposed to post COVID-19 patients complaining of limiting symptoms.
4.2. Limitations
Our study has several limitations. Firstly, all patients came from a single area of the city of Genoa and the generalization of results could be misleading. Secondly, the functional capacity evaluation was conducted three months after hospital discharge, with the patients left unsupervised in the meantime. No detailed data, except for risk factors and comorbidities, were available regarding the conditions before COVID-19; prior to the infection, however, only 20 patients (10.0%) reported to have suffered from significant baseline comorbidities which could have impacted on subsequent evaluations.
In addition, it was not possible to achieve a direct comparison of our cohort with a control group, since none of the patients had obviously undergone CPET before COVID-19 and few patients with other pathological conditions who usually undergo CPET could be compared with our cohort (e.g. median age 58.8 years, low rate (5.5%) of significant baseline comorbidities, and long (median 17.0 days) hospital stay).
Moreover, no structural evaluation at the muscle level was performed, and no data about body composition (except for BMI) was available.
Finally, due to the outbreak of COVID-19 that forced a limited physical interaction with patients, we did not perform blood gas analysis and pletismography for all patients, ad therefore we were unable to determine the exact main cause of exercise limitation for patients with reduced pVO2 and reduced AT. However, for these patients, we were able to rule out a peripheral cause of exercise limitation with reasonable certainty, [16].
Author contributions
PC, VDM, CB, AP, GP, RG, UC, IP participated into the conception and design of the work; RL, CR, FB, MB, LCB, FC, MS, AJH gave substantial contribution to acquisition, analysis, and interpretation of data for the work. PC, VDM, RL, GP, RG, UC, IP drafted the work and revised it critically for important intellectual content; CB, AP, CR, FB, MB, LCB, FC, MS, UC, AJH revised the paper critically for important intellectual content. All authors approved the final version to be published and agreed on all questions related to the accuracy or integrity of the work.
Funding sources
None of the authors received funding for this work.
Declaration of Competing Interest
The Authors declare that there is no conflict of interest.
Acknowledgements
We gratefully thank our nurses Tiziana Zappulla, Tiziana Cornero, Cristina Ferrari Aggradi, our physiotherapist Elisabetta Capurro, and our psychologist Marta Ferraris. Without their enthusiastic, dedicated, and highly professional work this study would not has been possible.
Footnotes
All authors takes responsibility for all aspects of the reliability and freedom from bias of the data presented and their discussed interpretation.
Supplementary data to this article can be found online at https://doi.org/10.1016/j.ijcard.2021.07.033.
Appendix A. Supplementary data
Supplementary methods and supplementary references
References
- 1.Worldometer https://www.worldometers.info/coronavirus/
- 2.Cardiology . 2020. TESf. ESC Guidance for the Diagnosis and Management of CV Disease during the COVID-19 Pandemic. [Google Scholar]
- 3.Kurz D.J., Eberli F.R. Cardiovascular aspects of COVID-19. Swiss Med. Wkly. 2020;150:w20417. doi: 10.4414/smw.2020.20417. [DOI] [PubMed] [Google Scholar]
- 4.Linschoten M., Peters S., van Smeden M., Jewbali L.S., Schaap J., Siebelink H.M., et al. Cardiac complications in patients hospitalised with COVID-19. Eur. Heart J. Acute Cardiovasc. Care. 2020;9:817–823. doi: 10.1177/2048872620974605. [DOI] [PMC free article] [PubMed] [Google Scholar]
- 5.Madjid M., Safavi-Naeini P., Solomon S.D., Vardeny O. Potential effects of coronaviruses on the cardiovascular system: a review. JAMA Cardiol. 2020;5(7):831–840. doi: 10.1001/jamacardio.2020.1286. [DOI] [PubMed] [Google Scholar]
- 6.Magadum A., Kishore R. Cardiovascular manifestations of COVID-19 infection. Cells. 2020;9 doi: 10.3390/cells9112508. [DOI] [PMC free article] [PubMed] [Google Scholar]
- 7.Puntmann V.O., Carerj M.L., Wieters I., Fahim M., Arendt C., Hoffmann J., et al. Outcomes of cardiovascular magnetic resonance imaging in patients recently recovered from coronavirus disease 2019 (COVID-19) JAMA Cardiol. 2020;5(11):1265–1273. doi: 10.1001/jamacardio.2020.3557. [DOI] [PMC free article] [PubMed] [Google Scholar]
- 8.Varga Z., Flammer A.J., Steiger P., Haberecker M., Andermatt R., Zinkernagel A.S., et al. Endothelial cell infection and endotheliitis in COVID-19. Lancet (London, England). 2020;395:1417–1418. doi: 10.1016/S0140-6736(20)30937-5. [DOI] [PMC free article] [PubMed] [Google Scholar]
- 9.Belli S., Balbi B., Prince I., Cattaneo D., Masocco F., Zaccaria S., et al. Low physical functioning and impaired performance of activities of daily life in COVID-19 patients who survived hospitalisation. Eur. Respir. J. 2020;56 doi: 10.1183/13993003.02096-2020. [DOI] [PMC free article] [PubMed] [Google Scholar]
- 10.Halpin S.J., McIvor C., Whyatt G., Adams A., Harvey O., McLean L., et al. Postdischarge symptoms and rehabilitation needs in survivors of COVID-19 infection: a cross-sectional evaluation. J. Med. Virol. 2021;93(2):1013–1022. doi: 10.1002/jmv.26368. [DOI] [PubMed] [Google Scholar]
- 11.Polastri M., Nava S., Clini E., Vitacca M., Gosselink R. COVID-19 and pulmonary rehabilitation: preparing for phase three. Eur. Respir. J. 2020;55 doi: 10.1183/13993003.01822-2020. [DOI] [PMC free article] [PubMed] [Google Scholar]
- 12.Epicentro-ISS https://www.epicentro.iss.it
- 13.Verbeek J.H., Rajamaki B., Ijaz S., Sauni R., Toomey E., Blackwood B., et al. Personal protective equipment for preventing highly infectious diseases due to exposure to contaminated body fluids in healthcare staff. Cochrane Database Syst. Rev. 2020;5 doi: 10.1002/14651858.CD011621.pub5. [DOI] [PMC free article] [PubMed] [Google Scholar]
- 14.Radtke T., Crook S., Kaltsakas G., Louvaris Z., Berton D., Urquhart D.S., et al. ERS statement on standardisation of cardiopulmonary exercise testing in chronic lung diseases. Eur. Respir. Rev. 2019;28 doi: 10.1183/16000617.0101-2018. [DOI] [PMC free article] [PubMed] [Google Scholar]
- 15.Faghy M.A., Sylvester K.P., Cooper B.G., Hull J.H. Cardiopulmonary exercise testing in the COVID-19 endemic phase. Br. J. Anaesth. 2020;125:447–449. doi: 10.1016/j.bja.2020.06.006. [DOI] [PMC free article] [PubMed] [Google Scholar]
- 16.Sietsema K.E., Darryl Y.S., Stringer W.W., Ward S. 6th edition. 2020. Wasserman & Whipp’s Principles of Exercise Testing and Interpretation. ed: LWW. [Google Scholar]
- 17.Ong K.C., Ng A.W., Lee L.S., Kaw G., Kwek S.K., Leow M.K., et al. Pulmonary function and exercise capacity in survivors of severe acute respiratory syndrome. Eur. Respir. J. 2004;24:436–442. doi: 10.1183/09031936.04.00007104. [DOI] [PubMed] [Google Scholar]
- 18.Kress J.P., Hall J.B. ICU-acquired weakness and recovery from critical illness. N. Engl. J. Med. 2014;371:287–288. doi: 10.1056/NEJMc1406274. [DOI] [PubMed] [Google Scholar]
- 19.Minetto M.A., Lanfranco F., Motta G., Allasia S., Arvat E., D’Antona G. Steroid myopathy: some unresolved issues. J. Endocrinol. Investig. 2011;34:370–375. doi: 10.1007/BF03347462. [DOI] [PubMed] [Google Scholar]
- 20.Supinski G.S., Schroder E.A., Callahan L.A. Mitochondria and Critical Illness. Chest. 2020;157:310–322. doi: 10.1016/j.chest.2019.08.2182. [DOI] [PMC free article] [PubMed] [Google Scholar]
- 21.Kloc M., Ghobrial R.M., Kubiak J.Z. The role of genetic sex and mitochondria in response to COVID-19 infection. Int. Arch. Allergy Immunol. 2020;181:629–634. doi: 10.1159/000508560. [DOI] [PMC free article] [PubMed] [Google Scholar]
- 22.Prasun P. COVID-19, mitochondria, and interferon. J. Interf. Cytokine Res. 2020;40(9):466–467. doi: 10.1089/jir.2020.0112. [DOI] [PubMed] [Google Scholar]
- 23.Saleh J., Peyssonnaux C., Singh K.K., Edeas M. Mitochondria and microbiota dysfunction in COVID-19 pathogenesis. Mitochondrion. 2020;54:1–7. doi: 10.1016/j.mito.2020.06.008. [DOI] [PMC free article] [PubMed] [Google Scholar]
- 24.Tenforde M.W., Kim S.S., Lindsell C.J., Billig Rose E., Shapiro N.I., Files D.C., et al. Symptom duration and risk factors for delayed return to usual health among outpatients with COVID-19 in a multistate health care systems network - United States, march-June 2020. MMWR Morb. Mortal. Wkly Rep. 2020;69:993–998. doi: 10.15585/mmwr.mm6930e1. [DOI] [PMC free article] [PubMed] [Google Scholar]
- 25.Carfì A., Bernabei R., Landi F. Group ftGAC-P-ACS. Persistent symptoms in patients after acute COVID-19. JAMA. 2020;324:603–605. doi: 10.1001/jama.2020.12603. [DOI] [PMC free article] [PubMed] [Google Scholar]
Associated Data
This section collects any data citations, data availability statements, or supplementary materials included in this article.
Supplementary Materials
Supplementary methods and supplementary references