Figure 3.
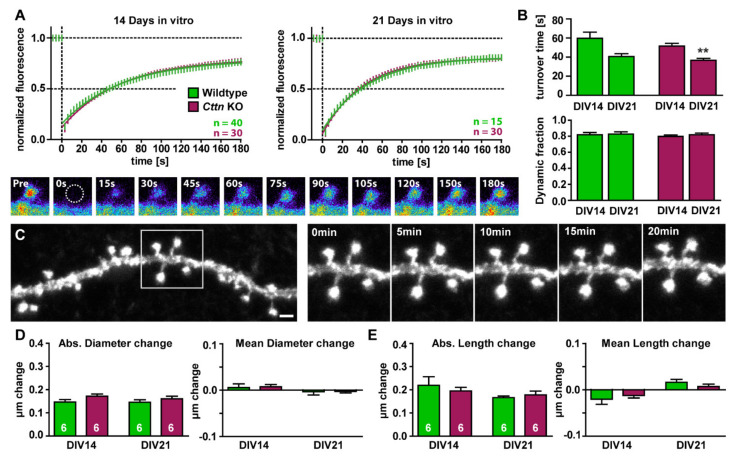
Basal actin dynamics and dendritic spine motility are normal in Cttn-deficient hippocampal neurons. (A) Basal actin dynamics as analyzed via fluorescence recovery after photobleaching (FRAP) of EGFP-ß-actin in primary dissociated hippocampal neurons after 14 as well as 21 days in culture. Depicted are the recovery curves of hippocampal WT and Cttn-KO spines under baseline conditions. Representative images show fluorescence levels derived from EGFP-ß-actin of an individual dendritic spine before bleaching as well as during recovery of fluorescence over a time course of 180 s after the bleaching pulse. n = number of dendritic spines analyzed. (B) Quantification of the turnover time and the fraction of dynamic actin (the amount of actin fluorescence which recovered in the time period of 180 s after the photobleach). (C) Analysis of dendritic spine motility. Representative images depict an individual dendritic stretch that was repeatedly imaged every 5 min for a total of 20 min. Scale bar = 1 µm. (D,E) Absolute as well as mean changes in (D) the head diameter and the (E) length of individual dendritic spines in 14- or 21-day-old primary dissociated hippocampal cultures from WT and Cttn-KO mice. n = number of dendrites analyzed. Data information: Statistic tests used: For normal distribution of data: Kolmogorov-Smirnov Test, Parametric Tests: Two-Way ANOVA and Sidak’s Multiple Comparisons, Non-Parametric Tests: Kruskal-Wallis Test and Dunn’s test; data depicted as means ± SEM, detailed information on p values as well as statistical tests is depicted in Table S1; significances are indicated by ** p value < 0.01.

