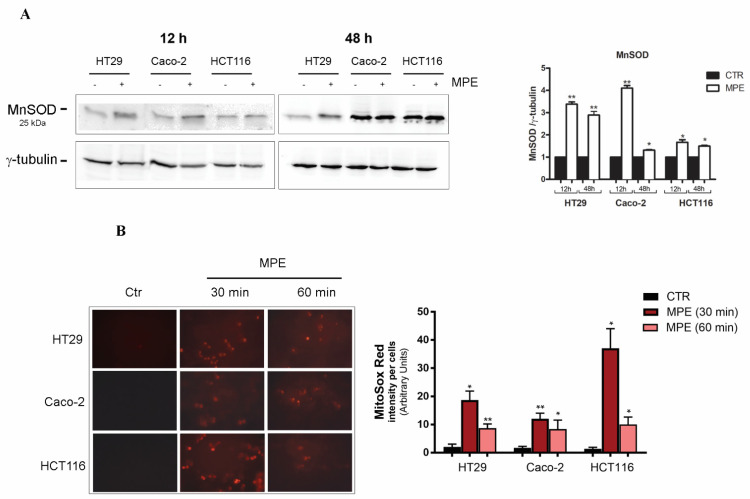
Figure 2.
MPE treatment promotes the upregulation of MnSOD and mitochondrial superoxide anion generation. (A) Western blot analysis of MnSOD in colon cancer cells treated with 360 μg/mL MPE for 12 h and 48 h. Analyses were performed as reported in the Materials and Methods section. The correct protein loading was ascertained by immunoblotting for γ-tubulin. A representative blot of three independent experiments and densitometry analysis histograms are reported. (*) p < 0.05 and (**) p < 0.01 versus untreated control. (B) Micrographs of fluorescence microscopy showing mitochondrial superoxide anion generation in colon cancer cells incubated in the absence or presence of 360 μg/mL MPE for the indicated times. A bar chart representing the densitometric fold difference in MitoSOX-Red-positive cells is reported in the right panel. Pictures were taken using a Leica fluorescent microscope using a rhodamine filter. (*) p < 0.05 and (**) p < 0.01 versus untreated control.

