

Abstract
Background:
The purpose of this study was to evaluate of the study the role of LBW on EH in children and by studying the existing published literature.
Materials and Methods:
A comprehensive literature search for original studies was conducted in Clarivate Analytics Web of Science, PubMed, Scopus, and Embase until July 2019. The search used all of the main keywords and its synonyms include essential hypertension, primary hypertension, essential arterial hypertension, idiopathic hypertension, spontaneous hypertension; child, childhood, children, pediatric, pediatrics, infant, infancy, newborn, neonatal, adolescence, teenagers; and BW, newborn weight, neonatal weight, BW.
Results:
Twelve articles were eligible for the final evaluation. Due to the difference among studies in the report, studies were divided into two-part. The first part, articles were reported in the LBW and NBW groups (interested outcome were SBP and DBP), and the second part was composed as the EH and NR groups (interested outcome were LBW and NBW). In the first part, SMD for SBP was -1.09 with 95% CI (-1.91,-0.26), and was statistically significant (Z=2.58, P=0.010). As well, SMD for DBP was -0.68 with 95% CI (-1.32,-0.05) statistically significant (Z=2.10, P=0.036). In the second part, SMD for SBP was 0.77 with 95% CI (-0.85, 2.39), and was statistically significant (Z=0.93, P=0.352). Subgroup analysis was performed on the pre-term and full- term babies. SMD for SBP was -0.08 with 95% CI (-0.51, 0.35) in the pre-term, and the full-term was -2.07 with 95% CI (-3.47, -0.67). As well, SMD for DBP was -0.02 with 95% CI (-0.20, 0.17) in the preterm, and the term was -1.35 with 95% CI (-1.57, -1.13).
Conclusion:
Although findings of the correlation between BW and EHTN have conflicted. To our knowledge, this is the first report that attempts to a conclusion.
Keywords: Full-term, low birth weight, primary hypertension, term
INTRODUCTION
Essential (primary) hypertension (EH) is the most common form of hypertension in adults with a prevalence of 20% to 30% worldwide. The prevalence of EH seems to be in a range of 4.7%–19.4% in children and adolescents. Based on the 2017 American Academy of Pediatric guidelines on hypertension, the etiopathogenesis of EH is multifactorial in origin. Because EH remains a major modifiable contributor for premature death and disabling conditions in adults, it is diagnosed and treatment at earlier stages remains vital. There are other factors in childhood that can predict EH in adulthood.[1,2] Among these factors is low birth weight (LBW). The prevalence of LBW has been estimated between 15% and 20% of all births worldwide; in other words, it is more than 20 million births a year. Some epidemiologic studies have reported an increased risk of childhood-onset EH in LBW infants,[3,4] possibly due to alterations in their renal or vascular[5,6,7] systems related to reduced growth in utero, while others reported that high birth weight (BW), which may have long-term adverse metabolic effects, including insulin resistance[8,9,10,11] is also a risk factor for the development of EH in childhood.[5,9,10] The aim of this meta-analysis was to study the role of LBW on EH in children by analyzing the existing published literature.
MATERIALS AND METHODS
Search strategy and study selection
A comprehensive literature search for original studies was conducted in Clarivate Analytics-Web of Science, PubMed, Scopus, and Embase until July 2019. The search used all of the main keywords and its synonyms include essential hypertension, primary hypertension, essential arterial hypertension, idiopathic hypertension, spontaneous hypertension; child, childhood, children, pediatric, pediatrics, infant, infancy, newborn, neonatal, Adolescence, teenagers; and BW, newborn weight, neonatal weight, BW. Figure 1 presents the search results.
Figure 1.
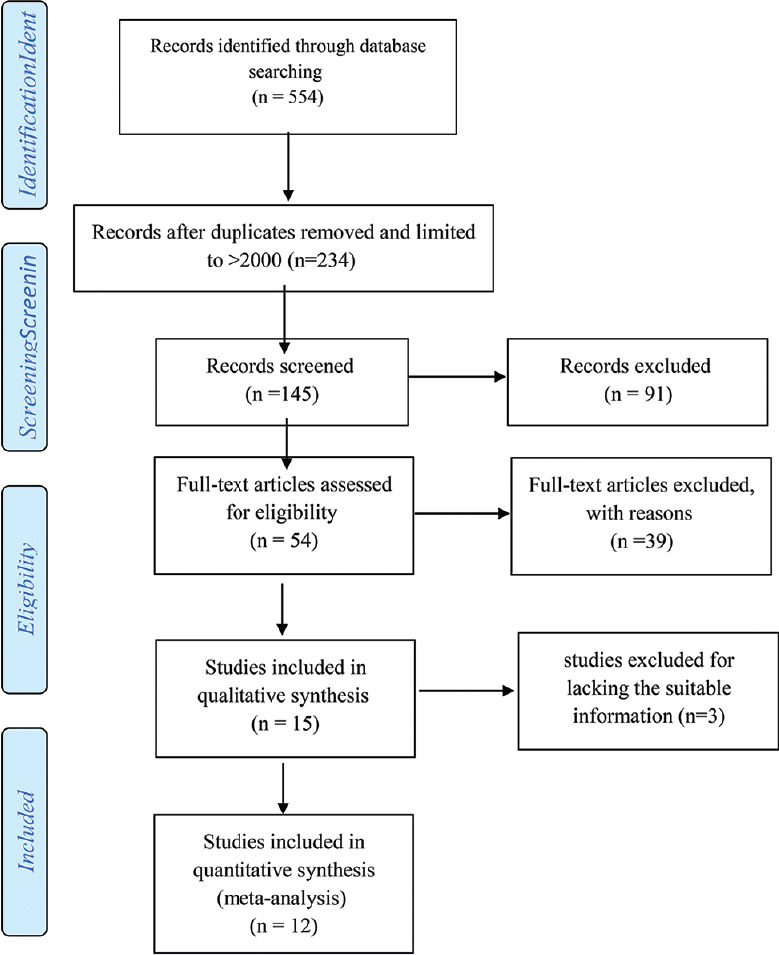
Flowchart of the study selection process
The inclusion criteria were original research articles, containing participants with a mean age ≤18 years, studies that definitely determine that the subjects had EH, studies that reported data for meta-analysis, studies whose full text are available in English, and studies whose data set has been used in one study, and studies using the same data set from an earlier publication (salami slicing) were excluded.
Data extraction and quality assessment
Independent reviewers (MRS and DRN) screened abstracts and titles for eligibility. When the reviewers felt that the abstract or title was potentially useful, full copies of the article were retrieved and considered for eligibility by both reviewers. If discrepancies occurred between reviewers, the reasons were identified and a final decision was made based on a third reviewer (MM) agreement. We evaluated the quality of the included observational studies with the Newcastle–Ottawa quality-assessment scale (NOS).[12] Studies that scored ≥7 were defined as of high quality.
Statistical analysis
Standardized mean differences (SMDs) and related 95% confidence intervals (CIs) of different outcomes were retrieved in observational studies. Some studies that expressed outcomes as median and Interquartile range, the median and Interquartile range were transformed to the mean and standard deviation. We evaluated the degree of heterogeneity between studies using inconsistency index (I2). Values of I2 = 25%, 50%, and 75% were considered to indicate low, moderate, and high heterogeneity, respectively.
If I2 < 50%, a fixed-effects model (DerSimonian–Laird method) was applied; otherwise, a random-effects model was used. With the purpose of exploring the sources of heterogeneity, all the enrolled studies were sequentially excluded to demonstrate the overall impact of individual study and performed with sub-group analysis of preterm or term status where I2 > 50%. Statistical meta-analysis was performed in Stata software version 14 (StataCorp. 2015, Stata Statistical Software: Release 14, College Station, TX) to generate forest plots of pooled SMDs with 95% CIs (Stata Corp LP, College Station, TX, USA). A two-sided P < 0.05 was considered statistically significant. The potential publication bias was assessed using both Begg's and Egger's test (P < 0.05 as statistically significant). To evaluate the influence of an individual study on the pooled estimate, we performed sensitivity analysis by excluding one study at a time. We also limited the analysis to high-quality studies (NOS score ≥7) to examine the robustness of our results.
RESULTS
Study characteristics
From 145 retrieved and limited study according to mentioned year (January 2000-July 2019) and article type (original articles), 54 records were found eligible regarding their title and abstract. In the next step, with studies including full-text article, 39 records were extracted. Finally, 12 articles were eligible for the final evaluation. The details of these studies are summarized in Table 1. Due to the difference among studies in the report, studies were divided into two parts. The first part, articles were reported in the low birth weight (LBW) and normal birth weight (NBW) groups (interested outcome were systolic blood pressure [SBP] and diastolic blood pressure [DBP]), and the second part was composed as the EH and NR groups (interested outcome were LBW and NBW). The studies were generally of high quality (NOS score ≥7).
Table 1.
Details of the studies included in this systematic review and meta-analysis
| First author | Year of publication | Outcome | Group | N1 | N2 | MD | SE (MD) |
|---|---|---|---|---|---|---|---|
| Raghuraman et al.[5] | 2019 | SBP and DBP | LBW/NBW | 16 | 14 | −0.73 | 0.38 |
| D’Souza et al.[26] | 2011 | SBP and DBP | LBW/NBW | 44 | 71 | 0 | 0.19 |
| Goloba et al.[24] | 2019 | SBP and DBP | LBW/NBW | 77 | 284 | 0.38 | 0.13 |
| Franco et al.[17] | 2006 | SBP and DBP | LBW/NBW | 42 | 36 | −4.93 | 0.46 |
| Lurbe et al.[25] | 2001 | SBP and DBP | LBW/NBW | 35 | 150 | −1.98 | 0.21 |
| Boguszewski et al.[23] | 2004 | SBP and DBP | LBW/NBW | 12 | 9 | −0.71 | 0.46 |
| Bayrakci et al.[27] | 2007 | SBP and DBP | LBW/NBW | 41 | 27 | −0.31 | 0.25 |
| Rahayu et al.[28] | 2015 | SBP and DBP | LBW/NBW | 85 | 85 | −0.80 | 0.16 |
| Mario et al. | 2004 | BW | NR/EH | 92 | 103 | −0.45 | 0.15 |
| Daniel et al.[40] | 2004 | BW | NR/EH | 45 | 75 | 4.00 | 0.32 |
| Cruickshaw et al. | 1935 | BW | NR/EH | 48 | 58 | −0.56 | 0.20 |
| Ankwlb et al.[41] | 2015 | BW | NR/EH | 36 | 23 | 0.16 | 0.27 |
SBP=Systolic blood pressure; DRP=Diastolic blood pressure; BW=Birth weight; LBW=Low birth weight; NBW=Normal birth weight; NR=Normal; EH=Essential hypertension; N1=Sample size in LBW or NR; N2=Sample size in NBW or EH; MD=Mean difference; SE=Standard error
Change in systolic blood pressure and diastolic blood pressure
Eight studies (first part) with 1028 participants met the inclusion criteria to enter the first part of the meta-analysis. The minimum sample size was represented by the study of Boguszewski et al.[23] and the maximum sample size was represented by the study of Goloba et al.[24] All studies were published between 2001 and 2019.[17,23,24,25,26,27,28]
Figures 2 and 3 depict the forest plot for the SBP and DBP respectively, where the middle point in each line demonstrates the mean difference, and the length of each line indicates the 95% CI of each study. The diamonds represent the 95% CI for the pooled mean difference of the eight studies.
Figure 2.

Forest plot of mean difference of systolic blood pressure (normal birth weight − low birth weight)
Figure 3.

Forest plot of mean difference of diastolic blood pressure (normal birth weight − low birth weight)
There was evidence of a high heterogeneity among the selected eight studies for SBP (I2 = 96.5%, P = 0.001). In addition, high heterogeneity was observed in DBP (I2 = 94.3%, P = 0.001). The pooled estimate of mean difference for SBP based on a random-effects model was −1.09 (95% CI: −1.91, −0.26), and was statistically significant (Z = 2.58, P = 0.010). As well, the pooled estimate of mean difference for DBP based on a random-effects model was −0.68 (95% CI: −1.32, −0.05), which was statistically significant (Z = 2.10, P = 0.036). Therefore, the BW was as an influencing factor for EH.
Change in birth weight
In the second part (four studies), 480 participants met the inclusion criteria to enter this meta-analysis. Figure 4 depicts the forest plot for the mean difference in BW. There was evidence of a high heterogeneity among studies (I2 = 98.3%, P = 0.001). In addition, a high heterogeneity was observed in DBP (I2 = 94.3%, P = 0.0001). The pooled estimate of mean difference for SBP based on a random-effects model was 0.77 (95% CI: −0.85, 2.39), and was not statistically significant (Z = 0.93, P = 0.352).
Figure 4.

Forest plot of mean difference of birth weight (normal − essential hypertension)
Subgroup analysis
As the eligible studies have different features, which may contribute to a certain degree of heterogeneity, subgroup analysis was executed, and the results are depicted in Figures 5 and 6. This subgroup analysis was performed on the pre- and full-term babies. The pooled estimate of mean difference for SBP based on a random-effects model was −0.08 (95% CI: −0.51, 0.35) in preterm babies and that in the full-term babies was −2.07 (95% CI: −3.47, −0.67). As well, the pooled estimate of mean difference for DBP based on a random-effects model was −0.02 (95% CI: −0.20, 0.17) in preterm babies and that in the full-term babies was −1.35 (95% CI: −1.57, −1.13). Therefore, the results showed that there is a difference between full- and pre-term groups.
Figure 5.

Forest plot for the subgroup analysis according to systolic blood pressure
Figure 6.

Forest plot for the subgroup analysis according to diastolic blood pressure
Publication bias
No evidence of publication bias was found for the SBP (Begg's test: P = 0.138, Egger's test: P = 0.108), and there was no publication bias for the DBP (Begg's test: P = 1.00, Egger's test: P = 0.511). However, publication bias was observed for BW (Begg's test: P = 0.042, Egger's test: P = 0.214).
DISCUSSION
Birth weight is a major contributor to the development of hypertension, whereby there exists a consistently positive relationship between body weight and blood pressure (BP). Childhood hypertension has been considered a strong predictive factor for hypertension in adulthood. The leading causes of abnormal BP in children can be poor weight management and childhood metabolic syndrome.[29]
Barker et al. have demonstrated that fetal LBW can lead to raised BP in later life.[30,31] EH is a multifactorial disorder that is thought to result from both genetic and environmental components, and is a major risk factor for the development of cardiovascular disease. Several studies have demonstrated that LBW is related to increased BP throughout various stages of life.[6,7,8,9] In addition, some systematic reviews and meta-analysis have reported that there exists an inverse relationship between BW and BP.[10,11]
Our results show decreased change in mean differences (NBW − LBW) of SBP and DBP. In addition, an increased change was found in the mean differences (NR − EH) of BW. The subgroup analysis was executed on preterm and term babies according to DBP and SBP. The result of this analysis represented a decreased change in the mean differences (NBW minus LBW) of SBP and DBP on preterm and no evidence differences on term babies.
BW and gestational age (GA) are considered risk factors of cardiovascular disease especially EH,[10,25] as well as diabetes and obesity. However, several studies on BW and GA showed contradictory findings.[8,9,10,11,17,25,28,29,30,31] Some showed a positive association of LGA at birth with EH and ultimately metabolic syndrome in future,[12,32,.33,34] while others did not show this association.[10,25] Some of these studies believe that microvasculature anomaly and impaired tissue perfusion are the key factors in the pathogenesis of EH.[35] Capillary rarefaction is a hallmark of EH, and evidence suggests that rarefaction precedes the onset of rise in BP.[36] Today, there are definite findings which report that LBW is accompanied by anatomical and functional anomalies in microvasculature and also EH. D'Souza et al. showed that not only there isn't capillary rarefaction in LBW infant at birth but also in those capillary density is higher than NBW infant.[26] In addition, they showed this capillary rarefaction that seen in the patient with EH that is programmed in intra uterine period dose not start at that time necessarily. In fact, there is a process as early-accelerated capillary remodeling that cause fast change in high capillary density at birth to capillary rarefaction in the next month and to intensify by oxygen therapy in the early of neonatal period.[5,24,26] Several studies believe that the vascular endothelial dysfunction is a key role in the causation of EH in LBW.[13] Furthermore, some studies believe that the serum concentration of uric acid could be an important factor in the pathogenesis of EH.[14,15] Franco et al. showed that increase in the level of uric acid (UA) is associated with EH and also the level of UA is in LBW.[17] This finding is consistent with that of other studies.[16,18,19,20] They showed a continuous linear correlation between serum concentration of UA and SBP (increase of 1 mg/dL in UA causes a rise of 3 mmHg in SBP). Maria et al. also showed that flow-mediated dilation in capillary as a marker of endothelial function is decreased in LBW infants compared to that of NBW infants. Another mechanism that may cause EH in LBW is sympathetic neuronal activity. Margaret et al. showed that ton of sympathetic nerve system in small for gestational age infant is higher than appropriate for gestational age infant. Moreover, they reported that this increase in neuronal activity may be due to central programming and could be important for the later development of EH and cardiovascular disease.[23] Some authors believe that LBW (IUGR) with effect on a number of renal glomeruli may cause development of EH.[21,22,37,38,39] As mentioned above, findings on the correlation of BW and EH are contradicting. To our knowledge, this is the first report that has attempted to evaluate previous findings.
Financial support and sponsorship
Nil.
Conflicts of interest
There are no conflicts of interest.
REFERENCES
- 1.Mohammadi-Dolatabadi A, Vakhshoori M, Eghbali-Babadi M, Heidarpour M, Shafie D, Garakyaraghi M, et al. Comparison of multiple blood pressure frequency methods with optimum blood pressure measurement among Iranian individuals. J Res Med Sci. 2020;25:40. doi: 10.4103/jrms.JRMS_129_19. [DOI] [PMC free article] [PubMed] [Google Scholar]
- 2.Sabri M, Gheissari A, Mansourian M, Mohammadifard N, Sarrafzadegan N. Essential hypertension in children, a growing worldwide problem. J Res Med Sci. 2019;24:109. doi: 10.4103/jrms.JRMS_641_19. [DOI] [PMC free article] [PubMed] [Google Scholar]
- 3.Edvardsson VO, Steinthorsdottir SD, Eliasdottir SB, Indridason OS, Palsson R. Birth weight and childhood blood pressure. Curr Hypertens Rep. 2012;14:596–602. doi: 10.1007/s11906-012-0311-6. [DOI] [PubMed] [Google Scholar]
- 4.Zhou Y, Qian Z, Vaughn MG, Boutwell BB, Yang M, Zeng XW, et al. Epidemiology of elevated blood pressure and associated risk factors in Chinese children: The SNEC study. J Hum Hypertens. 2016;30:231–6. doi: 10.1038/jhh.2015.104. [DOI] [PubMed] [Google Scholar]
- 5.Raghuraman RP, Duffy D, Carroll VA, Manyonda I, Antonios TF. Oxygen therapy in premature low birth weight infants is associated with capillary loss and increases in blood pressure: A pilot study. J Hum Hypertens. 2020;34:1–8. doi: 10.1038/s41371-019-0211-1. [DOI] [PMC free article] [PubMed] [Google Scholar]
- 6.Singh GR, Hoy WE. The association between birthweight and current blood pressure: A cross-sectional study in an Australian Aboriginal community. Med J Aust. 2003;179:532–5. doi: 10.5694/j.1326-5377.2003.tb05679.x. [DOI] [PubMed] [Google Scholar]
- 7.Falkner B. Birth weight as a predictor of future hypertension. Am J Hypertens. 2002;15:43S–5. doi: 10.1016/s0895-7061(01)02297-x. [DOI] [PubMed] [Google Scholar]
- 8.Adair LS. Karger Publishers; 2010. Developing world perspective: The importance of growth for short-term health. In: Importance of Growth for Health and Development; pp. 71–83. [DOI] [PubMed] [Google Scholar]
- 9.Adair LS, Martorell R, Stein AD, Hallal PC, Sachdev HS, Prabhakaran D, et al. Size at birth, weight gain in infancy and childhood, and adult blood pressure in 5 low-and middle-income-country cohorts: When does weight gain matter? Am J Clin Nutr. 2009;89:1383–92. doi: 10.3945/ajcn.2008.27139. [DOI] [PMC free article] [PubMed] [Google Scholar]
- 10.Huxley RR, Shiell AW, Law CM. The role of size at birth and postnatal catch-up growth in determining systolic blood pressure: A systematic review of the literature. J Hypertens. 2000;18:815–31. doi: 10.1097/00004872-200018070-00002. [DOI] [PubMed] [Google Scholar]
- 11.Gamborg M, Byberg L, Rasmussen F, Andersen PK, Baker JL, Bengtsson C, et al. Birth weight and systolic blood pressure in adolescence and adulthood: Meta-regression analysis of sex- and age-specific results from 20 Nordic studies. Am J Epidemiol. 2007;166:634–45. doi: 10.1093/aje/kwm042. [DOI] [PubMed] [Google Scholar]
- 12.Kuciene R, Dulskiene V, Medzioniene J. Associations between high birth weight, being large for gestational age, and high blood pressure among adolescents: A cross-sectional study. Eur J Nutr. 2018;57:373–81. doi: 10.1007/s00394-016-1372-0. [DOI] [PMC free article] [PubMed] [Google Scholar]
- 13.Martin H, Hu J, Gennser G, Norman M. Impaired endothelial function and increased carotid stiffness in 9-year-old children with low birthweight. Circulation. 2000;102:2739–44. doi: 10.1161/01.cir.102.22.2739. [DOI] [PubMed] [Google Scholar]
- 14.Alper AB, Jr, Chen W, Yau L, Srinivasan SR, Berenson GS, Hamm LL. Childhood uric acid predicts adult blood pressure: The Bogalusa Heart Study. Hypertension. 2005;45:34–8. doi: 10.1161/01.HYP.0000150783.79172.bb. [DOI] [PubMed] [Google Scholar]
- 15.Mazzali M, Hughes J, Kim YG, Jefferson JA, Kang DH, Gordon KL, et al. Elevated uric acid increases blood pressure in the rat by a novel crystal-independent mechanism. Hypertension. 2001;38:1101–6. doi: 10.1161/hy1101.092839. [DOI] [PubMed] [Google Scholar]
- 16.Chang FM, Chow SN, Huang HC, Hsieh FJ, Chen HY, Lee TY, et al. The placental transfer and concentration difference in maternal and neonatal serum uric acid at parturition: Comparison of normal pregnancies and gestosis. Biol Res Pregnancy Perinatol. 1987;8:35–9. [PubMed] [Google Scholar]
- 17.Franco MC, Christofalo DM, Sawaya AL, Ajzen SA, Sesso R. Effects of low birth weight in 8- to 13-year-old children: Implications in endothelial function and uric acid levels. Hypertension. 2006;48:45–50. doi: 10.1161/01.HYP.0000223446.49596.3a. [DOI] [PubMed] [Google Scholar]
- 18.Verdecchia P, Schillaci G, Reboldi G, Santeusanio F, Porcellati C, Brunetti P. Relation between serum uric acid and risk of cardiovascular disease in essential hypertension.The PIUMA study. Hypertension. 2000;36:1072–8. doi: 10.1161/01.hyp.36.6.1072. [DOI] [PubMed] [Google Scholar]
- 19.Pulzer F, Haase U, Knüpfer M, Kratzsch J, Richter V, Rassoul F, et al. Serum leptin in formerly small-for-gestational-age children during adolescence: Relationship to gender, puberty, body composition, insulin sensitivity, creatinine, and serum uric acid. Metabolism. 2001;50:1141–6. doi: 10.1053/meta.2001.26746. [DOI] [PubMed] [Google Scholar]
- 20.Franse LV, Pahor M, Di Bari M, Shorr RI, Wan JY, Somes GW, et al. Serum uric acid, diuretic treatment and risk of cardiovascular events in the Systolic Hypertension in the Elderly Program (SHEP) J Hypertens. 2000;18:1149–54. doi: 10.1097/00004872-200018080-00021. [DOI] [PubMed] [Google Scholar]
- 21.Hughson M, Farris AB, 3rd, Douglas-Denton R, Hoy WE, Bertram JF. Glomerular number and size in autopsy kidneys: The relationship to birth weight. Kidney Int. 2003;63:2113–22. doi: 10.1046/j.1523-1755.2003.00018.x. [DOI] [PubMed] [Google Scholar]
- 22.Shirley DG, Walter SJ. Acute and chronic changes in renal function following unilateral nephrectomy. Kidney Int. 1991;40:62–8. doi: 10.1038/ki.1991.180. [DOI] [PubMed] [Google Scholar]
- 23.Boguszewski MC, Johannsson G, Fortes LC, Sverrisdóttir YB. Low birth size and final height predict high sympathetic nerve activity in adulthood. J Hypertens. 2004;22:1157–63. doi: 10.1097/00004872-200406000-00017. [DOI] [PubMed] [Google Scholar]
- 24.Goloba M, Raghuraman R, Botros N, Khan U, Klein M, Brown A, et al. Early life microcirculatory plasticity and blood pressure changes in low birth weight infants born to normotensive mothers: A cohort study. Am J Hypertens. 2019;32:570–8. doi: 10.1093/ajh/hpz034. [DOI] [PMC free article] [PubMed] [Google Scholar]
- 25.Lurbe E, Torro I, Rodríguez C, Alvarez V, Redón J. Birth weight influences blood pressure values and variability in children and adolescents. Hypertension. 2001;38:389–93. doi: 10.1161/01.hyp.38.3.389. [DOI] [PubMed] [Google Scholar]
- 26.D'Souza R, Raghuraman RP, Nathan P, Manyonda IT, Antonios TF. Low birth weight infants do not have capillary rarefaction at birth: Implications for early life influence on microcirculation. Hypertension. 2011;58:847–51. doi: 10.1161/HYPERTENSIONAHA.111.179226. [DOI] [PubMed] [Google Scholar]
- 27.Bayrakci US, Schaefer F, Duzova A, Yigit S, Bakkaloglu A. Abnormal circadian blood pressure regulation in children born preterm. J Pediatr. 2007;151:399–403. doi: 10.1016/j.jpeds.2007.04.003. [DOI] [PubMed] [Google Scholar]
- 28.Rahayu S, Rusdidjas R, Ramayati R, Ramayani OR, Siregar R. Relationship between childhood blood pressure and birth weight. Paediatr Indones. 2015;55:117–20. [Google Scholar]
- 29.Malatesta-Muncher R, Mitsnefes MM. Management of blood pressure in children. Curr Opin Nephrol Hypertens. 2012;21:318–22. doi: 10.1097/MNH.0b013e328351c415. [DOI] [PMC free article] [PubMed] [Google Scholar]
- 30.Barker DJ. Rise and fall of Western diseases. Nature. 1989;338:371–2. doi: 10.1038/338371a0. [DOI] [PubMed] [Google Scholar]
- 31.Barker DJ, Osmond C, Golding J, Kuh D, Wadsworth ME. Growth in utero, blood pressure in childhood and adult life, and mortality from cardiovascular disease. BMJ. 1989;298:564–7. doi: 10.1136/bmj.298.6673.564. [DOI] [PMC free article] [PubMed] [Google Scholar]
- 32.Darendeliler F, Poyrazoglu S, Sancakli O, Bas F, Gokcay G, Aki S, et al. Adiponectin is an indicator of insulin resistance in non-obese prepubertal children born large for gestational age (LGA) and is affected by birth weight. Clin Endocrinol (Oxf) 2009;70:710–6. doi: 10.1111/j.1365-2265.2008.03394.x. [DOI] [PubMed] [Google Scholar]
- 33.Pocobelli G, Dublin S, Enquobahrie DA, Mueller BA. Birth weight and birth weight for gestational age in relation to risk of hospitalization with primary hypertension in children and young adults. Matern Child Health J. 2016;20:1415–23. doi: 10.1007/s10995-016-1939-7. [DOI] [PMC free article] [PubMed] [Google Scholar]
- 34.Boney CM, Verma A, Tucker R, Vohr BR. Metabolic syndrome in childhood: Association with birth weight, maternal obesity, and gestational diabetes mellitus. Pediatrics. 2005;115:e290–6. doi: 10.1542/peds.2004-1808. [DOI] [PubMed] [Google Scholar]
- 35.Levy BI, Schiffrin EL, Mourad JJ, Agostini D, Vicaut E, Safar ME, et al. Impaired tissue perfusion: A pathology common to hypertension, obesity, and diabetes mellitus. Circulation. 2008;118:968–76. doi: 10.1161/CIRCULATIONAHA.107.763730. [DOI] [PubMed] [Google Scholar]
- 36.Shore AC, Tooke JE. Microvascular function in human essential hypertension. J Hypertens. 1994;12:717–28. [PubMed] [Google Scholar]
- 37.Hinchliffe SA, Lynch MR, Sargent PH, Howard CV, Van Velzen D. The effect of intrauterine growth retardation on the development of renal nephrons. Br J Obstet Gynaecol. 1992;99:296–301. doi: 10.1111/j.1471-0528.1992.tb13726.x. [DOI] [PubMed] [Google Scholar]
- 38.Eriksson J, Forsén T, Tuomilehto J, Osmond C, Barker D. Fetal and childhood growth and hypertension in adult life. Hypertension. 2000;36:790–4. doi: 10.1161/01.hyp.36.5.790. [DOI] [PubMed] [Google Scholar]
- 39.Cheung YB, Low L, Osmond C, Barker D, Karlberg J. Fetal growth and early postnatal growth are related to blood pressure in adults. Hypertension. 2000;36:795–800. doi: 10.1161/01.hyp.36.5.795. [DOI] [PubMed] [Google Scholar]
- 40.Feig DI, Nakagawa T, Karumanchi SA, Oliver WJ, Kang D-H, Finch J, et al. Hypothesis: uric acid, nephron number, and the pathogenesis of essential hypertension. Kidney Int. 2004;66:281–7. doi: 10.1111/j.1523-1755.2004.00729.x. [DOI] [PubMed] [Google Scholar]
- 41.Shah AB, Hashmi SS, Sahulee R, Pannu H, Gupta-Malhotra M. Characteristics of systemic hypertension in preterm children. J Clin Hypertens. 2015;17:364–70. doi: 10.1111/jch.12528. [DOI] [PMC free article] [PubMed] [Google Scholar]