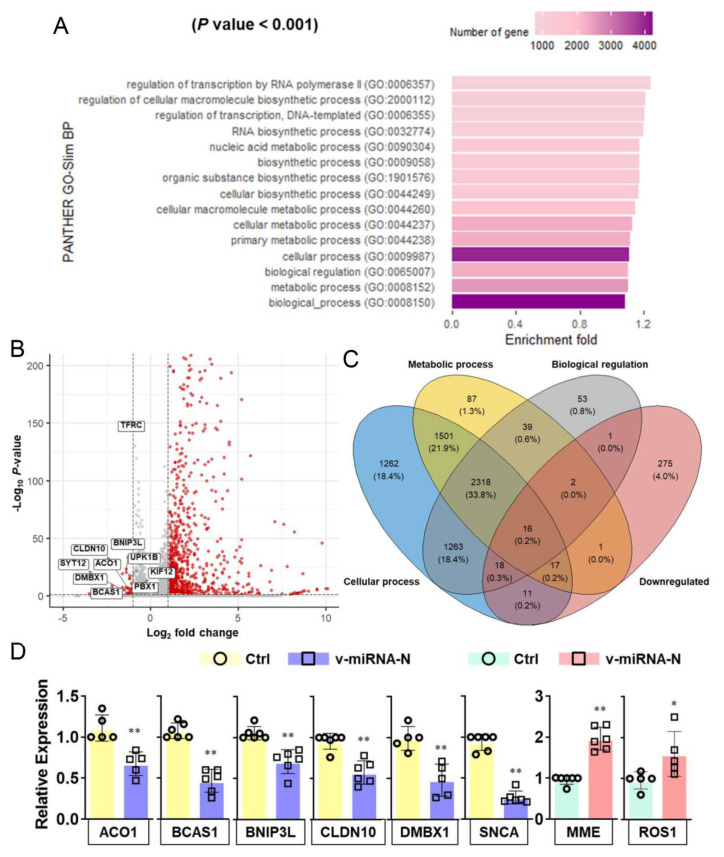
Figure 2.
SARS-CoV-2-encoded v-miRNAs target host genes that are involved in metabolic pathways. (A) GO analysis indicates the main enrichment terms targeted by SARS-CoV-2-encoded v-miRNAs (predicted by using the seed-region method). (B) The volcano plot shows DEGs targeted by v-miRNAs. The red dots show significantly upregulated and downregulated genes (|log2FoldChange| > 1 and FDR < 0.05) while the grey dots show the remaining genes not satisfying these criteria. (C) A Venn diagram shows the numbers of genes overlapping between and among down-regulated genes and genes enriched in different GO pathways. Down-regulated genes are identified by edgeR with log2FoldChange less than −1 and FDR less than 0.05. Genes enriched in metabolic process, cellular process and biological regulation are predicted by the seed-region method. (D) RT-qPCR results demonstrate the relative expression of overlapping host target genes in Calu-3 cells transfected with negative control (Ctrl) or v-miRNA-N synthetic mimics. The five histograms on the left show downregulated genes while the two histograms on the right show upregulated genes. The mean ± SD is shown for RT-qPCR results. n = 5–6; * p < 0.05; ** p < 0.01. ACO1, aconitase 1; BCAS1, brain enriched myelin associated protein 1; BNIP3L, BCL2 interacting protein 3 like; CLDN10, claudin 10; Ctrl, control; DMBX1, diencephalon/mesencephalon homeobox 1; GO, gene ontology; KIF12, kinesin family member 12; MME, membrane metalloendopeptidase; PBX1, pre-B-cell leukemia transcription factor 1; ROS 1, ROS proto-oncogene 1, receptor tyrosine kinase; SNCA, synuclein alpha; SYT12, synaptotagmin12; TFRC, transferrin receptor protein 1; UPK1B, uroplakin 1B; v-miRNAs, viral microRNAs.

