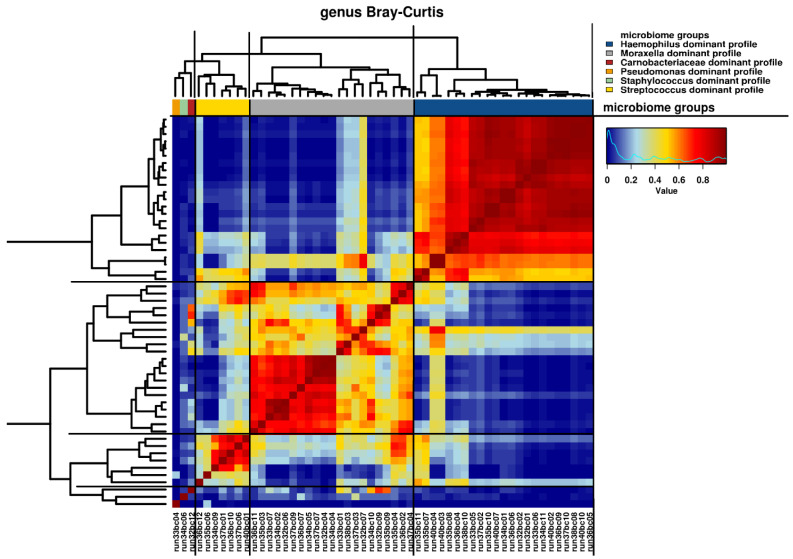
Figure 1.
Hierarchical clustering of microbiome samples. Visual representation of hierarchical clustering of microbiome samples at the genus level with the Bray–Curtis distance metric. A heat map is shown, characterized by similarity values ranging from 0 to 1. Samples are presented as run numbers. A dendrogram of the hierarchical clustering is shown with distances represented by the length of the individual branches. Genus dominant profiles are presented by colored bars, as indicated by the accompanying figure legend.

