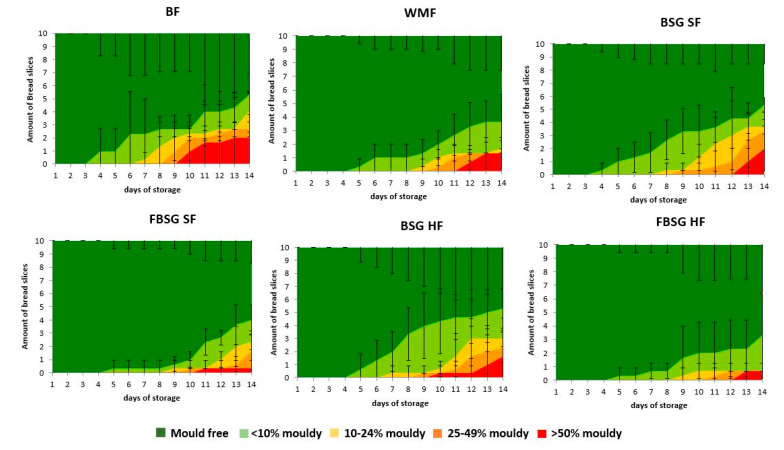
Figure 3.
Shelf-life plots from 14-day analysis of breads. The amount of bread slices which contained each mould group (mould free, <10% mouldy, 10–24% mouldy, 25–49% mouldy and >50% mouldy) was counted over a period of 14 days. BF and WMF represent baker’s flour wheat control and wholemeal bread, respectively. BSG and FBSG denote brewers’ spent grain and fermented brewers’ spent grain breads, respectively. SF and HF stand for “source of fibre” and “high in fibre” addition levels, respectively. The graph represents mean values obtained across three independent batches with standard deviations included as error bars.

