Abstract
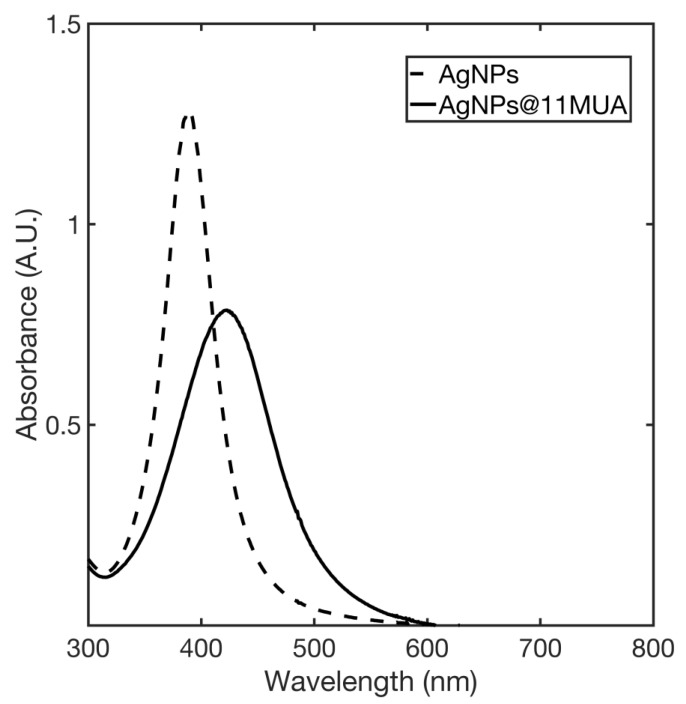
Silver nanoparticles (AgNPs) can be used as a surface plasmon resonance (SPR) colorimetric sensor; the correlation between the SPR phenomenon and the aggregation state of nanoparticle allows the real-time detection of a target molecule. Surface functionalization of NPs with proper molecular baits is often performed to establish the selectivity of the sensor. This work reports on the synthesis of AgNPs under reducing conditions and on the functionalization thereof with mercaptoundecanoic acid (11-MUA). UV-VIS Spectroscopy confirmed the formation of AgNPs, eliciting a surface plasmon absorption band (SPAB) at 393 nm that shifted to 417 nm upon surface coating. Dynamic light scattering was used to investigate the surface coatings; moreover, pelleted AgNPs@11MUA nanoparticles were characterized by scanning electron microscopy (SEM), energy dispersive X-ray analyzers (EDX), and infrared spectroscopy to corroborate the presence of 11MUA on the surface. Most interestingly, the resulting AgNPs@11MUA selectively detected micromolar levels of Ni2+, also in the presence of other cations such as Mn2+, Co2+, Cd2+, Cu2+, Zn2+, Fe2+, Hg2+, Pb2+, and Cr3+.
Keywords: colorimetric sensor, silver nanoparticles, self-assembly functionalization, 11-Mercaptoundecanoic acid, Nickel detection
1. Introduction
The occurrence of heavy metals and their compounds in the environment is the result of both anthropic and natural factors. In fact, heavy metals largely accumulate in the soil and in ground water due to a variety of human activities (e.g., mining, smelting, electroplating, and other industrial processes) and natural weathering of their parent materials [1].
In particular, metals such as Cd, Cr, As, Hg, Pb, Cu, Zn, and Ni are considered toxic, given their persistence in the environment. Consequently, several major international government institutions, in particular the United States Environmental Protection Agency (USEPA), listed them among the priority control pollutants [2,3].
Among these, nickel has attracted special attention not only because of its toxicity, but also because of its widespread use as a catalyst in many industrial processes and its high occurrence in water effluents, where it occurs mostly as divalent cation [4]. Most importantly, nickel was detected (even if at low concentration) in several foods derived either from animal or vegetable sources, with the consequent increase in the risk of toxicity for humans. In fact, exposure to nickel has been demonstrated to be a potential triggering event in pneumonitis, dermatitis, asthma, disorders of central nervous system, and cancer of the nasal cavity or lungs [5].
In general, the quantification of heavy metals involves the application of established techniques, such as wet chemical analyses (e.g., gravimetric, titrimetric, colorimetric, etc.), inductively coupled plasma/atomic emission spectrometry (ICP/AES), inductively coupled plasma/mass spectrometry (ICP/MS), or atomic absorption spectroscopy (AAS) [6].
Despite of offering the adequate sensitivity and specificity, these techniques are often time-consuming, cumbersome, expensive, and require properly trained personnel. In this perspective, several methods have been developed to cope with the increasing demand for the rapid (and possibly user-friendly) detection of metals.
In particular, colorimetric sensors attracted special attention, given their common use in the detection of analytes such as proteins, organic compounds, peptides, nucleic acids, toxic gases, moisture, and water pollutants [7]. Thanks to their ease of use and affordability, colorimetric sensors represent a valuable analytical screening tool since they provide rapid (qualitative) results even in the absence of expensive instrumentation and highly qualified operators. Conversely, these “instrument-free” colorimetric sensors cannot fully meet the criteria of adequate accuracy and sensitivity, which is different from spectroscopic and chromatographic techniques (because the high background noise and the subjectivity of color perception from naked-eye observation). To address these issues, colorimetric sensors are generally coupled with digital imaging techniques [8,9].
In this context, silver and gold nanoparticles are gaining increasing attention [10] for their application in the development of sensors. In fact, because of their peculiar physical-chemical properties, nanoparticles are widely used in colorimetric sensors, exploiting the surface plasmon absorption phenomenon that arises from the collective oscillation of electrons at the interface between the metal and a dielectric [11].
The color of nanoparticles depends on their shape, dimension, composition, and dielectric constant [12], and it changes in the state of aggregation of nanoparticles; the interparticle distance between aggregates causes a shift in the surface plasmon absorption band (SPAB) with respect to monodisperse ones [13,14]. This dependence of SPAB on the state of aggregation is the principle for the detection of chemical substances by colorimetric sensors based on nanoparticles [15].
The functionalization of the nanoparticle surface is a common procedure used to increase/establish the sensor selectivity for a candidate analyte in a matrix containing other chemicals sharing similar properties [16]. Several classes of (bio)molecules can be used as NP functionalizing agents, such as proteins [17], nucleic acids [18], antibody [19], ammino acids [20,21], polymers [22,23], salts [24], and surfactant [25,26], some of these being able to form an electrostatic interaction with NPs [27,28,29,30], and some others forming a covalent bond with the NPs’ surface [31,32].
In particular, alkanethiols are often employed because of their ability to interact with the surface of the metal nanoparticles via their -SH tail [33,34,35]. Among alkanethiols, mercaptoundecanoic acid (11MUA) is an established stabilizer of NPs (silver NPs in particular) in alkaline solution [36,37,38,39,40].
In this work, we report on the synthesis and characterization of silver nanoparticles, on their functionalization with 11MUA, and (for the first time) on the development of a colorimetric sensor based on 11MUA-modified AgNPs for the detection of Ni2+ ions in the presence of other metal ions, such as Mn2+, Co2+, Cd2+, Co2+, Zn2+, Hg2+, Fe2+, Pb2+, and Cr3+.
2. Materials and Methods
2.1. Materials
Silver nitrate (AgNO3), sodium borohydride (NaBH4), mercaptoundecanoic acid (11MUA), NiCl2, CoCl2, ZnCl2, CuCl2, MnCl2, CdCl2, FeCl2, HgCl2, PbCl2, and CrCl3 were purchased from Sigma-Aldrich (St. Louis, MO, USA), and used without further purification. All the glassware was washed with boiling aqua regia before being used. All the solutions were prepared using ultrapure water (18.2 µS/cm).
Plots, fittings, and statistical analysis were performed by using MatLab R2020b (The MathWorks, Inc, Natick, MA, USA).
2.2. Synthesis of AgNPs and AgNPs@11MUA
Silver nanoparticles (AgNPs) were obtained by chemical reduction with NaBH4, according to a modification of the method of Mulfinger et al. [27]. The synthetic procedure was optimized by testing different conditions of temperature, stirring time/rate, and Ag-to-NaBH4 molar ratio. Optimal colloidal self-stability was achieved by adding 1 mL of 0.01 M NaBH4 to 50 mL of 2.15 mM AgNO3 ([AgNO3]/[NaBH4] = 1:5) in ultrapure water and left stirring for 30 min at 0 °C. The shift from colorless-to-yellow in the color of the solution indicated the formation of NPs [27]. AgNPs’ surface was functionalized by adding 104 µL of 11MUA (0.0103 M in pH 9 NaOH solution) to the colloidal solution and stirred for 24 h. Upon functionalization, the AgNPs@11MUA suspension was dialyzed using a Spectra/Por 3 dialysis membrane, 3500 Da cut-off, (Campton, CA, USA) to remove the uncoupled 11MUA. The dialyzed solution was then lyophilized to obtain the nanoparticle pellet to be used for the characterization.
2.3. Characterization of AgNPs and AgNPs@11MUA
UV-VIS measurements were performed by using Cary 8454 Diode Array System spectrophotometer (Agilent Technologies, Santa Clara, CA, USA).
Field emission scanning electron microscopy (FE-SEM, Sigma 300, Zeiss, Gina, Germany) operating at 7 kV, equipped with energy dispersive X-ray spectroscopy (EDX, Quantax, EDS, Bruker, Billerica, MA, USA), was used to evaluate the morphology of AgNPs and AgNPs@11MUA. Samples were prepared in the same manner reported in a previous study [11].
Infrared spectroscopy characterization was performed by using Perkin-Elmer System 2000 FT-IR instrument (Waltham, MA, USA). IR spectra of AgNPs and AgNPs@11MUA pellets were collected from 4000 to 10 cm−1.
Dynamic light scattering was used to investigate the effect of 11MUA coating and the formation of lattice upon Ni2+ addition; measurements were performed on a Malvern Zetasizer nano S device (Malvern Instruments, Worcestershire, UK) equipped with a back-scattered light detector operating at 173°.
2.4. Colorimetric Sensing Applications
Stock solutions of different ions (Ni2+, Cu2+, Zn2+, Cd2+, Co2+, Mn2+, Fe2+, Pb2+, Hg2+, and Cr3+) with a concentration of 0.1 mM were prepared from the corresponding chlorinated salts. For a general method, 1 mL of AgNPs@11MUA with 1 mL of ultrapure water was placed in a cuvette and titrated with stepwise additions of 10 µL of individual metal ion solutions. SPAB spectra were recorded and compared at each step of titration after 1 min of stirring.
3. Results
3.1. Characterization of AgNPs and AgNPs@11MUA
UV-VIS Characterization
The formation of AgNPs was confirmed by the presence of pale-yellow color solution, which became more intense upon functionalization with 11MUA. UV-VIS spectra of synthetized AgNPs and AgNPs@11MUA are reported in Figure 1. Spectra show strong absorption at 393 nm for AgNPs, whereas the SPAB is red shifted to 417 nm in the AgNPs@11MUA sample as the result of the interaction between AgNPs’ surface with 11MUA [41,42,43,44]. Borohydride ions (BH4−) [45] on the surface of AgNPs and 11MUA molecules on the surface of AgNPs@11MUA [35] electrostatically stabilized AgNPs and AgNPs@11MUA, respectively.
Figure 1.
SPAB of AgNPs (dashed line) and AgNPs@11MUA (solid line).
3.2. Dynamic Light Scattering Characterization of AgNPs and AgNPs@11MUA
Dynamic light scattering analyses were performed on AgNPs, AgNPs@11MUA, and AgNPs@11MUA after addition of Ni2+ (see Supplementary Materials Figures S4–S6). DLS results, summarized in Table 1, show an average diameter size (Z-Ave) of 27.55 ± 3.77 nm for AgNPs sample and the average diameter size increasing to 173.13 ± 1.66 nm after functionalization with 11MUA. After addition of Ni2+, the average diameter size rapidly increases up to 6123.33 ± 349.01 nm due to the formation of AgNPs@11MUA lattice.
Table 1.
DLS results of AgNPs, AgNPs@11MUA, and Ni-AgNPs@11MUA, respectively.
| Sample | Replicate | Z-Ave (d.nm) a | PdI b |
|---|---|---|---|
| AgNPs | 1 | 29.04 | 0.619 |
| 2 | 23.26 | 0.78 | |
| 3 | 30.35 | 0.495 | |
| AgNPs@11MUA | 1 | 171.6 | 0.286 |
| 2 | 172.9 | 0.253 | |
| 3 | 174.9 | 0.271 | |
| Ni-AgNPs@11MUA | 1 | 5760 | 1.000 |
| 2 | 6456 | 1.000 | |
| 3 | 6154 | 1.000 |
a average diameter size; b Polydispersity index (PdI).
3.3. Scanning Electron Microscopy Characterization of AgNPs and AgNPs@11MUA
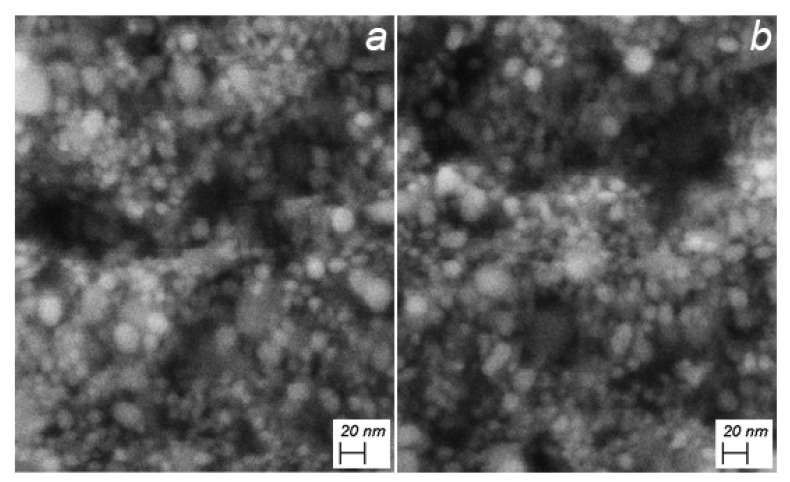
Morphological analysis by SEM demonstrated that the obtained sample showed a spherical distribution of AgNPs having a maximum diameter size around 20 nm (Figure 2a). Upon 11MUA functionalization, the morphology and dimension remains almost the same, displaying a spherical distribution [38] (Figure 2b).
Figure 2.
Morphology of (a) AgNPs and (b) AgNPs@11MUA. Operative condition: 7.00 kV, WD = 3.7 mm and Mag = 400.00 kX.
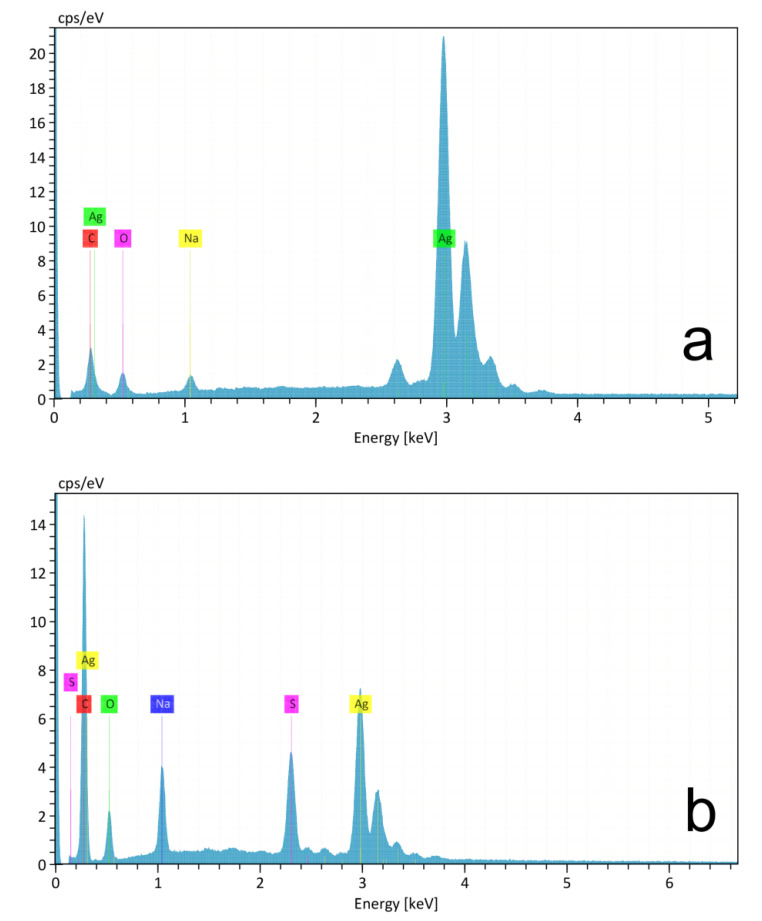
EDX spectra of AgNPs and AgNPs@11MUA are reported in Figure 3a,b, respectively. After dialysis, the EDX spectrum of AgNPs@11MUA revealed the presence of sulfur in the AgNPs@11MUA sample, indicating a good functionalization process.
Figure 3.
(a) EDX analysis of AgNPs and (b) AgNPs@11MUA sample.
3.4. Infrared Spectroscopy Characterization of AgNPs and AgNPs@11MUA
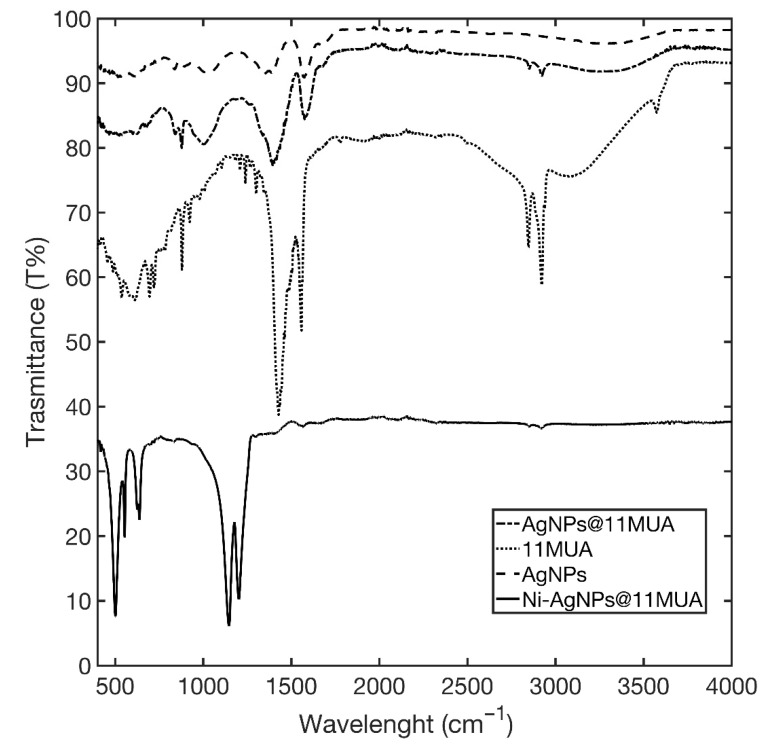
The infrared spectrum (IR) of 11MUA is characterized by two strong bands at 2917.77 cm−1 and 2850.27 cm−1 of C-H stretching that were also present in the spectrum of AgNPs@11MUA (Figure 4). Additionally, a weak and broad band in the region 2600–2550 cm−1 of S-H stretching of thiol group was observed only in the 11MUA spectrum. The band corresponding to the thiol group was not present in AgNPs@11MUA, indicating a good functionalization process. Moreover, the band of C=O stretching was observed at 1710.55 cm−1, the broad band in the region 2900–3300 cm−1 corresponds to the O-H stretching of carboxylic acid, the band at 1458.37 cm−1 is related to the O-H bending, while the band at 1301.72 cm−1 is in accord with C-O stretching [46]. Ni2+ coordination caused a strong shift of the bands corresponding to carboxylic acid from 1458.37 and 1301.72 cm−1 to 1203.10 and 1147.60 cm−1, respectively, and the disappearance of the band at 1710.55 cm−1. Additionally, the new bands in the region at around 580 cm−1 being attributed to the Ni-O stretching vibration mode [47].
Figure 4.
IR spectra of the AgNPs@11MUA (solid line), 11MUA (line dash point), and AgNPs (dashed line).
3.5. Effect of Metal Ions on AgNPs
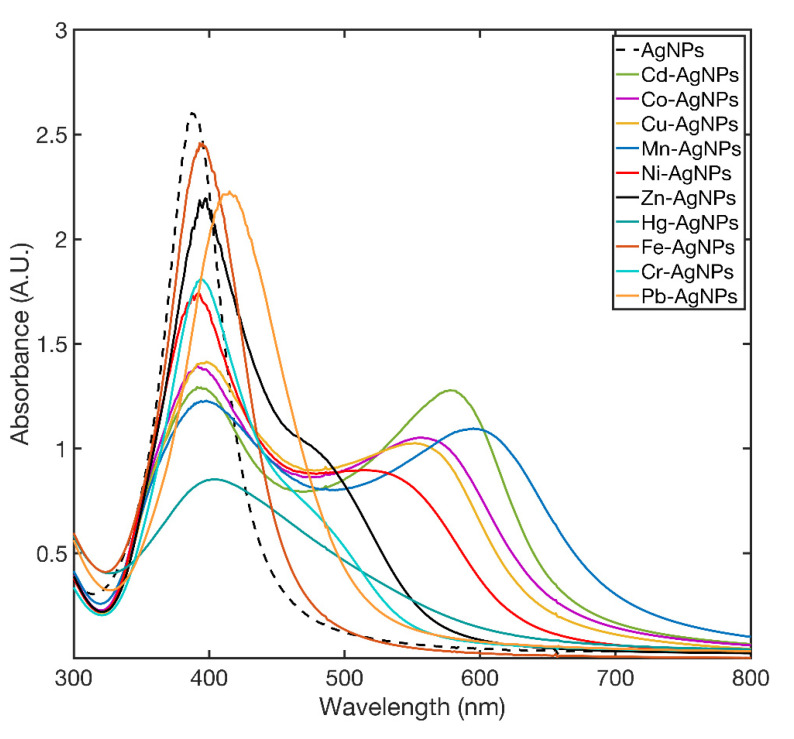
To test the AgNPs behavior in the absence of 11MUA, 10 μL of Co2+, Mn2+, Cd2+, Cu2+, Zn2+, Fe2+, Hg2+, Pb2+, Cr3+, and Ni2+ stock solutions (0.1 mM) was added to the AgNPs dispersion. Figure 5 shows the UV-VIS spectra of the AgNPs collected 5 min after the addition of metal ions. As it can be observed, the typical spectra of aggregated AgNPs were obtained after the addition of each metal ion; all the AgNPs fully aggregated after 15 min.
Figure 5.
SPAB spectra of AgNPs recorded at 5 min after the addition of metal ions.
3.6. Effect of Metal Ions on AgNPs@11MUA
UV-VIS spectroscopy was used to evaluate the optical properties of AgNPs@11MUA and of its complexes thereof with Co2+, Mn2+, Cd2+, Cu2+, Zn2+, Fe2+, Hg2+, Pb2+, Cr3+, and Ni2+ ions.
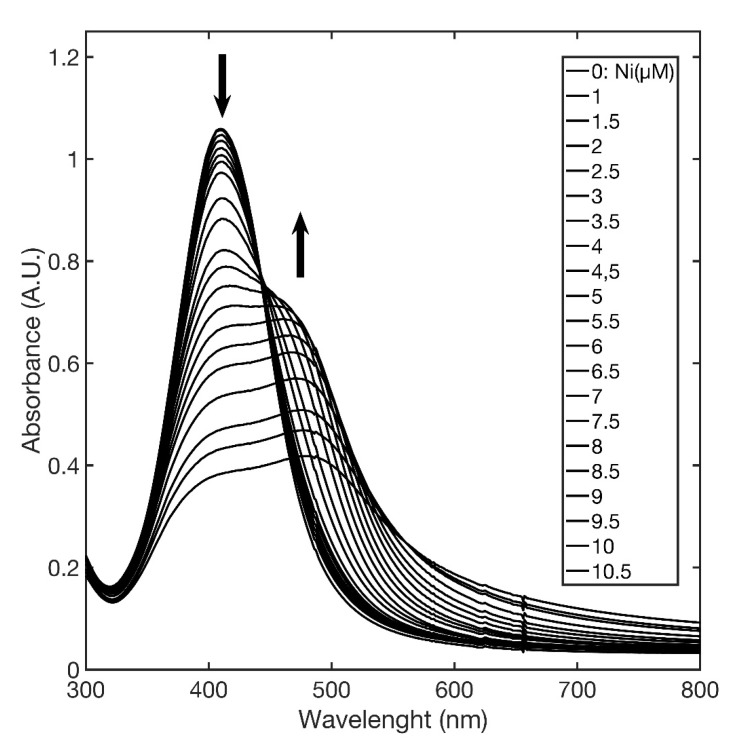
Specifically, AgNPs@11MUA showed a single SPAB at 417 nm, and the addition of Ni2+ caused a color change from yellow to purple, with the appearance of a second SPAB at 477 nm. In fact, Figure 6 shows that upon titration of AgNPs@11MUA with Ni2+ (in the range 0–10 µM), the SPABs at 417 and 477 nm decreased and increased in intensity with Ni2+, respectively.
Figure 6.
Changes in SPABs upon addition of increasing concentration of Ni2+ to AgNPs@11MUA.
Figure 7 shows the change in the color of the AgNPs@11MUA suspension upon titration with Ni2+.
Figure 7.
Color changes of AgNPs@11MUA upon addition of increasing concentration of Ni2+.
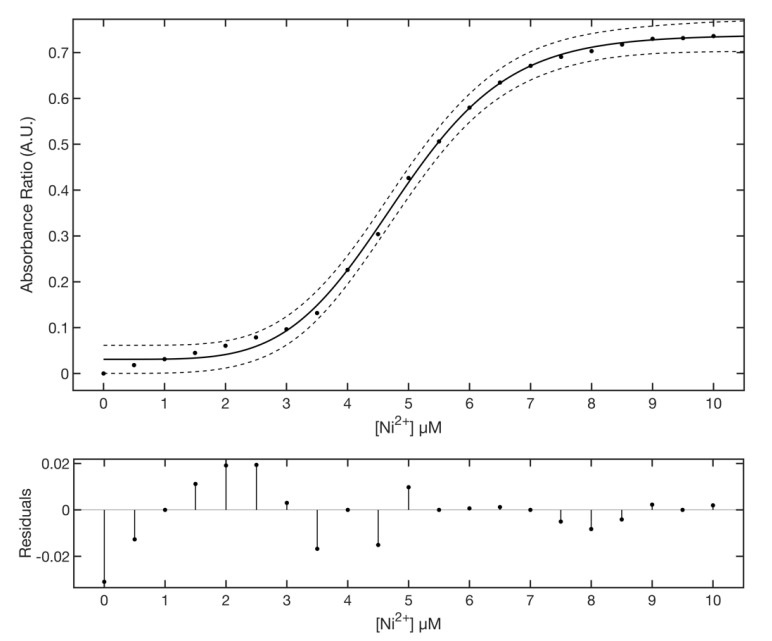
Titration curves clearly show the occurrence of an isosbestic point at about 445 nm that splits the SPAB in two zones and supports a mechanism of direct interconversion between AgNPs@11MUA and (AgNPs@11MUA)n-(Ni2+)m cluster [48]; the individual contribution in absorbance of the two SPABs was evaluated by deconvoluting the spectra with a lognormal equation [49,50,51] (Figure S1, Supplementary Materials). Titration curves were obtained by plotting the absorbance ratio at 417 and 477, respectively, as a function of Ni2+ concentration (Figure 8).
Figure 8.
Upper panel: dependence of absorbance ratio from Ni2+ concentration. Fit of raw data for Ni-AgNPs@11MUA to Equation (1) (solid line). The 95% confidence interval is shown (dashed line). Lower panel: residuals plot of the fitting.
Titration data were fitted to a five parameter logistic function [52],
| (1) |
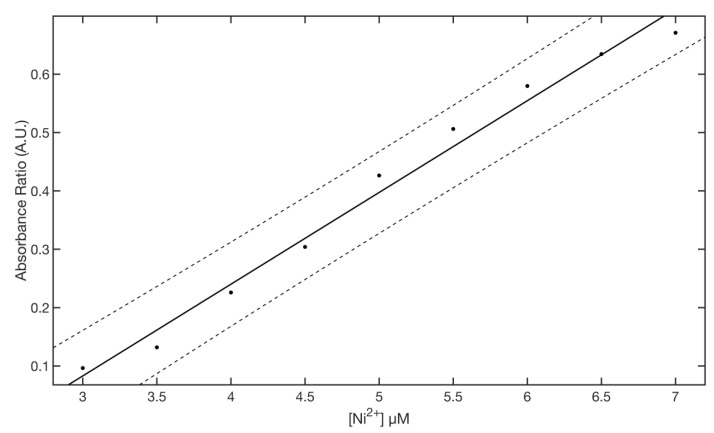
where a and d parameters control the position of the lower and upper asymptotes, b and g are related to the rapidity of the curve transition between the two asymptotes, and c indicates the position of the transition. Fitting results gave an R square of 0.9981 with an SSE of 0.0027. The best fitted values for the parameter to 95% confidence bounds were: a = 0.5365 ± 0.0125, b = 4.544 ± 0.984, c = 6.742 ± 0.422, d = 0.7387 ± 0.0255, g = 2.011 ± 0.503. Figure 8 lower panel shows the residuals plot of the fitting. The linear region of the titration curve (3–7 µM) was fitted with a linear equation , where m is the slope and q the intercept (Figure 9).
Figure 9.
Linear region of the sensor ([Ni2+] = 3–7 µM).
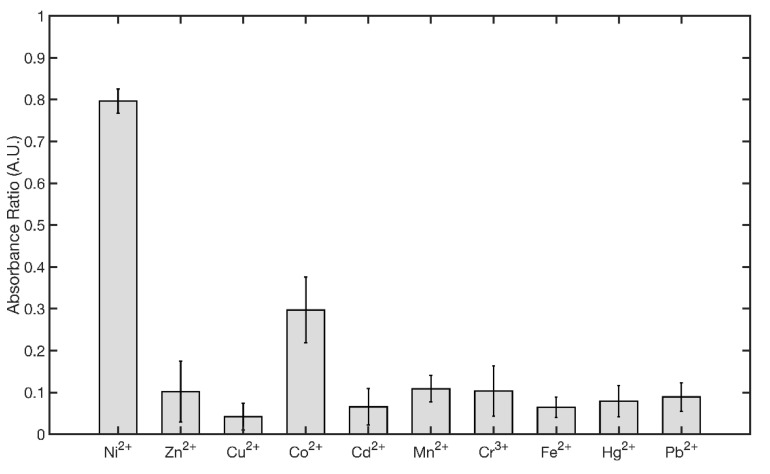
The best fitted values for the parameter to 95% confidence bounds were m = 0.1572 ± 0.0171 and q = −0.3885 ± 0.0095. Fitting results gives an R square of 0.9853 with an SSE of 0.0055. The limits of detection (LOD) and limits of quantitation (LOQ) were calculated from the calibration curve as 3 σ/m and 10 σ/m [53], where σ is the standard deviation of intercept, and m is the slope of the regression curve fitting the data points in the linear range (3–7 µM). The obtained value of LOD and LOQ were 2.15 µM and 7.16 µM, respectively. Although presenting a similar general behavior, all other metal ions of interest were associated with minor-to-negligible changes in UV-VIS spectra (Figure S2, Supplemental Materials). For comparative purposes, the responses at 7.5 µM of each metal ion are shown in the bar plot reported Figure 10 and in UV-VIS spectra in Figure S3.
Figure 10.
Comparison of the absorbance ratios of AgNPs@11MUA after addition of 7.5 µM of different metal ions.
To establish the selectivity of the AgNPs@11MUA sensor, the cross-reactivity values for each metal ion were calculated as:
| (2) |
The values are summarized in Table 2.
Table 2.
Cross reactivity values for each metal ions calculated by Equation (2).
| Metal Ions | CR% |
|---|---|
| Ni2+ | 100 |
| Zn2+ | 13 |
| Cu2+ | 6 |
| Co2+ | 37 |
| Cd2+ | 8 |
| Mn2+ | 14 |
| Cr3+ | 13 |
| Fe2+ | 8 |
| Hg2+ | 10 |
| Pb2+ | 11 |
A possible rationale behind the observed behavior is that only the association of NPs into larger clusters with bridging Ni2+ ions (that results in the formation of a “superlattice” [54]) can cause the shift in SPAB. On such a premise, the first part of the curve in Figure 8 represents the slow formation of a small lattice of AgNPs@11MUA in the presence of low concentration of Ni2+ (the lag phase, low-sensitivity region). Next, as the Ni2+ concentration increases, it triggers the aggregation of a higher number of additional nanoparticles. This phenomenon results in a bigger lattice (the “superlattice”) that is associated with greater change in the absorbance spectrum and higher sensitivity of the sensor.
Next, upon further increase in Ni2+ concentration, the NPs-Ni2+ cluster reaches a critical mass and the superlattice collapses.
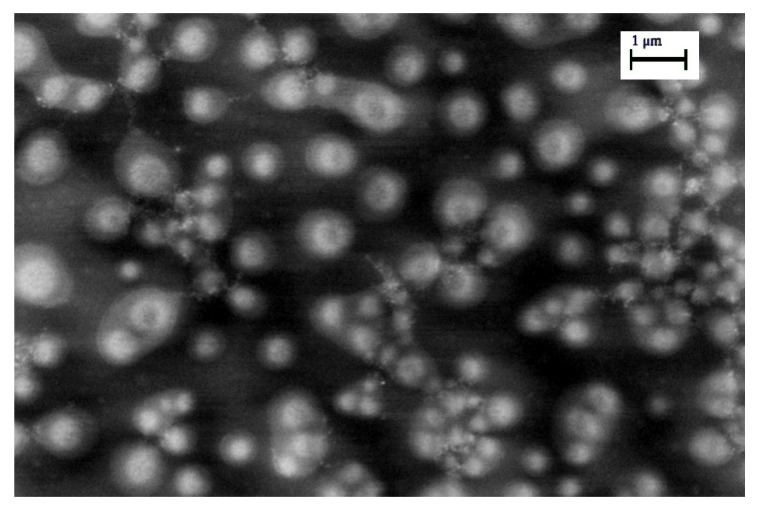
In order to obtain additional information, SEM measurements were performed (as reported in Figure 11) that clearly show early stage clusters of AgNPs collapsing at Ni2+ concentration of 7.5 µM; it is evident the formation of lattice consists of NP subclusters, each being about a micron size.
Figure 11.
Morphology of AgNPs@11MUA after addition of 7.5 µM of Ni2+. Operative condition: 7.00 kV, WD = 1.4 mm and Mag = 19.17 kX.
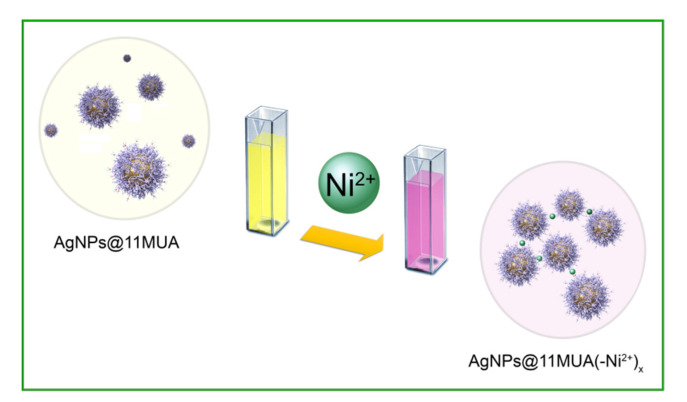
A schematic representation of the clustering process between AgNPs@11MUA and Ni ions is reported in Figure 12.
Figure 12.
Schematic clustering process in the in the interaction of Ni2+ ions with AgNPs@11MUA.
Given the sigmoidal shape of the titration curve, the interaction of AgNPs@11MUA with Ni2+ can be considered a random-like process that is regulated by apparent cooperativity, i.e., the binding of the first Ni2+ ion to the AgNPs@11MUA is associated with a structural modification that results in a more favorable binding of subsequent ones. Specifically, the increase in Ni2+ concentration is associated with higher clustering rate, faster appearance, and increase in intensity of the second SPAB, and consequent faster response of the sensor. Conversely, the increasing steric hindrance and the critical size of NPs-Ni2+ clusters represent the limiting factors of the sensor. Therefore, by adapting Hill’s equation [55] to our system, it was possible to obtain quantitative information on the mechanism of the formation of a superlattice of nanoparticles. AgNPs@11MUA can be considered as a macromolecule with n binding sites, n corresponding to the number of accessible COO− groups of surface-bound 11MUA. Hill’s equation relates the saturation to unsaturation ratio (number of occupied COO− to the number of free COO− ratio) to the concentration of the ligand (Ni2+).
In our system the saturation () can be calculated as Equation (3):
| (3) |
where Abs Ratioi is the value obtained for the generic concentration of Ni2+, and Abs Ratiomax is the value obtained at asymptotically high concentrations of Ni2+ (corresponding to “d” parameter from Equation (1). Consequently, unsaturation can be calculated as 1 − . Hill’s equation can be expressed as in Equation (4):
| (4) |
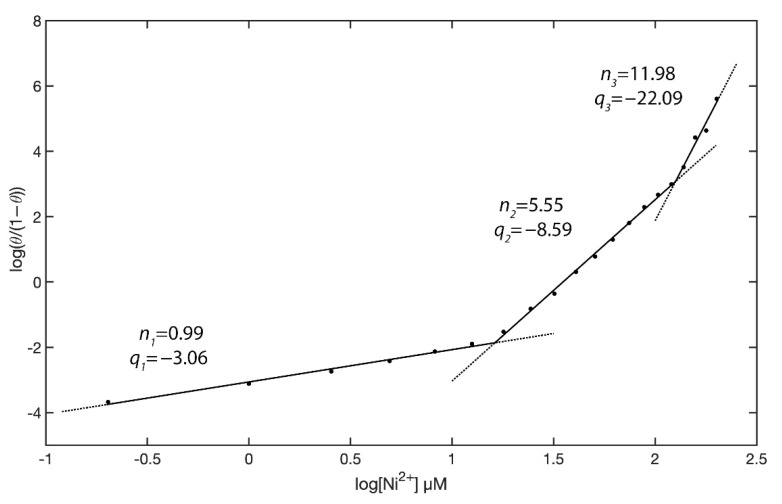
where n is the Hill’s coefficient and indicates the average number of bridging Ni2+ ions between two AgNPs@11MUA (i.e., the number of AgNPs@11MUA molecules forming the cluster), and KD is the equilibrium constant for AgNPs@11MUA clustering. The Hill plot (Figure 13) displays three different linearity zones, with individual slopes being n1 = 0.99, n2 = 5.55, and n3 = 11.98.
Figure 13.
Hill plot for at AgNPs@11MUA binding to increasing concentrations of Ni2+. Local linear fits to Equation (3) are displayed as solid lines.
These data suggest the existence of a different average number of bridging Ni2+ (-Ni2+-) between AgNPs@11MUAs at different concentrations of free Ni2+. Specifically, (-Ni2+-) = 1 being prevalent for Ni2+ concentrations in the range 0–3 µM, (-Ni2+-) = 5/6 being prevalent for Ni2+ concentrations in the range 3–7 µM, and (-Ni2+-) = 12 being prevalent for Ni2+ concentrations in the range 7–10 µM.
Most interestingly, the intermediate zone corresponded to the linearity range of the proposed AgNPs@11MUA sensor, with the AgNPs@11MUA cluster linked by (-Ni2+-) = 5/6 thus being inferred as the ideal sensing cluster. At higher concentrations of Ni2+, the NPs cluster further increased in size but were likely to precipitate, causing the superlattice (and the surface plasmon absorption) to collapse.
4. Conclusions
In this paper, we reported on the synthesis and functionalization of silver nanoparticles, which can be exploited as a sensor for metal ions. The nanoparticles were obtained by chemical reduction with NaBH4, then they were functionalized with bifunctional 11MUA exploiting the affinity between thiol groups and the silver NPs surface. Upon chemical and structural characterization, these nanoparticles have been demonstrated to be spherical, with a maximum diameter size around 20 nm and a successful coating with 11MUA. Furthermore, these NPs were shown to associate into larger clusters in the presence of divalent cations that act as bridges between COO− groups of 11MUA, eventually forming a “superlattice”. Interestingly, this aggregation phenomenon led to a major change in optical properties of the NPs suspension, consisting of the progressive decrease in the intensity of the main SPAB at 417 nm (associated with the “monomeric” functionalized nanoparticle) and the appearance of a secondary SPAB at 477 nm, which increased in intensity with metal ions concentration. The higher rate in NPs clustering upon the addition of Ni2+ with respect to the other metal ions of interest (and the consequent faster change in absorbance at 417 nm and 477 nm) allowed the use of AgNPs@11MUA as a rapid colorimetric sensor for the qualitative detection of micromolar levels of Ni2+ ions in water with acceptable selectivity.
Acknowledgments
The authors are grateful to the School of Science and Technology of University of Camerino for the support and scientific resources such as FE-SEM equipment.
Supplementary Materials
The following are available online at https://www.mdpi.com/article/10.3390/nano11071733/s1, Figure S1: UV-VIS signal deconvolution of (a) AgNPs@11MUA and (b) AgNPs@11MUA after addition of 7.5 µM of Ni2+ using Fityk software, Figure S2: Comparison of titration curves of AgNPs@11MUA with increasing concentration of the metal ions of interest, Figure S3: UV-VIS spectra of AgNPs@11MUA after addition of 7.5 µM of Co2+, Mn2+, Cd2+, Cu2+, Zn2+, Fe2+, Hg2+, Pb2+, Cr3+, and Ni2+ ions, Figure S4: DLS measurements on AgNPs, Figure S5: DLS measurements on AgNPs@11MUA, Figure S6: DLS measurements on AgNPs@11MUA after addition of Ni2+.
Author Contributions
Conceptualization, methodology, validation, R.G., A.R. and M.Z.; SEM investigation and data curation A.R., M.M., L.P. and M.C.; writing—original draft preparation, R.G., A.R., M.Z. and M.C.; writing—review and editing, R.G. and M.A. All authors have read and agreed to the published version of the manuscript.
Funding
This research received no external funding.
Institutional Review Board Statement
Not applicable.
Informed Consent Statement
Not applicable.
Data Availability Statement
The completed data of this study are available from the corresponding author, upon reasonable request.
Conflicts of Interest
The authors declare no conflict of interest.
Footnotes
Publisher’s Note: MDPI stays neutral with regard to jurisdictional claims in published maps and institutional affiliations.
References
- 1.Briffa J., Sinagra E., Blundell R. Heavy metal pollution in the environment and their toxicological effects on humans. Heliyon. 2020;6:04691. doi: 10.1016/j.heliyon.2020.e04691. [DOI] [PMC free article] [PubMed] [Google Scholar]
- 2.World Health Organization . Guidelines for Drinking-Water Quality. World Health Organization; Geneva, Switzerland: 1993. [Google Scholar]
- 3.United States Environmental Protection Agency . Edition of the Drinking Water Standards and Health Advisories Tables. Office of Water; Washington, DC, USA: 2018. [Google Scholar]
- 4.Kumar V., Dwivedi S. A review on accessible techniques for removal of hexavalent Chromium and divalent Nickel from industrial wastewater: Recent research and future outlook. J. Clean. Prod. 2021;295:126229. doi: 10.1016/j.jclepro.2021.126229. [DOI] [Google Scholar]
- 5.Genchi G., Carocci A., Lauria G., Sinicropi M.S., Catalano A. Nickel: Human Health and Environmental Toxicology. Int. J. Environ. Res. Public Health. 2020;17:679. doi: 10.3390/ijerph17030679. [DOI] [PMC free article] [PubMed] [Google Scholar]
- 6.Malik L.A., Bashir A., Qureashi A., Pandith A.H. Detection and removal of heavy metal ions: A review. Environ. Chem. Lett. 2019;17:1495–1521. doi: 10.1007/s10311-019-00891-z. [DOI] [Google Scholar]
- 7.Li M., Gou H., Al-Ogaidi I., Wu N. Nanostructured Sensors for Detection of Heavy Metals: A Review. ACS Sustain. Chem. Eng. 2013;1:713–723. doi: 10.1021/sc400019a. [DOI] [Google Scholar]
- 8.Singh R., Mehra R., Walia A., Gupta S., Chawla P., Kumar H., Thakur A., Kaushik R., Kumar N. Colorimetric sensing approaches based on silver nanoparticles aggregation for determination of toxic metal ions in water sample: A review. Int. J. Environ. Anal. Chem. 2021:1–16. doi: 10.1080/03067319.2021.1873315. [DOI] [Google Scholar]
- 9.Jain R., Thakur A., Kumar P., Pooja D. Advanced Functional Materials and Sensors. Springer; Berlin, Germany: 2020. Materials in Colorimetric Detection of Water Pollutants; pp. 125–145. [Google Scholar]
- 10.Prosposito P., Burratti L., Venditti I. Silver Nanoparticles as Colorimetric Sensors for Water Pollutants. Chemosensors. 2020;8:26. doi: 10.3390/chemosensors8020026. [DOI] [Google Scholar]
- 11.Zannotti M., Vicomandi V., Rossi A., Minicucci M., Ferraro S., Petetta L., Giovannetti R. Tuning of hydrogen peroxide etching during the synthesis of silver nanoparticles. An application of triangular nanoplates as plasmon sensors for Hg2+ in aqueous solution. J. Mol. Liq. 2020;309:113238. doi: 10.1016/j.molliq.2020.113238. [DOI] [Google Scholar]
- 12.Vilela D., González M.C., Escarpa A. Sensing colorimetric approaches based on gold and silver nanoparticles aggregation: Chemical creativity behind the assay. A review. Anal. Chim. Acta. 2012;751:24–43. doi: 10.1016/j.aca.2012.08.043. [DOI] [PubMed] [Google Scholar]
- 13.Yao Y., Tian D., Li H. Cooperative Binding of Bifunctionalized and Click-Synthesized Silver Nanoparticles for Colorimetric Co2+ Sensing. ACS Appl. Mater. Interfaces. 2010;2:684–690. doi: 10.1021/am900741h. [DOI] [PubMed] [Google Scholar]
- 14.Gong J., Li G., Tang Z. Self-assembly of noble metal nanocrystals: Fabrication, optical property, and application. Nano Today. 2012;7:564–585. doi: 10.1016/j.nantod.2012.10.008. [DOI] [Google Scholar]
- 15.Sung H.K., Oh S.Y., Park C., Kim Y. Colorimetric Detection of Co2+ Ion Using Silver Nanoparticles with Spherical, Plate, and Rod Shapes. Langmuir. 2013;29:8978–8982. doi: 10.1021/la401408f. [DOI] [PubMed] [Google Scholar]
- 16.Pinelli F., Perale G., Rossi F. Coating and Functionalization Strategies for Nanogels and Nanoparticles for Selective Drug Delivery. Gels. 2020;6:6. doi: 10.3390/gels6010006. [DOI] [PMC free article] [PubMed] [Google Scholar]
- 17.Shemetov A.A., Nabiev I., Sukhanova A. Molecular Interaction of Proteins and Peptides with Nanoparticles. ACS Nano. 2012;6:4585–4602. doi: 10.1021/nn300415x. [DOI] [PubMed] [Google Scholar]
- 18.Sun H., Kong J., Wang Q., Liu Q., Zhang X. Dual Signal Amplification by eATRP and DNA-Templated Silver Nanoparticles for Ultrasensitive Electrochemical Detection of Nucleic Acids. ACS Appl. Mater. Interfaces. 2019;11:27568–27573. doi: 10.1021/acsami.9b08037. [DOI] [PubMed] [Google Scholar]
- 19.Lin Y., Liu K., Wang C., Li L., Liu Y. Electrochemical Immunosensor for Detection of Epidermal Growth Factor Reaching Lower Detection Limit: Toward Oxidized Glutathione as a More Efficient Blocking Reagent for the Antibody Functionalized Silver Nanoparticles and Antigen Interaction. Anal. Chem. 2015;87:8047–8051. doi: 10.1021/acs.analchem.5b01834. [DOI] [PubMed] [Google Scholar]
- 20.Diamai S., Negi D.P. Cysteine-stabilized silver nanoparticles as a colorimetric probe for the selective detection of cysteamine. Spectrochim. Acta Part A Mol. Biomol. Spectrosc. 2019;215:203–208. doi: 10.1016/j.saa.2019.02.101. [DOI] [PubMed] [Google Scholar]
- 21.Ravindran A., Chandran P., Khan S.S. Biofunctionalized silver nanoparticles: Advances and prospects. Colloids Surf. B Biointerfaces. 2013;105:342–352. doi: 10.1016/j.colsurfb.2012.07.036. [DOI] [PubMed] [Google Scholar]
- 22.Nguyenova H., Vokata B., Zaruba K., Siegel J., Kolska Z., Svorcik V., Slepicka P., Reznickova A. Silver nanoparticles grafted onto PET: Effect of preparation method on antibacterial activity. React. Funct. Polym. 2019;145:104376. doi: 10.1016/j.reactfunctpolym.2019.104376. [DOI] [Google Scholar]
- 23.Bryaskova R., Pencheva D., Nikolov S., Kantardjiev T. Synthesis and comparative study on the antimicrobial activity of hybrid materials based on silver nanoparticles (AgNps) stabilized by polyvinylpyrrolidone (PVP) J. Chem. Biol. 2011;4:185–191. doi: 10.1007/s12154-011-0063-9. [DOI] [PMC free article] [PubMed] [Google Scholar]
- 24.Bastús N.G., Merkoçi F., Piella J., Puntes V.F. Synthesis of Highly Monodisperse Citrate-Stabilized Silver Nanoparticles of up to 200 nm: Kinetic Control and Catalytic Properties. Chem. Mater. 2014;26:2836–2846. doi: 10.1021/cm500316k. [DOI] [Google Scholar]
- 25.Khan Z., Al-Thabaiti S.A., Obaid A.Y., Khan Z.A., Al-Youbi A.O. Effects of solvents on the stability and morphology of CTAB-stabilized silver nanoparticles. Colloids Surf. A Physicochem. Eng. Asp. 2011;390:120–125. doi: 10.1016/j.colsurfa.2011.09.015. [DOI] [Google Scholar]
- 26.Al-Thabaiti S.A., Al-Nowaiser F., Obaid A., Al-Youbi A., Khan Z. Formation and characterization of surfactant stabilized silver nanoparticles: A kinetic study. Colloids Surf. B Biointerfaces. 2008;67:230–237. doi: 10.1016/j.colsurfb.2008.08.022. [DOI] [PubMed] [Google Scholar]
- 27.Mulfinger L., Solomon S.D., Bahadory M., Jeyarajasingam A.V., Rutkowsky S.A., Boritz C. Synthesis and Study of Silver Nanoparticles. J. Chem. Educ. 2007;84:322. doi: 10.1021/ed084p322. [DOI] [Google Scholar]
- 28.Lee S.H., Jun B.-H. Silver Nanoparticles: Synthesis and Application for Nanomedicine. Int. J. Mol. Sci. 2019;20:865. doi: 10.3390/ijms20040865. [DOI] [PMC free article] [PubMed] [Google Scholar]
- 29.Hierrezuelo J., Sadeghpour A., Szilagyi I., Vaccaro A., Borkovec M. Electrostatic Stabilization of Charged Colloidal Particles with Adsorbed Polyelectrolytes of Opposite Charge. Langmuir. 2010;26:15109–15111. doi: 10.1021/la102912u. [DOI] [PubMed] [Google Scholar]
- 30.Restrepo C.V., Villa C.C. Synthesis of silver nanoparticles, influence of capping agents, and dependence on size and shape: A review. Environ. Nanotechnol. Monit. Manag. 2021;15:100428. doi: 10.1016/j.enmm.2021.100428. [DOI] [Google Scholar]
- 31.Battocchio C., Fratoddi I., Fontana L., Bodo E., Porcaro F., Meneghini C., Píš I., Nappini S., Mobilio S., Russo M.V., et al. Silver nanoparticles linked by a Pt-containing organometallic dithiol bridge: Study of local structure and interface by XAFS and SR-XPS. Phys. Chem. Chem. Phys. 2014;16:11719–11728. doi: 10.1039/C4CP01264J. [DOI] [PubMed] [Google Scholar]
- 32.Aktara M.N., Nayim S., Sahoo N.K., Hossain M. The synthesis of thiol-stabilized silver nanoparticles and their application towards the nanomolar-level colorimetric recognition of glutathione. New J. Chem. 2019;43:13480–13490. doi: 10.1039/C9NJ01360A. [DOI] [Google Scholar]
- 33.Taglietti A., Fernandez Y.A.D., Amato E., Cucca L., Dacarro G., Grisoli P., Necchi V., Pallavicini P., Pasotti L., Patrini M. Antibacterial Activity of Glutathione-Coated Silver Nanoparticles against Gram Positive and Gram Negative Bacteria. Langmuir. 2012;28:8140–8148. doi: 10.1021/la3003838. [DOI] [PubMed] [Google Scholar]
- 34.Pallavicini P., Dacarro G., Taglietti A. Self-Assembled Monolayers of Silver Nanoparticles: From Intrinsic to Switchable Inorganic Antibacterial Surfaces. Eur. J. Inorg. Chem. 2018;2018:4846–4855. doi: 10.1002/ejic.201800709. [DOI] [Google Scholar]
- 35.Tripathy S.K., Yu Y.-T. Spectroscopic investigation of S–Ag interaction in ω-mercaptoundecanoic acid capped silver nanoparticles. Spectrochim. Acta Part A Mol. Biomol. Spectrosc. 2009;72:841–844. doi: 10.1016/j.saa.2008.12.004. [DOI] [PubMed] [Google Scholar]
- 36.Caballero-Díaz E., Pfeiffer C., Kastl L., Rivera-Gil P., Simonet B., Valcárcel M., Jiménez-Lamana J., Laborda F., Parak W.J. The toxicity of silver nanoparticles depends on their uptake by cells and thus on their surface chemistry. Part. Part. Syst. Charact. 2013;30:1079–1085. doi: 10.1002/ppsc.201300215. [DOI] [Google Scholar]
- 37.Dorobantu L.S., Fallone C., Noble A.J., Veinot J.G.C., Ma G., Goss G.G., Burrell R. Toxicity of silver nanoparticles against bacteria, yeast, and algae. J. Nanoparticle Res. 2015;17:1–13. doi: 10.1007/s11051-015-2984-7. [DOI] [Google Scholar]
- 38.Borowik A., Butowska K., Konkel K., Banasiuk R., Derewonko N., Wyrzykowski D., Davydenko M., Cherepanov V., Styopkin V., Prylutskyy Y., et al. The Impact of Surface Functionalization on the Biophysical Properties of Silver Nanoparticles. Nanomaterials. 2019;9:973. doi: 10.3390/nano9070973. [DOI] [PMC free article] [PubMed] [Google Scholar]
- 39.Fan M., Thompson M., Andrade M.L., Brolo A.G. Silver Nanoparticles on a Plastic Platform for Localized Surface Plasmon Resonance Biosensing. Anal. Chem. 2010;82:6350–6352. doi: 10.1021/ac101495m. [DOI] [PubMed] [Google Scholar]
- 40.Xi M., Zhao Q., Duan R., Yuan J., Quan Y., Yang H. A reusable localized surface plasmon resonance biosensor for quantitative detection of serum squamous cell carcinoma antigen in cervical cancer patients based on silver nanoparticles array. Int. J. Nanomed. 2014;9:1097–1104. doi: 10.2147/IJN.S58499. [DOI] [PMC free article] [PubMed] [Google Scholar]
- 41.Ivanov M.R., Bednar H.R., Haes A.J. Investigations of the Mechanism of Gold Nanoparticle Stability and Surface Functionalization in Capillary Electrophoresis. ACS Nano. 2009;3:386–394. doi: 10.1021/nn8005619. [DOI] [PMC free article] [PubMed] [Google Scholar]
- 42.Haes A.J., Zou S., Schatz G.C., Van Duyne R.P. Nanoscale Optical Biosensor: Short Range Distance Dependence of the Localized Surface Plasmon Resonance of Noble Metal Nanoparticles. J. Phys. Chem. B. 2004;108:6961–6968. doi: 10.1021/jp036261n. [DOI] [Google Scholar]
- 43.Malinsky M.D., Kelly K.L., Schatz G.C., Van Duyne R.P. Chain Length Dependence and Sensing Capabilities of the Localized Surface Plasmon Resonance of Silver Nanoparticles Chemically Modified with Alkanethiol Self-Assembled Monolayers. J. Am. Chem. Soc. 2001;123:1471–1482. doi: 10.1021/ja003312a. [DOI] [Google Scholar]
- 44.Riboh J.C., Haes A.J., McFarland A.D., Yonzon C.R., Van Duyne R.P. A Nanoscale Optical Biosensor: Real-Time Immunoassay in Physiological Buffer Enabled by Improved Nanoparticle Adhesion. J. Phys. Chem. B. 2003;107:1772–1780. doi: 10.1021/jp022130v. [DOI] [Google Scholar]
- 45.Zewde B. A Review of Stabilized Silver Nanoparticles—Synthesis, Biological Properties, Characterization, and Potential Areas of Applications. JSM Nanotechnol. Nanomed. 2016;4:1043. [Google Scholar]
- 46.Li D.X., He Q., Zhu H.F., Tao C., Li J.B. Enhanced dispersity of gold nanoparticles modified by omega-carboxyl alkanethiols under the impact of poly(ethylene glycol)s. J. Nanosci. Nanotechnol. 2007;7:3089–3094. doi: 10.1166/jnn.2007.637. [DOI] [PubMed] [Google Scholar]
- 47.Ngo Y.-L.T., Hur S.H. Low-temperature NO 2 gas sensor fabricated with NiO and reduced graphene oxide hybrid structure. Mater. Res. Bull. 2016;84:168–176. doi: 10.1016/j.materresbull.2016.08.004. [DOI] [Google Scholar]
- 48.Zhang B., Zhu T., Ou M., Rowell N., Fan H., Han J., Tan L., Dove M., Ren Y., Zuo X., et al. Thermally-induced reversible structural isomerization in colloidal semiconductor CdS magic-size clusters. Nat. Commun. 2018;9:1–10. doi: 10.1038/s41467-018-04842-0. [DOI] [PMC free article] [PubMed] [Google Scholar]
- 49.Laborda F., Jiménez-Lamana J., Bolea E., Castillo J.R. Selective identification, characterization and determination of dissolved silver(i) and silver nanoparticles based on single particle detection by inductively coupled plasma mass spectrometry. J. Anal. At. Spectrom. 2011;26:1362–1371. doi: 10.1039/c0ja00098a. [DOI] [Google Scholar]
- 50.Pauw B.R., Kästner C., Thünemann A.F. Nanoparticle size distribution quantification: Results of a small-angle X-ray scattering inter-laboratory comparison. J. Appl. Crystallogr. 2017;50:1280–1288. doi: 10.1107/S160057671701010X. [DOI] [PMC free article] [PubMed] [Google Scholar]
- 51.Weiping C., Lide Z. Synthesis and structural and optical properties of mesoporous silica containing silver nanoparticles. J. Phys. Condens. Matter. 1997;9:7257–7267. doi: 10.1088/0953-8984/9/34/015. [DOI] [Google Scholar]
- 52.Gottschalk P.G., Dunn J.R. The five-parameter logistic: A characterization and comparison with the four-parameter logistic. Anal. Biochem. 2005;343:54–65. doi: 10.1016/j.ab.2005.04.035. [DOI] [PubMed] [Google Scholar]
- 53.Inczedy J., Lengyel T., Ure A.M. IUPAC Compendium of Analytical Nomeclature, In Orange Book Definite Rules 1997. IUPAC; Research Triangle Park, NC, USA: 1998. [Google Scholar]
- 54.Si K.J., Chen Y., Shi Q., Cheng W. Nanoparticle Superlattices: The Roles of Soft Ligands. Adv. Sci. 2018;5:1700179. doi: 10.1002/advs.201700179. [DOI] [PMC free article] [PubMed] [Google Scholar]
- 55.Laban B., Vodnik V., Dramićanin M., Novaković M., Bibić N., Sovilj S.P., Vasić V.M. Mechanism and Kinetics of J-Aggregation of Thiacyanine Dye in the Presence of Silver Nanoparticles. J. Phys. Chem. C. 2014;118:23393–23401. doi: 10.1021/jp507086g. [DOI] [Google Scholar]
Associated Data
This section collects any data citations, data availability statements, or supplementary materials included in this article.
Supplementary Materials
Data Availability Statement
The completed data of this study are available from the corresponding author, upon reasonable request.


