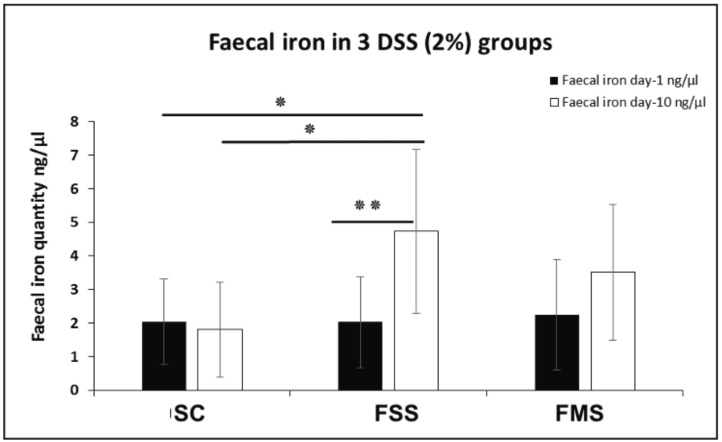
Figure 4.
Faecal iron concentration at two different time points (day 1 and 10) for three DSS-treated groups of mice (SC, FSS and FMS diets). Data are presented as a mean ± standard error of the mean. Differences were tested by t-test (inter-comparison) and by one-way ANOVA (intra-comparison) followed by post hoc test. (* p < 0.05, ** p < 0.01).

