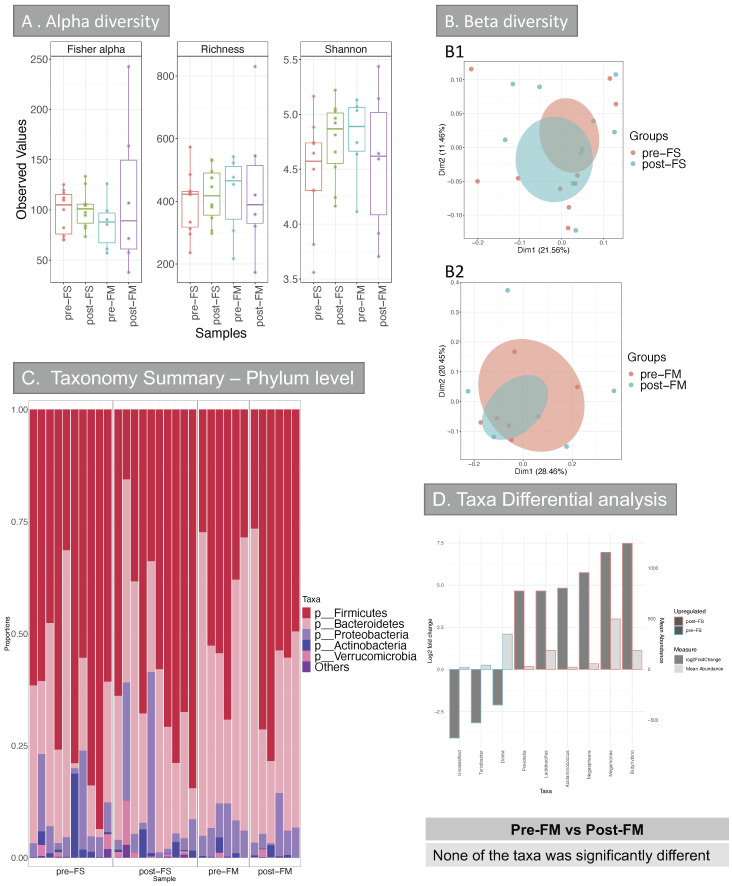
Figure 6.
Alpha and Beta diversity, and taxonomy results of the intestinal microbiome (Human cohort). (A) Alpha diversity (OTUs level) of the intestinal microbiome from the 4 groups: pre-FS, post-FS, pre-FM, post-FM. Three indices were considered: Fisher alpha (a parametric index that models species’ abundance as logseries distribution), richness (number of species) and Shannon index (a widely used index that considers species’ abundance and evenness). Pair-wise ANOVA was calculated between the groups, but none was significant. (B) Beta diversity results (B1/B2) Principal Co-ordinate Analysis (PCOA) showing c––lustering of samples. The chart was produced using unweighted UniFrac (UniFrac) at OTUs level. Ellipses are 95% confidence interval of standard error. PERMANOVA analysis comparing the groups for all the distances (Bray-Curtis, unweighted UniFrac (UniFrac) and weighted (W. UniFrac)) were not significant. (C) Taxonomy summary at phylum level. (D) Taxa differential analysis at genus level are presented through bar charts, which show Log2 fold change between pre-FS vs. post-FS samples, (y axis on the left and dark grey bar) and the mean abundance across all the samples (y axis on the right and light grey bar). The comparison of samples from patients that were given FM before and after treatment (pre-FM vs. post-FM) did not give any significant results at any of the taxonomical levels analysed (phylum, class, order, family, genus and OTUs). Detail of taxa differential analysis results, including p values and adjusted p values, is in Supplementary Table S3. FS = ferrous sulphate and FM = ferric maltol.

