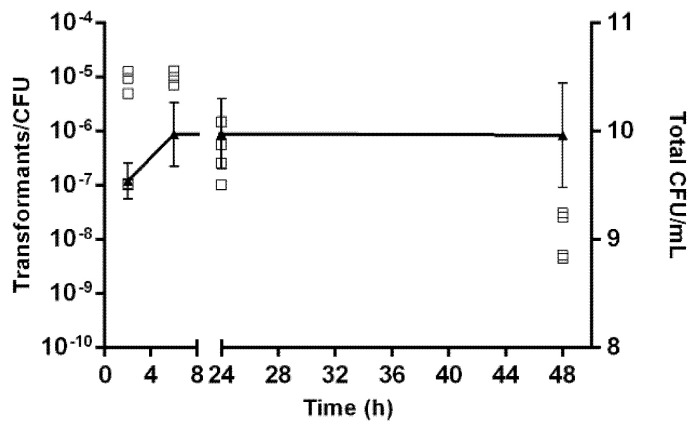
Figure 2.
The growth curve and transformation frequencies of Aliarcobacter butzleri DQ40A1 strain. Growth was quantified by CFU/mL counting (▲) being presented as mean ± standard deviation, and transformation frequency was evaluated by adding isogenic chromosomal DNA (DQ40A1ΔareB::kanR) at different time points (□). Results from at least three independent assays.

