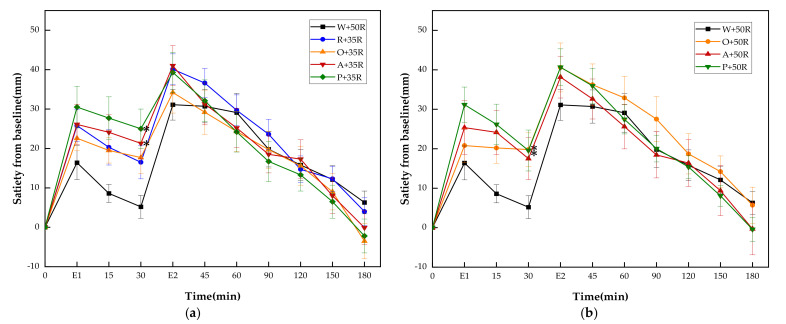
Figure 5.
(a) Satiety responses for reference and IC test meals; (b) satiety responses for reference and HC test meals. E1, the end point of preload consumption; E2, the end point of rice consumption. G, glucose; R, rice; O, oranges; A, apples; P, pears; W, water. Data are given as mean ± SE, n = 14. * Test meals different from W + 50R.

