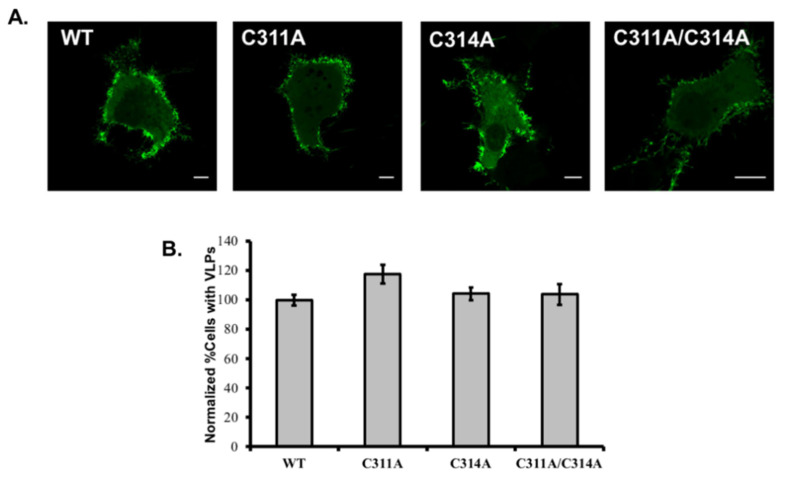
Figure 3.
EGFP-VP40 and VP40 cysteine mutants cell phenotype. (A) Representative images of EGFP-VP40-WT, EGFP-VP40-C311A, EGFP-VP40-C314A and EGFP-VP40-C311A/C314A 12–14 h post transfection in COS-7 cells. Scale bars are 10 μm. (B) Cell populations expressing pre-VLPs, data was normalized to 100% for cells expressing EGFP-VP40-WT with detectable VLPs to more easily differ an increase (or not) in VLPs by each mutation. Bars represent the average value over three independent experiments and error bars represent ± standard error of the mean.

